We dove into the data to see what retail foot traffic trends can tell us about what to expect this holiday season.
Maytal Cohen
Oct 3, 2024
4 minutes
With Q4 2024 just underway, retailers are already gearing up for the all-important holiday season. A condensed shopping window – just 27 days between Thanksgiving and Christmas this year – is prompting many to launch early deals and promotions. And though consumers remain cautious, shoppers are expected to spend more this year than they did in 2023.
But what can recent visitation trends tell us about how this year’s holiday season will really play out? We dove into visit data for various retail categories and chains to try and predict what’s in store for the all-important fourth quarter of 2024.
Promising Year, Promising Season
A look at the overall state of brick-and-mortar retail this year offers a glimpse into what we can expect this holiday season.
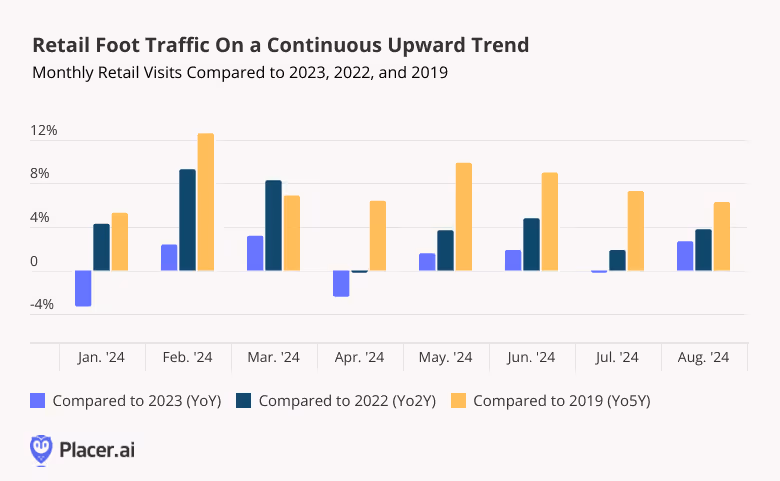
Since January 2024, monthly retail foot traffic has generally been on an upswing, with YoY visits up most months since January 2024 – and foot traffic higher than in 2022 or 2019 (pre-pandemic). This steady rise in retail visits signals strong consumer engagement in 2024, setting the stage for what may turn out to be a robust Q4.
2024’s Special Calendar Day Pull
Holiday promotions are kicking off early this year, offering customers more time to take advantage of deals and helping retailers navigate supply chain and logistics challenges. And though early sales are nothing new, 2024’s shorter holiday shopping season may suffuse them with more significance than ever.
In 2023, Thanksgiving fell on November 23rd, leaving consumers with 32 days in which to do their holiday shopping. But this year, the holiday will be on November 28th, shortening the period between Thanksgiving and Christmas by five days. To make up for lost time, retailers and consumers alike may embrace an early shopping frenzy, potentially detracting from the power of milestones like Black Friday, Super Saturday, and Christmas Eve Eve.
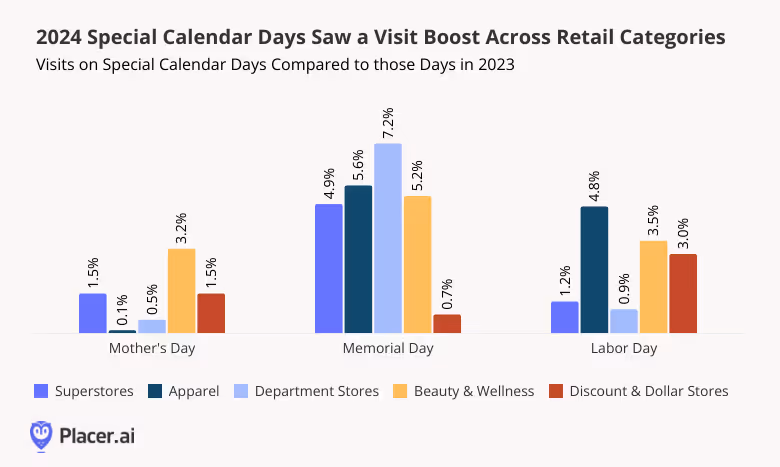
But a look at consumer behavior during special calendar days this year suggests that traditional retail milestones still very much resonate with customers. On Mother’s Day, Memorial Day, and Labor Day, key industries saw YoY visit boosts, though the magnitude of the increases varied across categories.
On Mother’s Day, for example, the beauty and wellness sector saw a 3.2% YoY increase in visits – highlighting the category’s enduring popularity for grateful offspring seeking to give mom a special gift. But on Memorial Day, department stores had their time in the sun, overshadowing other segments with a 7.2% YoY visit boost.
Overall, these occasions proved particularly effective at driving consumer engagement this year. So whether by targeting big days like Black Friday or planning extended holiday campaigns, the 2024 holiday season gives retailers a great chance to benefit from consumer excitement.
Who Will Be the Retail Winners of the 2024 Holiday Season?
While all retail categories participate in the holiday season's flurry of sales, promotions, and limited-time offers, a select few shine especially bright during this period. These segments’ strong performance can often make up for quieter stretches earlier in the year.
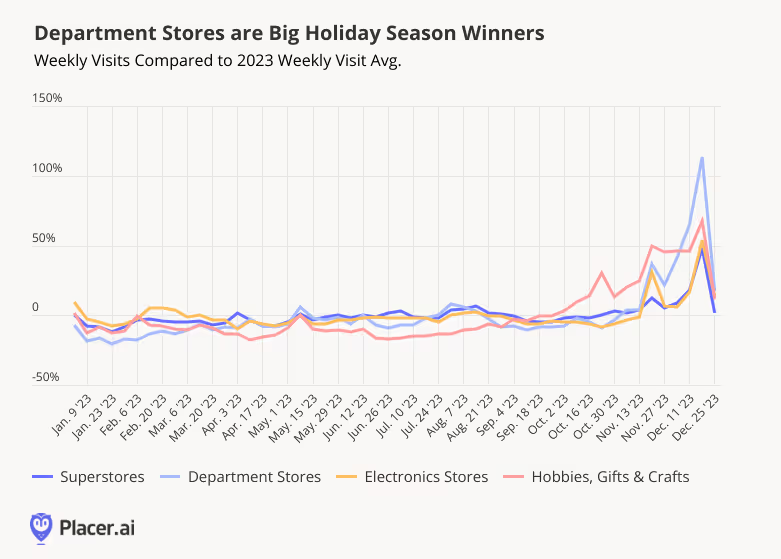
Department stores are prime examples of holiday season winners. An analysis of weekly visits throughout 2023 shows that department stores experience one of the most impressive visits spikes of the holiday season. In the week leading up to Christmas, visits to department stores surged 113.4% compared to a 2023 weekly average – highlighting the segment’s success at positioning itself as a go-to destination for holiday shopping.
Another standout during the holiday season is the hobbies, gifts, and crafts category. Unlike department stores, this category sees a more evenly-distributed rise in foot traffic across Q4, with peaks leading up to Halloween, Thanksgiving, and Christmas. This pattern reflects the popularity of holiday-related decorations and gifts, which drive increased visits during these festive periods.
These two powerhouse categories – department stores and hobbies, gifts, and crafts – are poised to dominate the 2024 holiday season, just as they did last year. And with consumer spending expected to rise and foot traffic showing no signs of slowing, both categories have significant potential for even greater success this year.
Looking Ahead
The upcoming holiday season looks on track to be a big one. Despite the shorter shopping window, retailers are taking steps to maximize shopping opportunities with early promotions. And against the backdrop of this year’s robust consumer engagement – especially around milestones – Q4 is shaping up to be a festive season indeed.
Will retailers rise to the challenge? Follow Placer.ai to see how this holiday season unfolds.
This blog includes data from Placer.ai Data Version 2.1, which introduces a new dynamic model that stabilizes daily fluctuations in the panel, improving accuracy and alignment with external ground truth sources.
Dive into the location analytics to explore Trader Joe's nationwide performance and visitor trends in its home state of California.
Ezra Carmel
Oct 2, 2024
4 minutes
Grocery stores have been on an upward foot traffic trajectory as of late, and Trader Joe’s – with its cult-like following – is often near the top of the pack.
We dove into the location analytics for the chain, exploring its nationwide performance and visitor trends in its home state of California, to uncover what’s behind the grocer’s ongoing success.
Expanding Value
Despite positive signs that food-at-home inflation is stabilizing, many consumers are still feeling the pinch of high grocery costs. And with the help of its wide range of premium-quality, private-label products, Trader Joe’s offers an upscale experience at prices that are attractive to value-conscious grocery shoppers.
Perhaps bolstered in part by several new locations, Trader Joe’s year-over-year (YoY) visit growth has outperformed the wider grocery category every month of 2024 so far. And the chain appears to be doubling down on its expansion strategy, with two dozen new stores planned through the end of 2024.
By continuing to meet consumer demand for value and quality, and through the ongoing expansion of its fleet, Trader Joe’s is likely to sustain foot traffic growth in the near future.
TJ’s in California
In addition to competitive pricing and a growing real estate footprint, examining visitor dynamics in California – Trader Joe’s largest market by far – suggests that the chain may be driving success by becoming more shoppers’ principal grocery destination.
Between January and August 2024, California Trader Joe’s experienced YoY visit growth ranging from 3.2% to 11.1% – while YoY foot traffic to the wider grocery segment ranged from -2.7% to 4.6%. And over the same period, the share of Trader Joe’s visitors that also frequented other leading California grocery chains decreased significantly – indicating that TJ’s is making inroads with some of its toughest competition in the state.
Between January and August 2023, for example, 50.1% of visitors to a California Trader Joe’s also visited Ralphs – a share that dropped to 47.1% during the equivalent period of 2024. Similar patterns could be observed for VONS, Sprouts Farmers Market, and even California’s grocery visit leader, Safeway.
This suggests that a growing percentage of Trader Joe’s shoppers may be relying on the chain for more of their essentials – rather than visiting TJ’s in addition to a traditional grocery store.
A Surplus of Singles
Diving deeper into the demographic characteristics of visitors to California Trader Joe’s provides further insight into the consumers driving the chain’s statewide YoY visit gains. Analyzing California TJ’s trade areas with data from STI: PopStats reveals that Trader Joe’s drives an outsized share of visits from singles – living on their own or with roommates.
Between January and August 2024, 26.5% of residents in Trader Joe’s California captured market lived in one-person households – compared to a statewide average of 22.9%. Meanwhile, 10.0% of the trade area residents were from non-family households – well above the state average of 8.0%.
This could be partially due to Trader Joe’s ongoing investment in college town locations, as well as its fail-safe frozen food selection – a winner with novice cooks pressed for time or space for meal-prep. Plus, Trader Joe’s boasts cheerfully-themed, seasonal products that change every few months, which may be particularly likely to resonate with college students that follow seasonal rhythms of their own.
Wrapping it Up
Trader Joe’s continues to shine in the grocery space in part due to ongoing consumer demand for value and the chain’s expansion. And in California, a loyal and disproportionately single audience is a significant driver of foot traffic.
For updates and more grocery foot traffic insights, visit Placer.ai.
This blog includes data from Placer.ai Data Version 2.1, which introduces a new dynamic model that stabilizes daily fluctuations in the panel, improving accuracy and alignment with external ground truth sources.
Bowlero Corporation operates more than 350 bowling alleys nationwide, under a portfolio of brands that includes Bowlero and AMF – the company’s two largest chains. How have the bowling alleys performed this year? We dive into the data to find out.
Lila Margalit
Oct 1, 2024
3 minutes
Bowlero Corporation operates more than 350 bowling alleys nationwide, under a portfolio of brands that includes Bowlero and AMF – the company’s two largest chains. How have the bowling alleys performed this year?
We dove into the data to find out.
Summer Success
A look at year-over-year (YoY) visitation trends shows that after a January weather-induced slump and a lackluster three months between February and April 2024, YoY visits to both Bowlero and AMF Bowling Centers picked up major steam. Beginning in May, the two chains saw consistent monthly YoY visit growth ranging from 8.4% to 21.9%.
Fleet expansions undoubtedly contributed to the chains’ summer traffic jumps – but the visit increases were likely also driven by the reintroduction of Bowlero’s popular summer season pass – redeemable across the company’s portfolio of brands – which entitles customers to two free games daily at a center of their choosing. (A premium version can be used at any of the company’s locations.) The pass, which was valid from May 24th to September 2nd, proved to be such a runawaysuccess this year that the company decided to launch a similar promotion for fall. This year’s record-breaking heat may have also contributed to the bowling alleys’ visit boosts – as consumers sought to cool down with indoor activities.
AMF: In a League of its Own
Bowlero and AMF are owned by the same company, but customers seem to interact with each brand slightly differently. Between January and August 2024, AMF attracted a higher share of frequent visitors than Bowlero – perhaps indicating the brand’s positioning as a destination for more serious bowlers and league participants.
On average, 21.4% of AMF’s visitors frequented the chain at least twice a month during the analyzed period – and 8.4% visited at least four times a month. Meanwhile, Bowlero, which touts itself as a “bowling/dining/nightlife experience,” drew smaller shares of frequent visitors – though 16.5% of Bowlero visitors turned out 2+ times a month on average during the analyzed period, and 5.7% visited at least four times a month.
Bowlero: A Family Favorite
Bowlero, which attracts more casual bowlers than AMF, is also a destination for families. Between January and August 2024, Bowlero’s captured market featured a higher-than-average share of households with children – 28.5%, compared to 26.5% for AMF and a nationwide baseline of 26.9%.
AMF, for its part, was more popular among singles: During the analyzed period, 28.6% of its captured market was made up of one-person households – more than both the nationwide baseline and that of Bowlero (26.7%).
An All-American Sport
Still, though Bowlero and AMF attract somewhat different audiences, drilling down further into the psychographic segmentation of their captured markets shows that bowling really is an all-American favorite pastime.
During the analyzed period, Bowlero’s was more likely to attract “Young Professionals” and “Near-Urban Diverse Families” – middle-class families living in and around cities – while AMF was more likely to attract upper-middle class, suburban families (“Upper-Suburban Diverse Families”) and households from “Blue Collar Suburbs”. But despite these differences, both chains attracted consumers from a variety of communities, highlighting their broad appeal.
Looking Ahead
Will consumers continue frequenting bowling alleys as the weather cools down – and will Bowlero’s autumn season pass be as successful as its summer one?
Follow Placer.ai’s data-driven analyses to find out.
This blog includes data from Placer.ai Data Version 2.1, which introduces a new dynamic model that stabilizes daily fluctuations in the panel, improving accuracy and alignment with external ground truth sources.
We took a closer look at several players in the recreational retail space – including Barnes & Noble, Half Price Books, Hobby Lobby, and Michaels – to see how they are faring as 2024 draws to a close.
Bracha Arnold & Lila Margalit
Sep 30, 2024
4 minutes
Recreational retailers – from hobby shops to arts and crafts retailers and bookstores – can play a role in fostering creativity and community.
We took a closer look at several players in the space – including Barnes & Noble, Half Price Books, Hobby Lobby, and Michaes – to see how they are faring as 2024 draws to a close.
Bookstores: A New Chapter
One of the biggest challenges traditional brick-and-mortar retailers have faced in recent decades is the rise of online shopping, especially from Amazon – ironically, a company that started as a book retailer. Yet, in 2024, brick-and-mortar bookstores are defying expectations and thriving. Nearly every month this year, chains like Barnes & Noble and Half Price Books have seen more foot traffic at their stores than in 2023.
Despite closing several locations over the past year, Half Price Books experienced significant YoY visit increases between May and August 2024 – with only July seeing a YoY lag likely reflective of the chain’s substantial July 2023 seasonal uptick. Meanwhile, Barnes & Noble – which has been expanding its fleet – saw YoY foot traffic increases ranging from 8.0% to 17.2% throughout the analyzed period. Both chains finished off the summer with impressive 14.3% (Barnes & Noble) and 10.3% (Half Price Books) YoY boosts.
Analyzing monthly fluctuations in visits to the two chains relative to a January 1, 2021 baseline shows just how important both the summer and holiday seasons are for the two bookstores. As brands that cater to both families and college students (see below), Barnes & Noble and Half Price Books see significant annual summer visit upticks in July and August – likely boosted by back-to-school shopping. But particularly for Barnes & Noble, the real magic happens during the holiday season, when people flock to the chain in search of gifts for loved ones.
Bookstores’ strong performance shows that consumers are voting with their feet – embracing the special – and irreplaceable –reading and browsing experience provided by brick-and-mortar stores. And with a strong summer under their belts, Barnes & Noble and Half Price books have every reason to expect a highly successful Q4 2024.
Reading Into The Demographics
Diving into trade area demographics shows that both Barnes & Noble and Half Price Books appeal to diverse audiences – outperforming nationwide baselines for everything from “Wealthy Suburban Families” to “Young Professionals” (a segment group that includes college students) and “Blue Collar Suburbs”. Still, there are differences between the two chains – offering opportunities for the retailers to tailor their marketing strategies to align with their respective visitors.
Barnes & Noble’s captured market trade area, for example, features a higher share of the middle-class “Near Urban Diverse Families” segment group – while that of Half Price Books features higher shares of the other analyzed segments. The chains’ different audiences can help them strategically curate their book assortments and offer a more tailored experience for their customers – a strategy that Barnes & Noble has placed at the center of its blueprint for growth.
Hobby Stores: Redesigning Their Futures
While bookstores have thrived in 2024, craft stores have faced a more mixed performance. Hobby Lobby and Michaels both experienced varying YoY foot traffic trends, with monthly visits tracking closely with 2023’s. Still, August 2024 visits were elevated by 7.9% and 6.0% at Hobby Lobby and Michaels, proving the significance of the back-to-school season.
Summer Sales Boosts
Weekly visit data further highlights the significant impact of the back-to-school season on craft retailers – which offer both classroom decor and school supplies. As the shopping season kicked in, Hobby Lobby and Michaels both experienced notable increases in foot traffic compared to their year-to-date (YTD) averages.
The week of September 2, 2024 in particular was a strong one across both chains, with visits surging to their highest levels relative to the YTD average. Hobby Lobby experienced an 18.3% surge in visits and Michaels grew by 15.9%. This data emphasizes the critical role seasonality plays in driving traffic to craft retailers, particularly during key periods like back-to-school, when customers are stocking up on supplies. And since the category usually sees its biggest monthly spike during the holiday season (December 2023 visits to Hobby Lobby were 57.7% higher than the 2023 monthly visit average and 52.1% higher at Michaels), the chains seem poised to see more visitors in the coming months. October visits will also likely rise for the two chains, as customers go on the hunt for fall decor.
Crafting Visitation Growth
Hobby and recreational stores have shown resilience and adaptability in 2024, with strong seasonal peaks and diverse customer bases fueling their visits. With the holiday season fast approaching, these companies seem set to continue experiencing foot traffic boosts for the rest of the year.
Visit Placer.ai to keep up with the latest data-driven retail news.
This blog includes data from Placer.ai Data Version 2.1, which introduces a new dynamic model that stabilizes daily fluctuations in the panel, improving accuracy and alignment with external ground truth sources.
Read on for a taste of our findings from one of our white papers released in September 2024: The Healthcare Opportunity in Grocery, which explores wellness offerings' impact on grocery store visitation patterns.
Today, many grocery stores offer a range of services – from primary and urgent care to dental and mental health care. In addition to providing an important community service, in-store clinics can boost foot traffic at chains, help health providers reach more patients, and allow shoppers to manage their health and home needs in one convenient trip.
Health Clinics Lead to Healthy Foot Traffic Boosts
Analyzing foot traffic to grocery stores with and without in-store clinics shows that across chains, locations with on-site healthcare offerings drew more visits in H1 2024 than their chain-wide averages.
The Kroger Co., for example, has been a leader in in-store healthcare services since the early aughts. The company introduced its in-store medical center, The Little Clinic in 2003 – and today operates over 225 Little Clinic locations across its Kroger banner, as well as regional chains Dillons, Jay C Food Stores, Fry’s, and King Soopers.
And in H1 2024, the eight Dillons locations with clinics saw, on average, 93.0% more visits per location than the chain’s banner-wide average. Jay C, which offers two in-store clinics, also saw visits to these venues outpace the H1 2024 banner-wide average by 92.9%. For both chains, relatively small overall footprints may contribute to their outsize visit differences: Indiana-focused Jay C operates just 22 locations, all in the Hoosier State, while Kansas-based Dillons has some 64 locations.
But similar patterns, if somewhat less pronounced, could be observed at Kroger (43.0%), Fry’s (19.2%), and King Soopers (16.5%) – as well as at H-E-B (14.5%), which boasts its own expanding network of in-store clinics.
Convenience for All: Clinics Draw Families
An analysis of household compositions across the potential and captured markets of Kroger-owned stores with and without Little Clinic offerings suggests that families with children are extremely receptive to these services.
In H1 2024, Kroger, King Soopers, Fry’s, Jay C, and Dillons all featured captured markets with higher shares of STI: PopStats’ “Households With Children” segment than their potential ones – highlighting the chains’ appeal for families. But the share of parental households in those stores with Little Clinics jumped significantly higher for all five banners.
The share of families with children in King Soopers’ overall captured market stood at 28.3% in H1 2024, higher than the 27.2% in its potential one. But the households with children in the captured markets of King Soopers locations with Little Clinics was significantly higher – 30.6% – and similar patterns emerged at Jay C, Dillons, Kroger, and Fry’s.
This special draw is likely linked to the clinics' focus on family health services like physicals, nutrition plans, and vaccines. The convenience of being able to take care of healthcare, grocery shopping, and pharmacy needs all in one go makes these stores particularly attractive to parents. And this jump in foot traffic shows the strategic advantage of incorporating healthcare services into the retail environment.
Read the full report here to learn more about the impact of healthcare services on grocery visits and customer loyalty. Are shoppers more or less likely to make repeat visits to grocery stores with healthcare services? And how does the addition of a clinic affect the demographic profile of a grocery store’s captured market?
For more data-driven consumer research, visit our resource library.
As summer winds down, we dove into the data to explore consumer behavior at quick-service and fast-casual restaurants. How are they performing this year? And do consumers still interact differently with the two categories?
Lila Margalit
Sep 25, 2024
3 minutes
2024 has been a good year for fast-casual restaurants. Limited-time offers notwithstanding, rising QSR prices have narrowed the price gap between fast food and the more premium offerings of chains like Chipotle and sweetgreen. And with many fast-casual restaurants upping their convenience games with drive-thrus and other innovations, the distinction between the two segments has become increasingly muddied.
So with summer winding down, we dove into the data to explore segment-level consumer behavior at quick-service and fast-casual restaurants. How are they performing this year? And do consumers still interact differently with the two categories?
We dove into the data to find out.
Fast-Casual Rocks Weekdays
During the first half of 2024, fast-casual restaurants experienced 3.2% year-over-year (YoY) visit growth, while QSR held steady with a minor 0.4% uptick. As QSR favorites have gotten pricier, some budget-conscious diners have responded by trading up – embracing elevated fast-casual experiences that hit the sweet spot between quality and affordability.
Drilling down deeper into the data, however, paints a more nuanced picture. On weekends, both QSRs and fast-casual chains experienced positive YoY visit growth (2.1% and 4.0%, respectively) – a significant difference, but not a tremendous one. On their days off, it seems, Americans are opting for a variety of value-oriented indulgences, and both segments are benefiting.
But on weekdays, fast-casual foot traffic grew by 2.8%, while QSR visits declined slightly by 0.2%. As the return-to-office (RTO) continues apace, more affluent office workers may be driving a weekday fast-casual renaissance.
QSR Close to Home – Fast-Casual at the Office?
A look at driving distances to QSR and fast-casual restaurants provides further evidence that commuters may be contributing to fast-casual’s weekday YoY visit growth.
In H1 2024, a higher share of QSR visits came from customers hailing from CBGs less than two miles away from the restaurants – suggesting that QSR visitors were more likely to frequent local, neighborhood venues. Meanwhile, a significantly higher percentage of fast-casual visits (63.6%) originated from CBGs between two and 30 miles away, compared to just 56.8% for QSR. These less-local visitors may be stopping by a fast-casual establishment during their lunch break or after work, on days when they commute to the office.
Interestingly, QSRs and fast-casual restaurants drew similar shares of visitors from CBGs more than 30 miles away – perhaps suggesting that when traveling, consumers enjoy frequenting both segments.
The $75K-$100K Sweet Spot
Given fast-casual’s higher-quality offerings, it may come as no surprise that these chains tend to attract a more affluent clientele than their QSR counterparts. During the first half of 2024, the Census Block Groups (CBGs) feeding visitors to QSRs (i.e. their captured market) had a weighted median household income (HHI) of $65.7K – compared to $78.0K for fast-casual chains.
But medians only tell a part of the story – and a closer look at the segments’ visitor bases reveals a striking similarity between them: In H1 2024, the two categories’ captured markets featured nearly equal shares of a key demographic – households earning between $75K and $100K per year. This group includes both average-income families and those with a bit more money to spend. (According to STI:PopStats, the nationwide median HHI stands at $76.1K). And the ability of both quick-service restaurants and fast-casual chains to attract these consumers shows that despite their differences, the two segments do overlap – and both have plenty to offer today’s consumers.
Looking Ahead
Despite still-high prices, consumers are finding room in their budgets for affordable splurges – and fast-casual restaurants and QSRs (at least on weekends) are benefiting. How will the two segments continue to fare in the upcoming holiday season? And will their demographic middle ground expand as the line between the two categories continues to blur?
Follow Placer.ai’s data-driven restaurant analyses to find out.
This blog includes data from Placer.ai Data Version 2.1, which introduces a new dynamic model that stabilizes daily fluctuations in the panel, improving accuracy and alignment with external ground truth sources.
How shifting consumer priorities are reshaping value perceptions across QSR, fast casual, and casual chains.
July 9, 2026
The New Definition of Value
As consumer sentiment hovers near historic lows and the cost of goods remains elevated, value has become a defining theme across the dining industry. Yet within the sector's diverse restaurant categories – and for individual brands – the question is no longer whether consumers are seeking value, but what value actually means. A closer look at chains across the industry suggests that, amid ongoing economic pressure, perceptions of value are evolving. For some consumers, value may be tied to affordability and promotions; for others, it may come from quality, convenience, or experience. The result is a market with multiple paths to winning consumer traffic.
Dining Traffic Remains Unstable in 2026
After an uneven but largely resilient 2025, dining traffic in 2026 tipped into a sustained decline.
Monthly visits to the overall dining industry have trailed year-ago levels throughout 2026, with February standing as the lone exception. That month saw a 3.7% year-over-year (YoY) increase in visits, driven in part by comparisons to the period of initial tariff announcements in early 2025. But broader trends remained challenged, and May's 2.5% YoY decline marked the steepest monthly drop of the past twelve months as rising gas prices and weakening consumer sentiment appear to have added pressure to an industry already navigating a difficult environment.
Breaking Down the Industry
These headwinds, though, have not landed evenly. Across the dining sector, some segments have faced more intense pressure than others, with much of the divide coming down to how consumers are perceiving value against experience.
QSR’s Value Proposition Under Pressure From Grocery Stores & Superstores
Over the past several years, inflation and rising menu prices have gradually weakened a cost-based value proposition that has long been central to the QSR segment. More recently, elevated gas prices have added another deterrent, making a trip through the drive-thru a less compelling choice for some consumers.
Strong performance at grocery stores and superstores suggests that competition for share-of-stomach is increasingly extending beyond traditional restaurant rivals. With expanding selections of ready-to-eat and pre-prepared meals, these channels are offering consumers a combination of value, convenience, and quality that can increasingly match limited-service dining options. At the same time, ongoing pressure on household budgets appears to be driving more consumers toward lower-cost meals made at home, creating additional headwinds for the QSR segment.
Fine Dining and the Fast Casual Middle Hold Firm
Yet for many consumers, there is still a time and place for dining out, and in the face of mounting economic pressure, several dining formats have found foot traffic success. Fine dining has posted traffic growth in nearly every month of 2026, with March standing as the lone exception. That decline was likely influenced by a calendar shift, as March 2026 contained one fewer Saturday than March 2025 – a meaningful headwind for full-service restaurants given the outsized role weekends play in driving visits. The segment's sustained growth points to the resilience of higher-income consumers and the enduring appeal of premium, occasion-driven dining experiences.
Fast casual and casual dining have also proven relatively resilient. The fast casual category saw positive YoY foot traffic in every month of 2026 so far, while casual dining's performance has rebounded since the March calendar shift that likely weighed on YoY traffic. A second calendar shift in May 2026 led to an extra Saturday in the month, which likely helped the segment's overall trend. These trends suggest that both fast casual and casual dining occupy an increasingly attractive middle ground where value is defined as a combination of affordability and experience. At the same time, years of menu price hikes at QSR chains have altered the cost equation in fast casual and casual dining's favor, narrowing the price gap between fast food and more elevated dining formats. As that gap has narrowed, consumers may be placing greater emphasis on experience and quality when deciding where to dine.
Inside the Playbooks of Fast Casual Standouts
The balance between price and elevated experience has made fast casual a favorite for value in the dining industry in 2026. A closer look at two of the segment's largest players, CAVA, a relatively young concept, and Chipotle, a legacy chain navigating operational challenges, shows how brands can deliver on that value proposition in different ways and win in today’s dining landscape.
Chipotle Creates Value With LTO Experiences and Loyalty Perks
Chipotle's traffic trends in 2026 have improved compared to 2025, with the brand offering a clear example of how fast casual brands can create value by pairing menu innovation with loyalty perks.
Chipotle outpaced the broader fast casual category in YoY visits nearly every week of 2026 so far. And the graph below shows that the chain's strongest traffic gains tended to coincide with major menu launches and loyalty initiatives – a key component of its ongoing "Recipe for Growth" strategy.
The return of fan-favorite Chicken al Pastor in the week of February 9, 2026 helped drive a 16.6% YoY increase in visits. Two months later, the launch of "Rewards on Repeat" – a refreshed loyalty program offering freebies upon sign-up – generated the period's largest weekly traffic gain, with visits rising 18.2% YoY. And the introduction of Honey Chicken on April 28 provided another boost, as the chain continued to rotate limited-time protein offerings and give customers reasons to return.
These performance peaks suggest that Chipotle has been particularly effective at pairing menu novelty with loyalty perks to reinforce a value proposition anchored by quality and experience.
Chipotle's "Recipe for Growth" Drives Traffic With Loyalty and LTO Launches
Year-over-Year Change in Weekly Visits, Chipotle vs. Fast Casual, Jan.–Jun. 2026
ChipotleFast Casual
Dashed lines mark key Chipotle promotional launch dates. Week-of dates shown; launches may have occurred mid-week.
Share
Embed:
CAVA Expansion and Differentiated Dining Experience
If Chipotle illustrates the power of menu innovation and loyalty-driven engagement, CAVA highlights a different approach to creating value – one rooted in variety, customization, and a consistently differentiated dining experience.
CAVA's overall visits climbed well above 20% YoY in every month of 2026, a pace largely driven by aggressive unit expansion. Meanwhile, same-store visits, which measure traffic at locations open for at least twelve months, sustained positive YoY growth – evidence of genuine demand at existing restaurants alongside a rapidly growing footprint.
While Chipotle leans on limited-time offers, CAVA's growth rests on a consistent, customizable experience. A deep roster of proteins paired with a wide range of bases, dips, and toppings, gives the chain built-in variety that helps keep the concept feeling fresh. In addition, CAVA's Mediterranean-inspired menu offers flavors and combinations that are less easily replicated at home, helping the brand maintain a differentiated experiential value proposition and drive growth.
O Though Chipotle and CAVA are at different points in their evolution and have taken different paths to growth, both highlight the enduring appeal of fast casual's balance of value and quality. In a dining environment where consumers are increasingly weighing cost against experience, the segment's ability to deliver on both has helped make it one of the industry's strongest-performing formats.
Casual Chains Thrive On Everyday Value
Fast casual isn't the only dining segment benefiting from consumers' evolving perception of value. In 2026, several casual dining chains have found success by pairing accessible price points with the elevated experience of a sit-down meal.
Brands such as BJ's Restaurant & Brewhouse, Chili's Grill & Bar, Bonefish Grill, Cicis, and The Cheesecake Factory all posted positive YoY visit growth in multiple months this year, demonstrating that even in a challenging economic environment, diners are motivated when they feel they are getting more in return. These results are particularly notable given the impact of calendar shifts, which weighed on March 2026 comparisons – and provided a tailwind to May performance.
Unlike many fast casual chains, these brands have not relied heavily on a steady stream of limited-time offers to drive traffic. While menu innovation remains part of the playbook, promotions often serve as ticket builders or engagement tools rather than primary traffic catalysts. Instead, these successful casual dining chains have focused on creating everyday value that diners can depend on, narrowing the price gap between limited-service restaurants and full-service dining.
The result is a value equation that encompasses table service, a more relaxed dining environment, and a place to socialize or celebrate an occasion. In an environment where consumers are increasingly weighing cost against overall experience, that combination appears to be helping several casual dining chains maintain positive traffic momentum.
The State of Dining in 2026
Although dining traffic has softened in 2026, the industry's performance suggests that consumers have not stopped spending on restaurants altogether. Instead, they have become more selective about where they dine and what they expect in return.
Across segments, the strongest performers have found different ways to deliver value. For some brands, that means menu innovation, loyalty engagement, and differentiated experiences. For others, it means dependable affordability paired with the service and atmosphere of a sit-down meal. As economic pressures continue to shape consumer behavior, the data suggests that value is no longer defined by price alone, but by the balance of cost, convenience, quality, and experience.
Find out where Americans are moving in 2026, why they're relocating, and how developers, investors, and retailers can stay ahead of the trends.
June 18, 2026
The Geography of Domestic Migration
During the pandemic and its aftermath, Americans were on the move. Millions left expensive coastal markets for lower-cost destinations across the Sun Belt, while boomtowns such as Bozeman, Boise, and Austin struggled to keep pace with the influx of new residents.
That wave of relocation has since cooled, as return-to-office mandates, higher mortgage rates, and a shrinking affordability gap between coastal cities and many COVID-era hotspots have dampened the incentive to move. But even in a slower market, domestic migration remains one of the most powerful forces shaping local economies, housing markets, and consumer demand.
This report leverages AI-powered location analytics to examine the relocation patterns reshaping the United States in 2026 – where Americans are moving, the demographic and economic forces driving those decisions, and how retailers, investors, developers, and policymakers can respond to the opportunities and challenges created by these shifts.
Which major metros are attracting the most new residents? Which pandemic-era standouts have seen growth stall or reverse? And what factors best predict a large metro area's domestic migration growth potential in 2026?
Interstate Flows: Which States Gained and Lost Residents?
South Carolina and Delaware Set the Pace
The latest statewide migration data shows that the slower relocation pace observed in 2024 persisted into 2025. No state recorded net inflows or outflows exceeding 0.7% of its starting population. And while several smaller states continued to attract new residents at meaningful rates, none of the nation's six most populous states saw net in-migration exceed 0.2%.
Among those smaller states, South Carolina and Delaware led the nation with net in-migration equal to 0.7% of their populations, followed by Idaho (0.6%), Maine (0.5%), Tennessee (0.4%), and North Carolina (0.3%). For most of these states, migration accelerated relative to 2024, though Delaware's inflow rate moderated slightly and North Carolina held steady.
Despite their differences, these states tend to offer a similar mix of lifestyle amenities, relatively low congestion, and opportunities for growth. Many also benefit from business-friendly climates, favorable taxpolicies, or housing costs that remain attractive relative to the higher-cost markets from which they draw new residents.
Vermont Trails Behind
At the other end of the spectrum was Vermont, which saw the nation’s largest net outflow as share of population in 2025, losing 0.4% of its population to domestic relocation. The decline deepens a reversal that first emerged in 2024, when the state swung to a net loss of 0.2%, after attracting inflows of 0.8% and 0.5% in 2022 and 2023, respectively.
Vermont's reversal likely reflects a combination of factors, including return-to-office mandates and the waning appeal of remote work. Housing undersupply in the state may have alsocontributed, illustrating how important infrastructure investments are to sustaining migration gains over time.
South Carolina, Delaware, and Idaho Lead the Nation in Domestic Migration Growth in 2025
Net Domestic Migration as a Share of Each State's Starting Population, 2025
Net Migration by State
−0.4%0.0%0.7%
Top Migration Magnets
2024
2025
*Analysis for each year is from Jan. – Dec.
Share
Embed:
Florida Sees Accelerated Inflow as Legacy Exodus States Slow Losses
Among the nation's six most populous states, Florida was the only one to see accelerating net in-migration in 2025, attracting new residents equal to 0.2% of its starting population, up from 0.1% the year before. Texas, by contrast, slowed from 0.1% net in-migration in 2024 to essentially flat in 2025, highlighting the cooling of what was once one of the country's strongest pandemic-era migration magnets.
Meanwhile, the legacy "exodus" states continue to lose residents, but at a slower pace than in previous years. Illinois and California have seen their migration deficits steadily narrow, with further improvement in 2025. Between 2022 and 2025, Illinois moved from -0.8% → -0.2% → -0.2% → -0.1%, while California moved from -0.9% → -0.4% → -0.3% → -0.2%. And though New York has held steady at -0.2% over the past two years, this marks a significant moderation from 2022, when the state experienced net outmigration equal to 1.1% of its population.
Major Insights:
Smaller states dominated migration gains in 2025, led by South Carolina, Delaware, Idaho, Maine, Tennessee, and North Carolina.
Vermont posted the nation's largest outflow after attracting strong inflows just a few years earlier.
Florida was the only top-population state to see meaningful net in-migration in 2025.
Texas' migration boom continued to cool, with net in-migration falling to flat in 2025.
Outmigration from New York, Illinois, and California is slowing, but these states are still losing residents overall.
Zooming In: Net Migration Across Metro Boundaries
Statewide trends reveal important shifts, but a closer look at the nation's ten largest metropolitan areas suggests that broader interstate averages increasingly mask diverging local realities. Several metros are attracting residents through interstate domestic migration even when their states as a whole are experiencing little or no net migration growth.
Phoenix (+0.3%), for example, stood out as the nation's top-performing large metro in 2025, despite Arizona's absence from the list of leading migration destinations – with the majority of its inflow coming from out of state.
Dallas (+0.2%) ranked second, continuing its rebound from -0.1% in 2023 even as Texas' statewide migration gains cooled. Like Phoenix, Dallas drew a majority of its new residents from outside the state, underscoring its growing appeal as a national migration destination. Houston, meanwhile, moved in the opposite direction, falling from 0.1% net in-migration in 2023 to -0.1% in 2025. While it is too early to call this a sustained reversal, the divergence between the two metros may reflect Dallas's growing pull as a corporate magnet alongside rising housing costs and weather-related challenges in Houston.
Metro-level data also suggests that the pandemic-era "big-city exodus" narrative is continuing to fade. Los Angeles improved from -0.8% in 2023 to -0.3% in 2025, while New York held steady at -0.3% after improving in 2024. Even Miami (-0.6%), which ranked last among major metros despite Florida's continued statewide gains, saw its outflows moderate from 2023 levels. And while Illinois continued to post net outmigration, Chicago (0.0%) reached migration neutrality in 2025 after recording losses in both 2023 and 2024.
Major Insights:
Phoenix was the nation's top large-metro migration destination in 2025.
Dallas gained momentum while Houston lost ground, highlighting growing divergence within Texas.
Miami continued to post the largest outflows among major metros despite Florida's broader migration success.
The LosAngeles, Chicago, and the New York metro areas all saw migration losses ease.
Florida Dominates Large Metros
Despite Miami's struggles – and Florida’s relatively modest 0.2% inflow – a look beyond the top 10 large metros reveals that the Sunshine State is home to six of the nation's eight fastest-growing large metros nationwide.
Those top-performing metros, defined as CBSAs with 500K+ residents that added at least 0.8% of their population through net domestic migration over the past year, share a similar profile: lower housing costs, retiree appeal, suburban density, and an easy drive to a larger economic hub.
Much of the growth of these Florida metro areas, however, is being fueled from within Florida itself. While major out-of-state metros such as New York (6.1%) and Chicago (2.0%) remained important sources of new residents, nearly half of the net migration into Florida's top destination metros came from elsewhere in the state. In 2025, Miami (22.5%), Orlando (13.0%), Tampa (5.8%), and Naples (4.2%) together accounted for 45.5% of the net positive migration feeding these fast-growing markets.
Major Insights:
Mid-sized Florida metros dominate the national migration leaderboard.
Florida's migration pipeline is overwhelmingly driven by in-state movement.
The Affordability Factor
The migration flows feeding the nation’s fastest-growing large metros suggest that affordability remains a powerful driver of domestic relocation.
In 2025, seven of the eight top destination metros analyzed above had lower typical home values than their largest feeder markets. Lakeland–Winter Haven, FL, for example, had a typical home value of $313.4K in December 2024, compared with $404.9K in Orlando and $380.2K in Tampa – its two largest sources of net migration. Even North Port–Bradenton–Sarasota, FL – the most expensive Florida metro in this group – drew its largest share of net migration from the New York metro area, where home values are substantially higher.
The lone exception was Charleston–North Charleston, SC, whose largest source of net migration was Baltimore – a market with lower typical home values than the destination. Even in Charleston, however, affordability appears to have played a role. New York, a significantly more expensive market, ranked a close second in 2025, accounting for 6.5% of net positive migration into Charleston, just behind Baltimore’s 6.8%.
While housing costs are only one factor influencing migration decisions, the data suggests that households continue to gravitate toward markets where homeownership is comparatively more attainable than in the places they leave behind.
Most Top Migration Destinations Pull Residents From More Expensive Housing Markets
Typical Home Values* in Top Feeder Markets to Destination Hubs, 2025
Destination HubTop Feeder Market
*Typical home value based on Zillow Research’s Zillow Home Value Index (ZHVI) for Dec. 2024, immediately preceding the analyzed migration period (Jan.–Dec. 2025).
Share
Embed:
Major Insights:
Most high-growth metros attract residents from more expensive housing markets.
Relative affordability continues to be a primary driver of domestic migration.
Demographics Over Dollars
But as important as affordability is in explaining today’s domestic migration patterns, age appears to be an even stronger determinant of where people choose to relocate.
Among mid-sized and large metros (250K+ residents) experiencing significant population shifts – defined as gaining or losing at least 1.0% of their starting population through domestic migration over the past two years – households are increasingly moving toward older, more established communities.
The data reveals a clear negative relationship between migration performance and age differential – a metric calculated by subtracting the median age of the destination market from the weighted median age of its feeder markets. Negative values indicate movement toward older communities, while positive values indicate movement toward younger ones. In other words, the metros attracting the strongest migration inflows tend to be older than the markets sending them residents.
The data also shows a clear positive relationship between migration performance and retiree concentration. Metros with larger shares of residents aged 65 and older generally saw stronger migration gains over the past two years, while younger metros tended to attract fewer newcomers. This suggests that retiree-driven relocation has become an increasingly important driver of migration. At the same time, the influx of younger residents points to the broader appeal of these communities, which offer a mix of affordability, amenities, and lifestyle advantages.
Relocators are Gravitating Towards Older, More Established Communities – With Retirees Helping Fuel the Trend
Net Migration as Share of Starting Population, 2024–2025*
Net Migration vs. Weighted Age Differential
Net Migration vs. Share of Residents 65+
*Analysis includes metro areas with 250K+ residents and domestic migration gains or losses of at least 1.0% during the study period. Weighted Age Differential compares the destination market’s median age with the weighted median age of origin markets, with positive values indicating migration toward younger markets and negative values indicating migration toward older markets. Age data: Census ACS 2020–2024.
Share
Embed:
Major Insights:
People are moving to older, more established communities.
Markets with larger 65+ populations are attracting more domestic relocators.
The New Migration Map: Strategic Implications
The pandemic-era urban exodus is giving way to a more nuanced migration landscape. Large urban markets are stabilizing, while growth is increasingly concentrated in smaller states, secondary metros, and intra-state corridors. Affordability remains a powerful pull, but retirees, lifestyle considerations, and local market dynamics are also playing an increasingly important role in where Americans choose to live.
To capitalize on these shifts in 2026, civic leaders, commercial real estate (CRE) investors, retailers, and developers should:
Monitor smaller states gaining migration momentum. Among the nation's most populous states, only Florida saw (modest) net in-migration in 2025. By contrast, smaller states like South Carolina, Delaware, Idaho, Maine, Tennessee, and North Carolina continued to attract substantial inflow. Investors, retailers, and developers that monitor these patterns may be better positioned to identify emerging growth opportunities.
Invest ahead of growth. Vermont's reversal shows how important it is for housing supply and infrastructure to keep pace with demand. High-growth communities will also need the retail, healthcare, transportation, and service capacity required to support expanding populations.
Look beyond state-level narratives that can obscure local opportunities. Florida led the nation in fast-growing large metros even as Miami lost residents, while Texas saw Dallas gain momentum as Houston fell behind. Likewise, although Arizona was not a top destination state, Phoenix remained the nation's leading major metro for migration gains.
Treat states as migration ecosystems. In Florida, for example, domestic migration is increasingly redistributed across a network of interconnected metros – as costs rise in one market, residents shift to nearby alternatives. Tracking these spillover effects can help identify tomorrow's growth markets before they show up in the rankings.
Don't write off major urban markets. While New York, Los Angeles, and Miami continue to experience net outflows – and Chicago has yet to return to positive territory – migration losses have moderated substantially from their pandemic-era peaks. As these markets stabilize, investments in livability, affordability, and quality of life could help strengthen their long-term competitiveness and economic vitality.
Protect affordability as a competitive advantage. Across the nation's fastest-growing metros, migration flows continue to move from more expensive housing markets to less expensive ones. As demand rises, preserving attainable housing will be critical to maintaining the cost advantages that attract new residents and businesses.
Prepare for a retiree-driven demographic realignment. Older Americans are playing an outsized role in shaping domestic migration patterns, but the communities attracting them are increasingly appealing to a broader range of households as well. As these markets grow, demand is likely to increase for healthcare, recreation, hospitality, and housing, creating opportunities across a wide range of sectors.
Explore key signals guiding data-driven site selection from brands actively expanding their brick-and-mortar footprints.
May 21, 2026
Predicting The Next Best Location
Across segments, retail and dining expansions converge on a common set of priorities, including identifying markets with strong demand, ensuring alignment with target audiences, and leveraging local consumer behavior to drive synergy. Using AI-powered location intelligence, we analyzed five expanding brands and segments to uncover the core principles driving successful site selection.
1. Identifying Sustainable Growth in an Increasingly Saturated Market
Nationwide visits to coffee chains are up in 2026, with established brands and newcomers alike seeing their traffic increase as consumer headwinds lead some to shift their discretionary spend towards more affordable indulgences. But past visit growth does not necessarily indicate future opportunity – it may instead signal market saturation. Relying solely on overall visit trends to guide expansion could lead chains into highly competitive markets where existing supply already meets demand.
For example, analyzing traffic trends in 10 major metro areas where coffee visits increased year-over-year (YoY) in Q1 2026 reveals significant gaps between overall traffic trends and per-location demand. In some CBSAs, overall traffic growth significantly outpaced per-location traffic trends – suggesting that supply is already meeting (or exceeding) demand and limiting room for new coffee locations despite overall category growth. But in other metro areas, where overall visit growth appears smaller, per-location traffic is actually booming – indicating that the underlying demand is resilient enough to support additional coffee concepts.
These patterns highlight the importance of looking beyond topline growth to identify where true whitespace still exists.
Strategic Takeaways:
Relying solely on aggregate category performance can obscure regional white space. A market-level view may reveal opportunities for stronger returns in areas where consumer demand is gaining momentum.
Combining overall visit and visits per location data offers a more complete view of where demand is both strong and sustainable.
2. Ensuring Demographic Alignment on the Hyperlocal Level
Effective site selection matches both regional and local demographics to a brand’s target customer, supporting performance and reinforcing positioning. But even in well-aligned metros, results depend on site-level precision – locations where the trade area visitor profile most closely reflects the brand’s core audience are best positioned to drive incremental upside.
An analysis of Alo locations in the DC area suggests that the company is adopting this strategy. Within the already high-income metro area of Washington-Arlington-Alexandria, individual Alo Yoga stores are placed in centers that draw even more affluent visitors – maximizing the revenue potential of each location.
In fact, Alo's newest stores in the metro area – One Loudoun and Bethesda Row – drive traffic from households with higher median incomes than even the established area locations. This signals a clear focus on premium retail corridors and affluent consumer segments, which reinforces the brand’s positioning while capturing higher-spending customers at the site level.
Strategic Takeaways:
Beyond traffic potential, effective site selection requires a clear understanding of both regional and hyperlocal demographics, as well as the brand’s target audience.
As brands expand, aligning locations with core customer bases can drive success while reinforcing brand positioning.
3. Finding Retail Nodes With Complementary Visitation Patterns
Beyond driving traffic potential and demographic alignment, site selection should also ensure that a brand’s identity and operating model are well matched to the visitation patterns of prospective locations. Barnes & Noble offers a clear example. The company’s ongoing resurgence has relied in part on repositioning itself as a local cultural and social hub, with a stronger emphasis on local curation and community-driven events.
And analyzing Barnes & Noble’s 2026 openings shows a clear tilt toward centers with a higher share of local traffic than the chain average – supporting its shift away from a purely transactional retail model toward a more community-centric experience built around local curation, events, and repeat visitation. By prioritizing locally driven centers, the company’s site selection strategy not only captures relevant traffic but also reinforces its broader repositioning as a neighborhood-oriented brand.
Strategic Takeaways:
Site selection strategy should look to align a brand’s identity and operating model with real-world visitation patterns at prospective locations.
For brands leaning into local curation, choosing centers with predominantly nearby visitors may be the key to performance and preserving brand identity.
4. Understanding the Benefits of Competitor Proximity
Effective site selection recognizes that proximity to competitors can function as a demand driver, amplifying traffic rather than diluting it.
In practice, this often takes the form of clustering – deliberately locating near similar or complementary concepts to capture shared demand. Shake Shack provides a clear example. Analyzing the chain's store fleet shows that many locations sit near other QSR and fast-casual concepts, creating opportunities to capture dining-based traffic. At the same time, strong cross-visitation patterns indicate that these co-located brands share a common customer base, positioning the brand closer to consumers who are already likely to visit. And, at least for Shake Shack, this strategy appears to be working – traffic to the chain increased 19.9% YoY in Q1 2026.
Strategic Takeaways:
As in retail, co-tenancy in the restaurant space can be mutually beneficial – establishing a center as a dining destination, driving incremental traffic, and increasing a brand’s opportunities to win share-of-stomach.
Incorporating cross-visitation analysis into site selection helps pinpoint locations where target customers are already visiting nearby brands. Centers that already attract a brand’s overlapping customer base provide a stronger foundation for incremental growth.
5. Balancing Growth and Cannibalization Risk
Incorporating trade area analysis into site selection can also help determine whether a new location will generate new traffic or risk cannibalizing existing demand. Aldi, a rapidly expanding grocery chain, offers a relevant example.
The company opened a fourth Las Vegas store on S Decatur Blvd in October 2025, positioned between existing locations on W Craig Rd and S Rainbow Blvd, approximately eight miles from each. And analyzing the core trade area of each of the four Las Vegas locations indicated limited visitor cannibalization over the last six months, despite the stores’ close proximity. Only 6.2% and 7.6% of the S Decatur Blvd store’s trade area overlapped with the W Craig Rd and S Rainbow Blvd stores’ trade areas, respectively.
These findings show that there is no one-size-fits-all approach to store spacing – it varies by brand, category, and market. Analyzing a company’s existing store network alongside competitor density and overall demand can help determine how closely locations can be placed without hurting performance. In many cases – especially in high-frequency categories like grocery – markets can support stores that are closer together than expected.
Strategic Takeaways:
Site selection strategy needs to take into account local demand and visitation behavior typical of the category as a whole and of existing locations in particular.
Trade area analysis can reveal where a market allows for network densification without significant risk of visit cannibalization.


.svg)


.avif)


