

.svg)


Thank you! Your submission has been received!
Oops! Something went wrong while submitting the form.
0
0
0
0
----------
0
0
Articles
Article
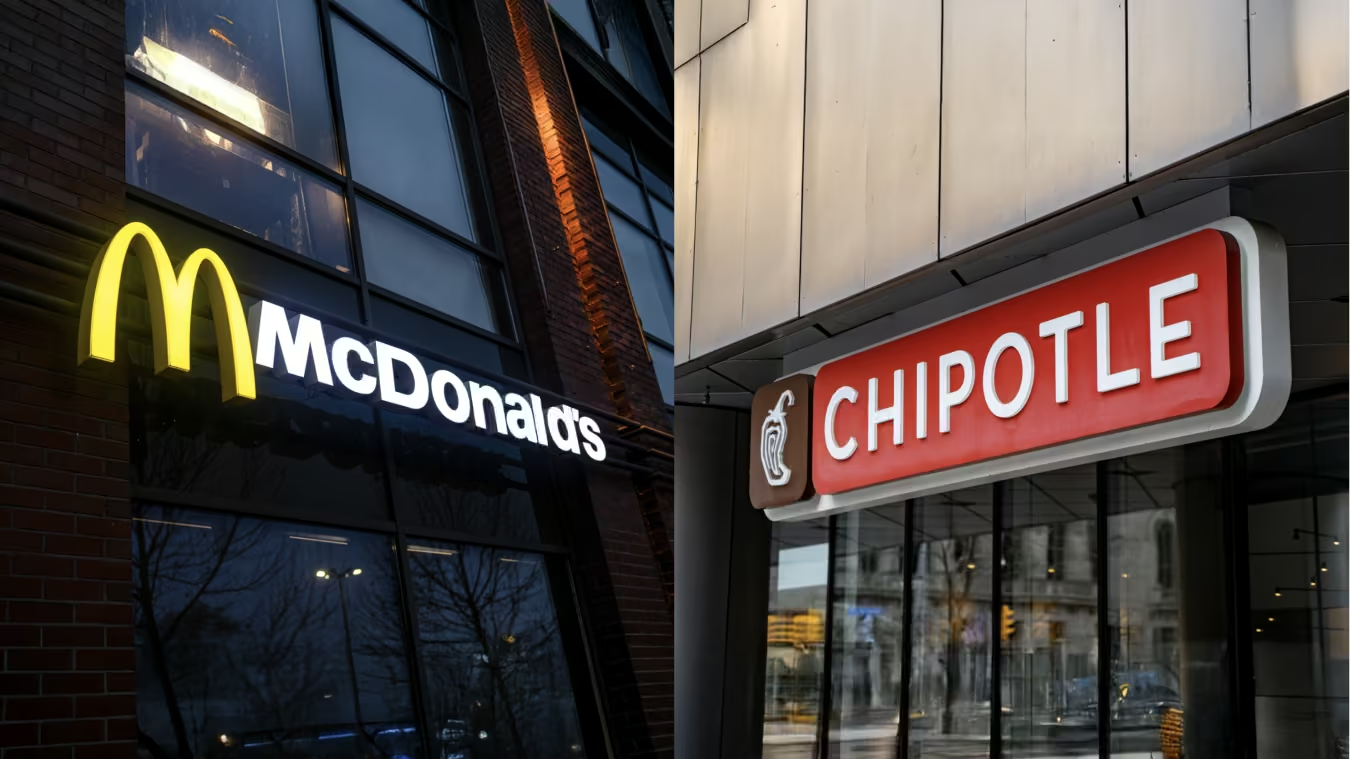
Why Chipotle and McDonald's Took Different Paths in Q2 2026Visitation data suggests customer demographics helped Chipotle outperform McDonald's in Q2 2026.
Shira Petrack
Jul 24, 2026
2 minutes
Article
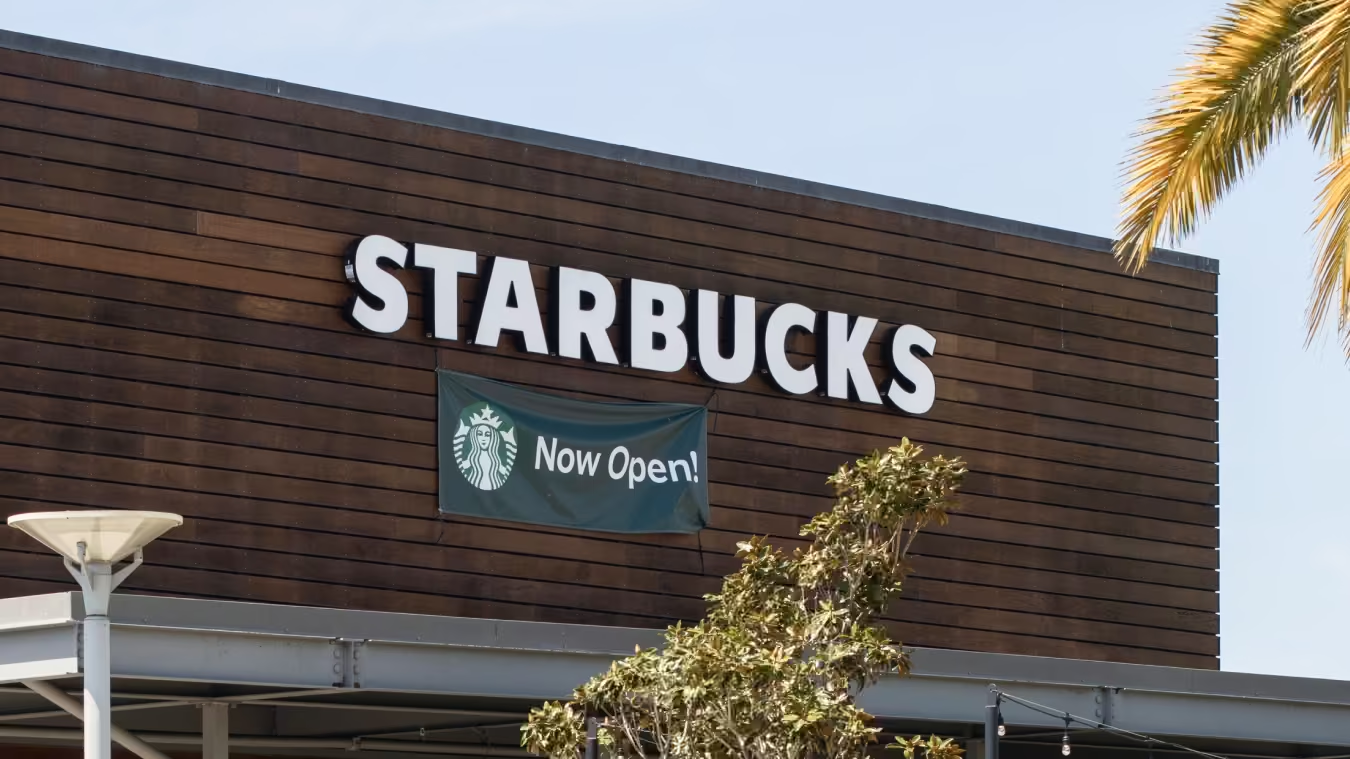
Traffic Data Suggests Starbucks' Turnaround Is Gaining Traction Traffic data suggests Starbucks' turnaround is gaining traction as visits and repeat customer frequency improve under the Back to Starbucks strategy.
Shira Petrack
Jul 23, 2026
Article
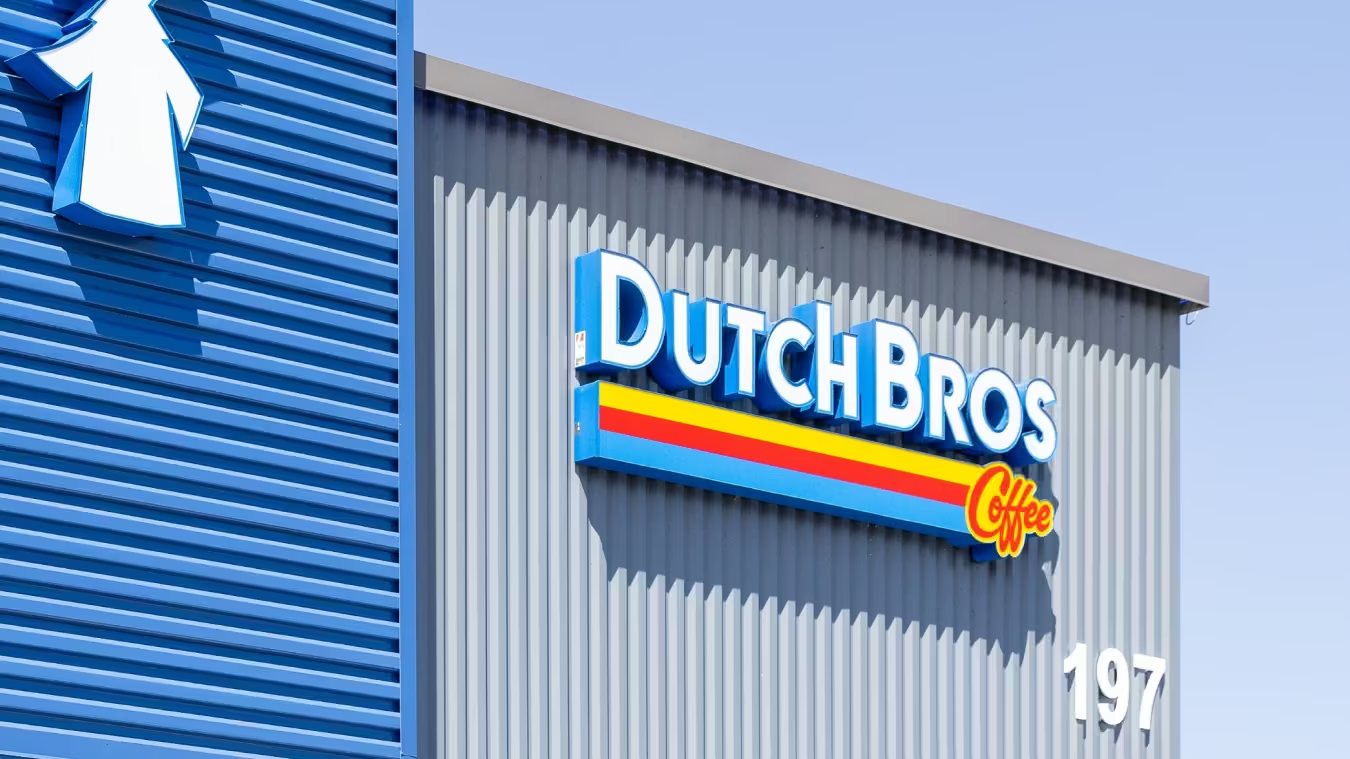
Dutch Bros' Traffic Trends Suggest the Growth Story Remains IntactDutch Bros' latest visitation data suggests that growing morning traffic and continued expansion helping offset softer same-store trends.
Shira Petrack
Jul 22, 2026
2 minutes
%20IPO.avif)
Article
How Tailored Brands Went From Bankruptcy to IPOExplore how Tailored Brands rebounded from bankruptcy to IPO, with Men's Wearhouse and Jos. A. Bank outperforming the apparel category ahead of its public debut.
Shira Petrack
Jul 21, 2026
2 minutes

Article
The World Cup Drove Bar Traffic Across Host CitiesWorld Cup host cities saw bar and pub traffic rise above the national average, with Los Angeles, the Bay Area, and Houston leading the gains.
R.J. Hottovy
Jul 20, 2026
1 minute

Article
adidas’ World Cup Win: Three Stripes, One Very Good JuneThe 2026 World Cup is being felt well beyond the stadium – in retail and dining. For adidas, sponsorship translated into a major YoY visit surge.
Maytal Cohen
Jul 17, 2026
2 minutes
Reports
.avif)
INSIDER
Report
The Forces Shaping Consumer Traffic in 2026Explore how higher gas prices, the search for value, and nostalgia-driven demand shaped consumer traffic and behavior in H1 2026.
July 27, 2026
.avif)
INSIDER
Report
Dining In 2026: All Roads Lead To ValueHow shifting consumer priorities are reshaping value perceptions across QSR, fast casual, and casual chains.
July 9, 2026

INSIDER
Report
Migration After the Boom: Where Americans Are Moving in 2026Find out where Americans are moving in 2026, why they're relocating, and how developers, investors, and retailers can stay ahead of the trends.
June 18, 2026
Show More
1 / 24
Loading results...
We couldn't find anything matching your search.
Browse one of our topic pages to help find what you're looking for.
For more in-depth analyses on a variety of subjects, explore Reports.
For more in-depth analyses on a variety of subjects, explore Reports.

INSIDER
Stay Anchored: Subscribe to Insider & Unlock more Foot Traffic Insights
Gain insider insights with our in-depth analytics crafted by industry experts
— giving you the knowledge and edge to stay ahead.

