It’s no secret that the restaurant category is starting to get more promotional. As consumers–especially lower income consumers–have shifted toward substitute food retail channels like value grocers, warehouse clubs, and convenience stores due to the compounded effect of food-away-from home inflation, restaurant chains across all tiers are resorting to increased promotional activity to drive visit trends.
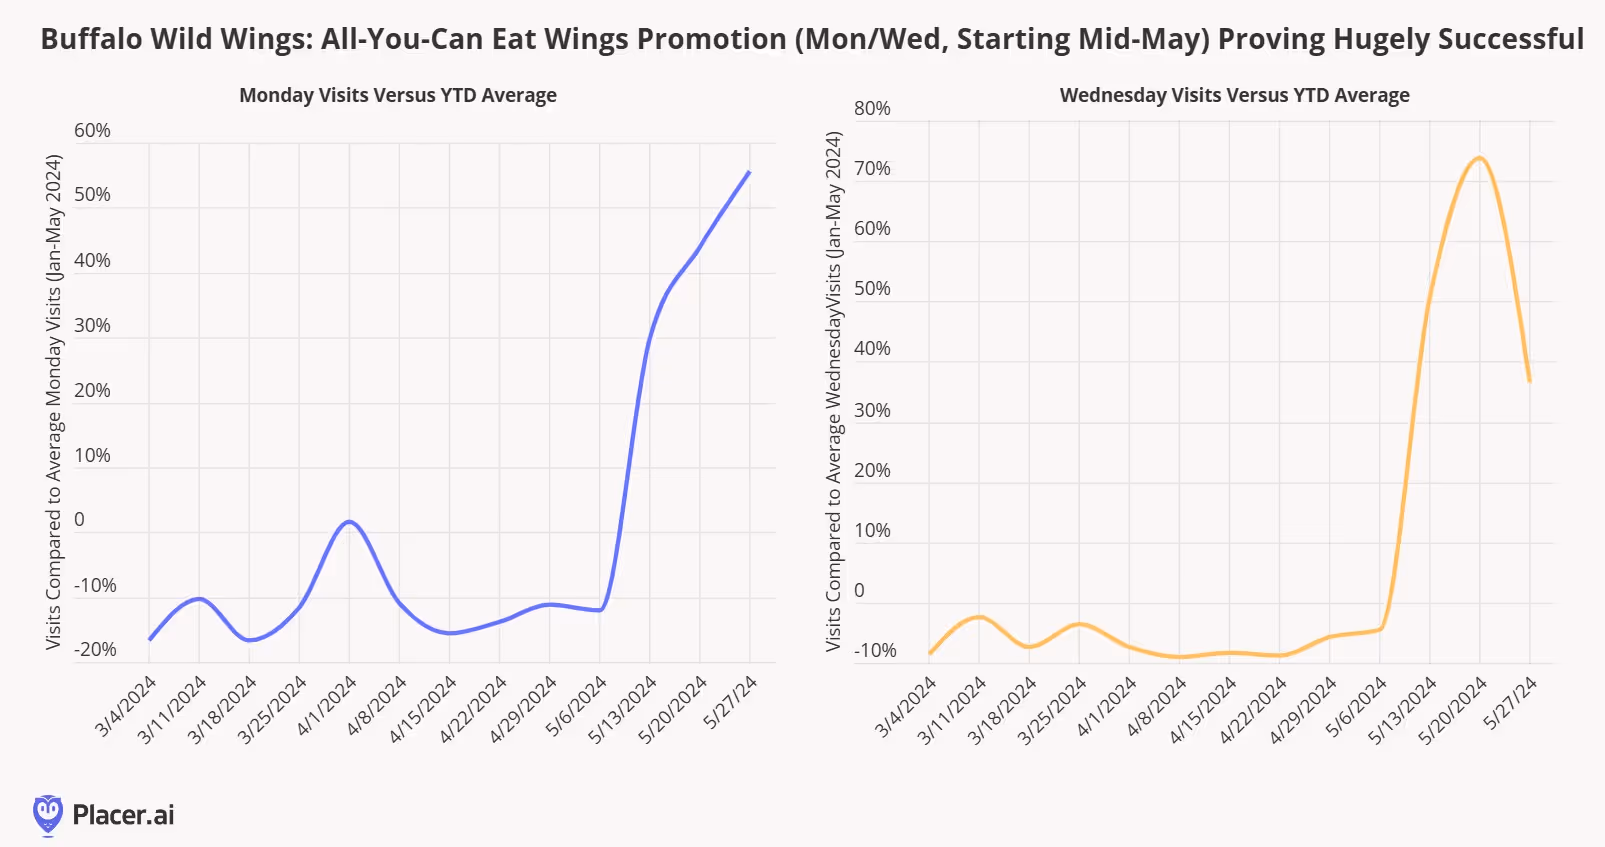
Over the past few weeks, we’ve discussed that several casual dining chains had seen success through all-you-can eat and other deep discount promotions. Last week, we noted that Chili’s had been outperforming broader casual-dining category averages through its value messaging. We also noted the success of Buffalo Wild Wings All-You-Can Eat wings promotions on Monday and Wednesdays starting in mid-May. Below, we show visit trends to Buffalo Wild Wings on Mondays and Wednesdays compared to their year-to-date averages since the beginning of March. The promotion has helped to drive incremental visits on two traditionally slower days. During May, the chain was seeing visits greater than 30% its normal daily visit count for Mondays and Wednesdays during the earlier part of the promotion and exceeding 50% during the latter part of the month. While it's unlikely that this promotion will be permanent–restaurants have to work with their suppliers ahead of time to make sure they have sufficient food for promotions like this–but given the success, the chain may consider running during other months (and potentially other days of the week) later this year.
However, as we noted in our recap of this year’s National Restaurant Association show, QSR chains have started to get more promotional ahead as they look to recapture visit share lost to value grocers, dollar stores, and c-stores (especially within lower-income trade areas). McDonald’s will launch a national $5 value menu promotion on June 25, but it’s clear that other QSR chains are already seeing success with their competing $5 promotions. Below, we show year-over-year weekly visit trends from March through early June for the major QSR burger chains. Burger King launched its own $5 Your Way Meal value menu this past week, and has seen visit trends accelerate since then. Starbucks–which has historically stayed away from discounts as a way to protect its premium brand position–also surprised the industry by announcing a $5-$7 “pairings menu” this week.
Easing commodity costs have allowed restaurants to get more promotional, although when paired with rising labor costs (especially in California, which we covered last week), it does set up an environment where restaurant profits will likely be squeezed over the next several months. Also, substitute food retail channels are likely to introduce their own price reductions in the months to come (as we’ve already seen from Walmart).
Summer has unofficially arrived, and with that comes the desire to relax, unwind and travel. And despite some of the economic uncertainty still facing consumers, 2024 is off to a surprising start for traffic in certain parts of retail. According to AAA, auto traffic growth for Memorial Day weekend was projected to grow by 4% compared to last year and by almost 2% versus 2019. Car travel has long been seen as the value-based travel method across the U.S., and who can forget the allure of the “summer road trip”. But inflationary pressures may have made it less appealing over the past few years. In the most recent consumer price index for May 2024, a drop in gasoline prices was a large positive contributor to the overall rate of 3.3%, which could provide a stronger consumer push for summer car travel.
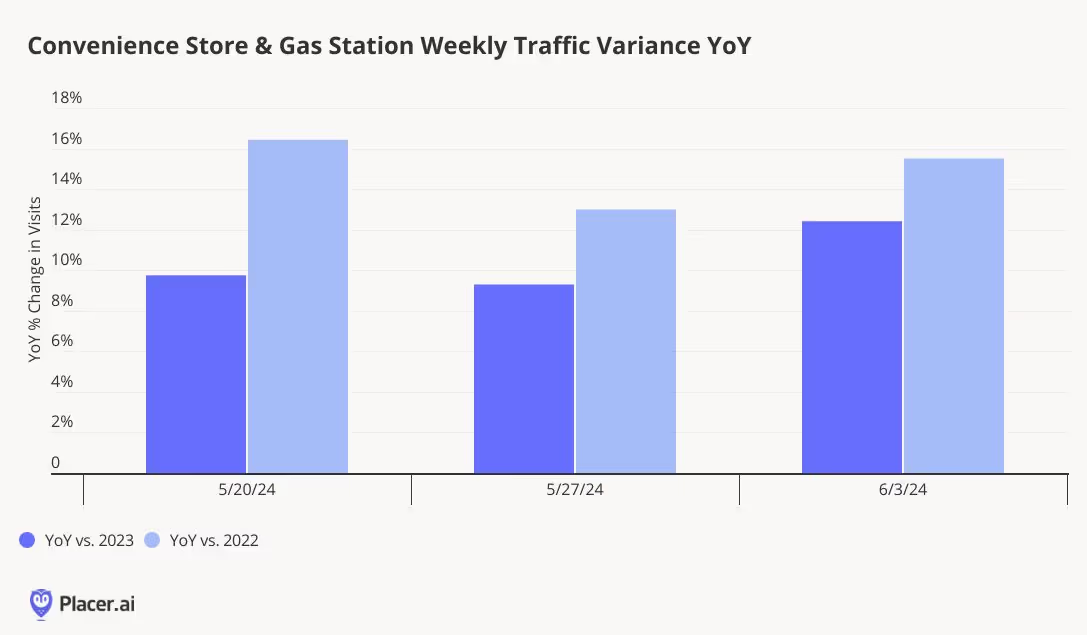
With the positive momentum in auto traffic and gas prices, gas station and convenience store traffic has greatly benefited since Memorial Day weekend. In fact, visits to chains from May 20 to June 10 this year increased by 11% compared to the same weeks in 2023 and 15% versus 2022. Traffic to convenience stores and gas chains is up almost 30% compared to the same weeks in 2019. Traffic growth steadily climbed over the course of the three weekends measured, and the weeks had some of the highest growth rates so far in 2024 with the exception of a week in March. Even with the projected increase in auto traffic across the country, convenience and gas is the summer blockbuster, building on the consumer trends of the past year and the successful strategies of various retailers.
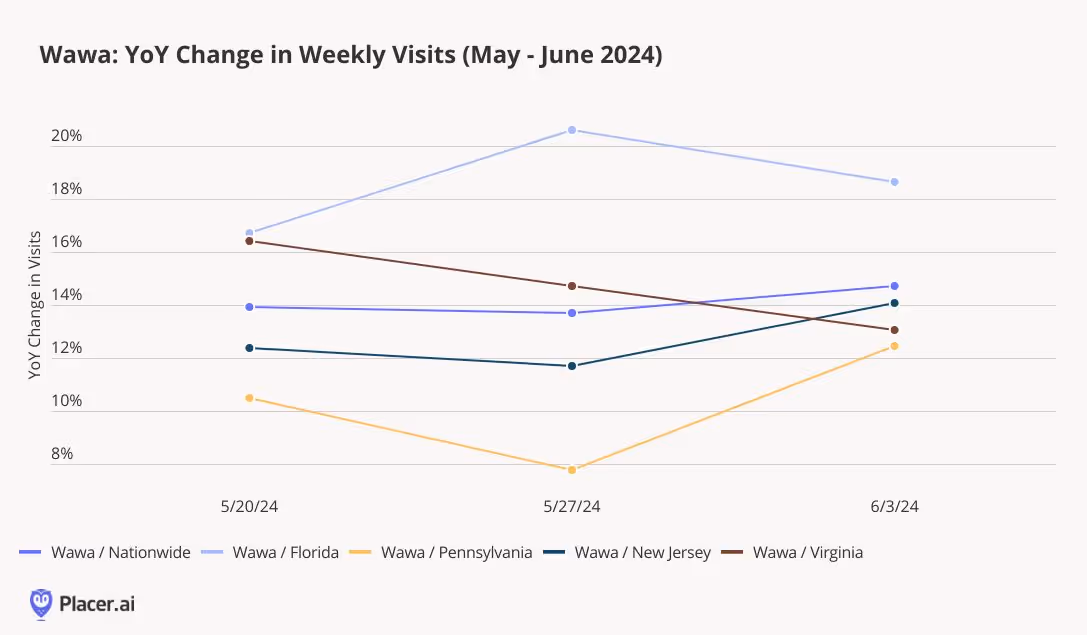
Wawa, in particular, saw strong visit patterns in the first unofficial few weeks of summer travel. The chain at a total level is up an impressive 14% year-over-year for the measured weeks. Looking at Wawa’s performance across various states, Florida drove much of the growth in traffic as the weather heats up, and outperformed some of the brand’s stronghold states like Pennsylvania & New Jersey. Average dwell times at Wawa locations in Florida are almost a minute higher than the chain average, highlighting that stores are not only pulling in more visits, but keeping visitors in-store for longer. The strong performance of the Florida locations, even during the off season, corroborates the brand’s investment in expansion across the state. One might suspect that Wawa is well positioned heading into the remainder of the summer with its coastal strategy.
Will C-stores continue to grow traffic as we officially enter the summer season? All signs point to yes, even if gas prices rise due to increased demand. Chains have done a fantastic job of enticing consumers with unique food offerings and might become the must-visit destination before heading to the beach this summer.
Darden Restaurants, Inc. operates a portfolio that includes some of the biggest names in full-service dining, including Olive Garden and LongHorn Steakhouse. How are these restaurants performing as Q3 2024 approaches? We take a closer look.
Bracha Arnold
Jun 13, 2024
3 minutes
Darden Restaurants, Inc. operates a portfolio that includes some of the biggest names in full-service dining, including Olive Garden, LongHorn Steakhouse, Cheddar’s Scratch Kitchen, Yard House, Ruth’s Chris Steak House, Bahama Breeze, and Eddie V’s Prime Seafood.
How are these restaurants performing as Q3 2024 approaches? We took a closer look at the location analytics to find out which restaurant chains are thriving in today’s challenging economic climate.
Getting Back to the Garden
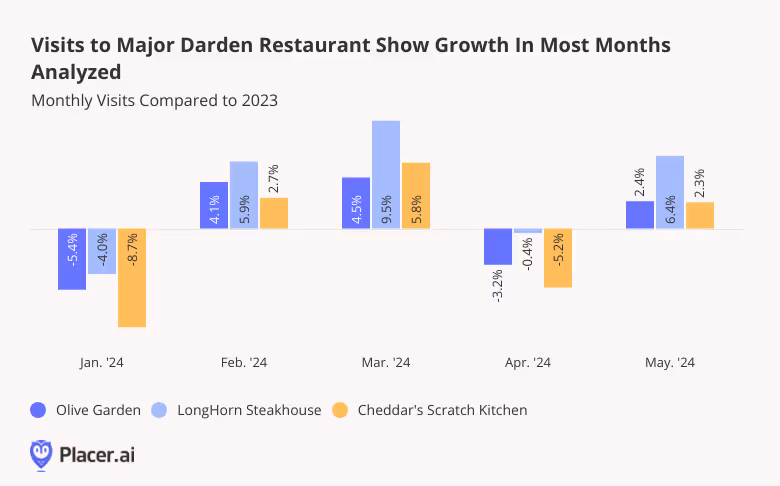
Darden’s three largest restaurant chains – Olive Garden, LongHorn Steakhouse, and Cheddar’s Scratch Kitchen – are some of the best-known names in casual, full-service dining. These chains have a strong presence across the country and have experienced mainly positive YoY foot traffic this year so far.
Although foot traffic was lower YoY in January and April 2024, these dips can be attributed to external factors, such as January’s inclement weather and an April calendar shift (i.e. the timing of Easter, as well as the extra Saturday in April 2023). And in May the three chains quickly rebounded, ending the month with respective YoY visit increases of 2.4%, 6.4%, and 2.3%.
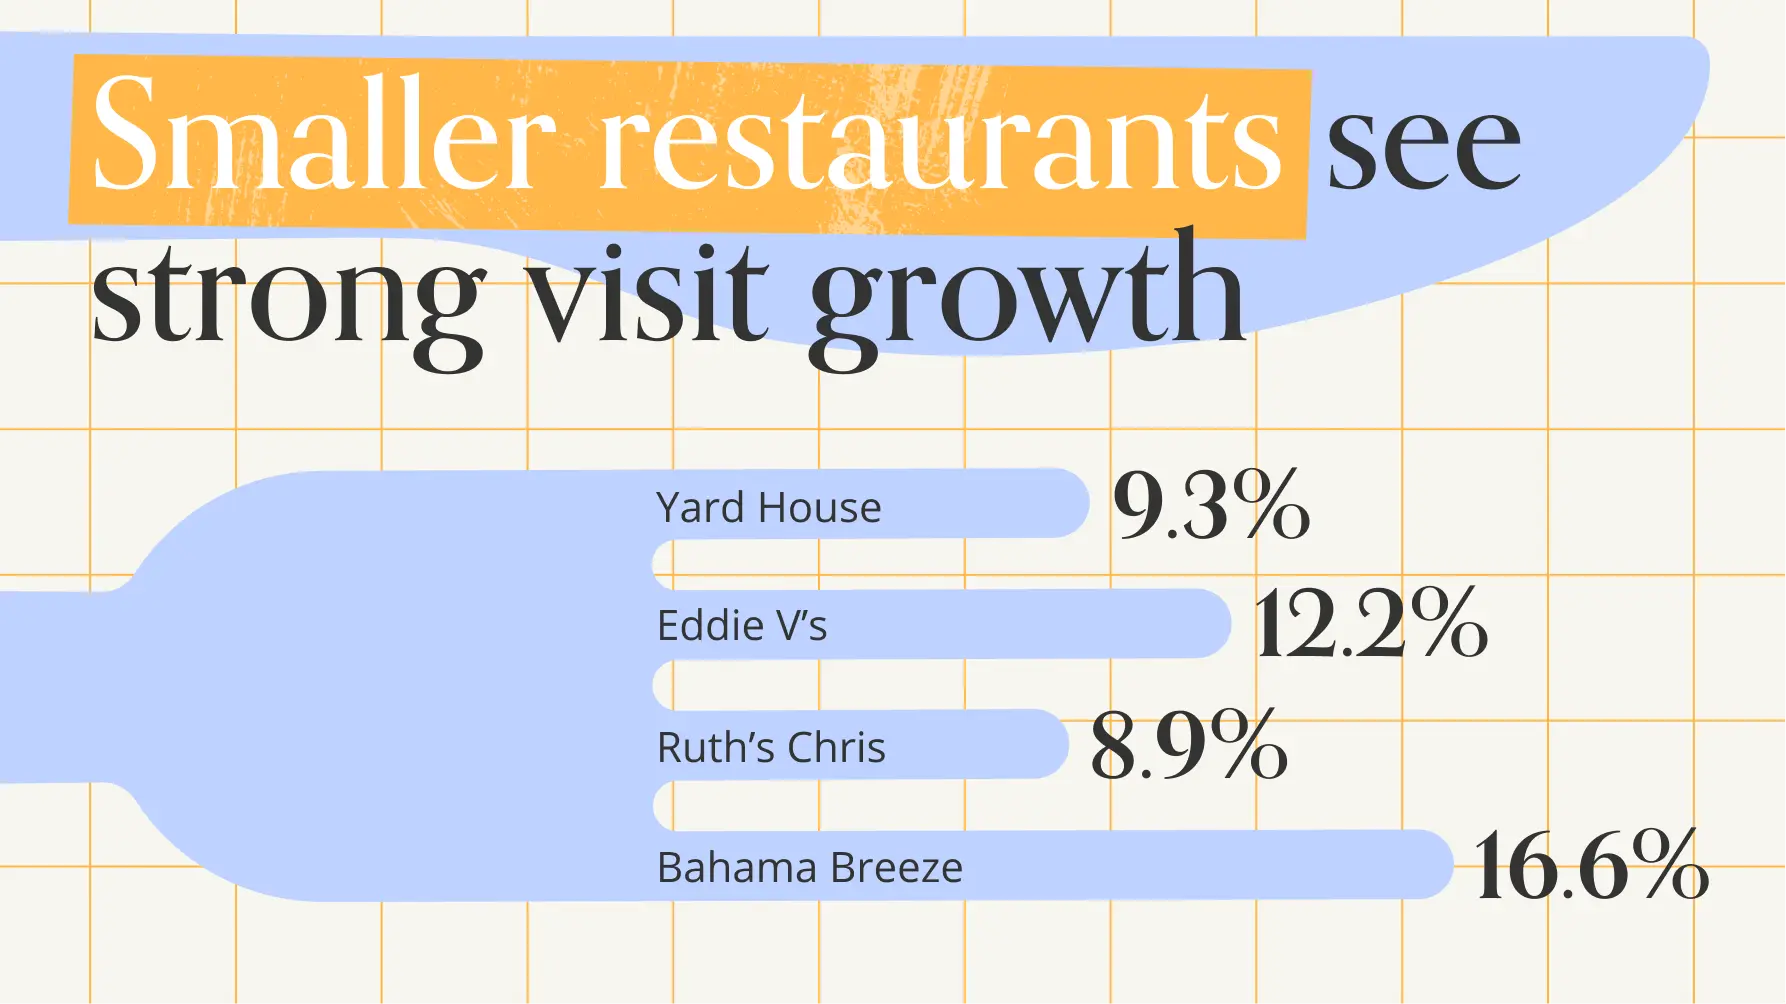
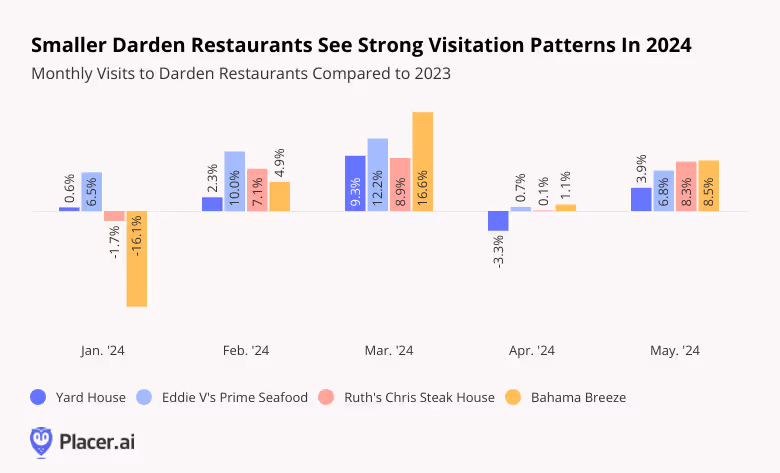
Smaller Brands Showing Visit Strength
Darden operates various smaller brands offering different dining styles and price points, ranging from upscale options like Eddie V’s and Ruth’s Chris Steakhouse to more casual spots like Bahama Breeze and Yard House. These smaller chains also experienced strong visitation patterns in early 2024 – with May YoY visits up between 3.9% and 8.5%.
Special Calendar Days Drive Visits
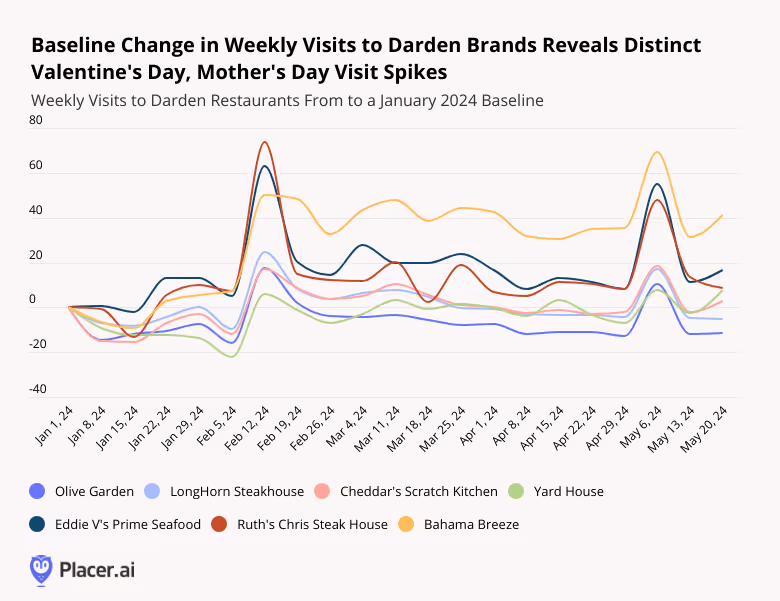
Darden’s strong February and May showings were likely fueled, in part, by two distinctly important days on the Darden restaurant calendar: Valentine’s Day and Mother’s Day.
In absolute terms, Olive Garden – Darden’s largest chain by far – drew the most visits on both holidays as compared to a January 1, 2024 baseline, claiming the top spot this year as America’s favorite Mother’s Day destination. But on a relative basis, Darden’s premium brands Eddie V’s and Ruth Chris experienced the biggest visit spikes, as people splurged on celebratory outings. And laid-back chain Bahama Breeze saw a sustained visit boost from Valentine’s Day through Mother’s Day, likely owing to its strong presence in Florida – making it an attractive destination for the snowbirds and vacationers who visit the state during the winter.
And surprisingly, even casual dining venue Yard House – known for its beer and sports atmosphere rather than romantic setting – experienced a Valentine’s Day visit boost. This suggests that there is a tangible benefit from these holidays across a wide range of dining styles – and restaurant operators can use these insights to encourage visits on such occasions.
No Missed-Steaks Here
Darden continues to attract customers to its restaurants in spite of a challenging economy by offering a variety of dining choices and capitalizing on popular dining-out occasions such as Mother’s Day and Valentine’s Day.
Will the company’s visit growth continue to trend upward as 2024 wears on?
Follow Placer.ai for the latest data-driven dining insights.
Are full-service restaurants making a comeback? And what is the state of retail in early 2024? We dove into the data to find out.
Ezra Carmel
Jun 12, 2024
3 minutes
After a frigid start to the year, how have retail and dining foot traffic fared in the subsequent months? We dove into the data to find out.
Overall Retail and Dining Traffic: YoY Increases
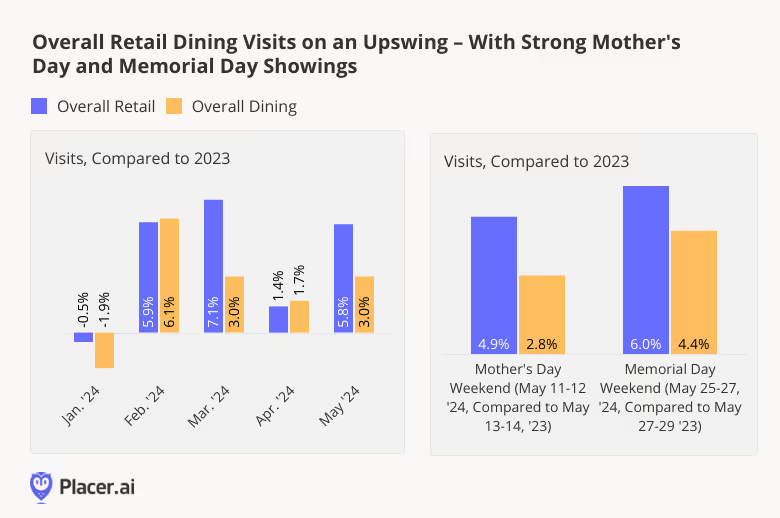
Last year was all about experiences. But in 2024, consumer demand is once again striking a balance between “fun and stuff.” Though both retail and dining foot traffic were weighed down by January 2024’s extreme temperatures, the two categories bounced back in February, going on to see consistently positive YoY foot traffic growth through May.
May 2024’s strong showing was likely driven in part by impressive visit boosts on two important calendar highlights: Mother’s Day weekend and Memorial Day weekend. On both of these occasions, retail and dining foot traffic outperformed 2023 levels, a further sign of consumer resilience this year.
Darlings of Dining: Fast Casual, QSR and Full Service Growth
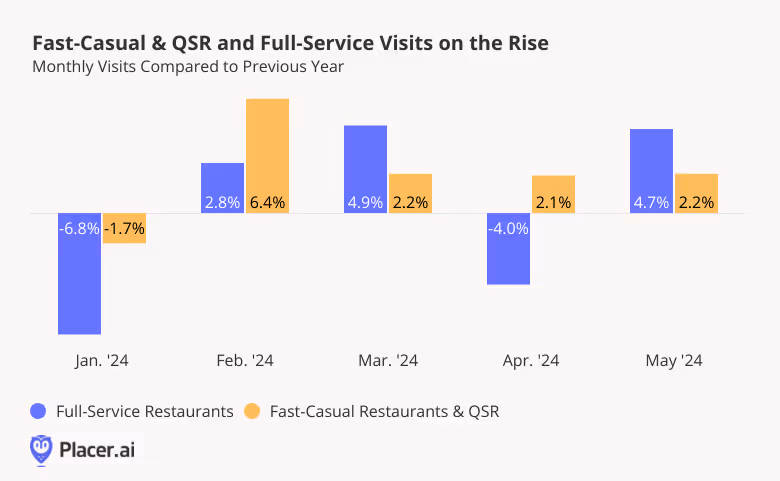
And drilling down deeper into data shows that some of this dining growth is being driven by full-service restaurants – another sign that the segment may be experiencing a comeback.
And location analytics points to a much more level playing field this year, with FSR YoY visit growth outperforming fast-casual & QSR in both March and in May. May’s visit boost in particular was likely aided by holiday visits – on both Mother’s Day and Memorial Day, full-service restaurants drew outsize crowds eager to enjoy nice meals out with friends and family.
Mapping Fast Casual & QSR and Full Service Trends
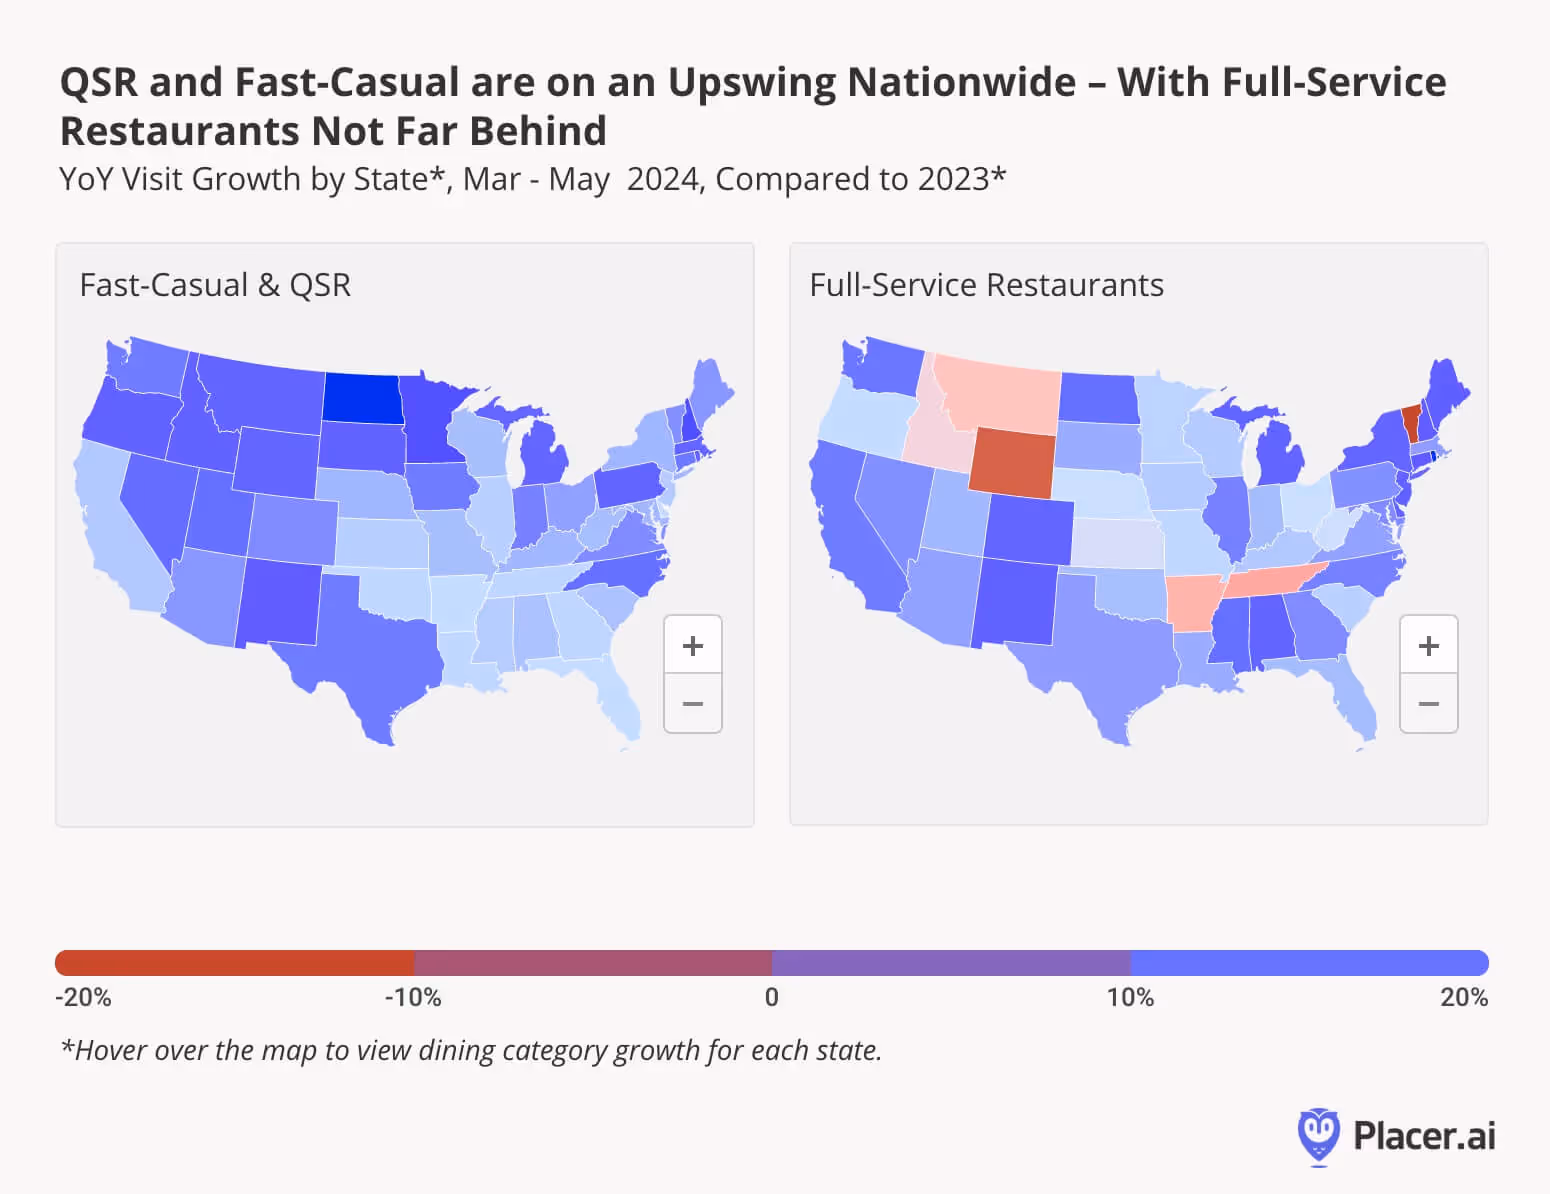
A look at statewide visit data for both fast-casual & QSR and for full-service chains during the past three months – comparing March to May 2024 to the equivalent period of last year – shows both segments doing remarkably well throughout most of the U.S.
In the fast-casual & QSR space, all 50 states enjoyed positive YoY visit growth over the past three months – led by North Dakota (6.8%), New Hampshire (5.3%), Minnesota (5.1%), New Mexico (4.3%), and Rhode Island (4.2%). And in FSR, 42 states enjoyed positive growth – with some of the same states, including Rhode Island, New Hampshire, and New Mexico, claiming top spots.
Looking Ahead
Will full service continue its turnaround in the second half of 2024 and can fast-casual & QSR maintain its strength? How will overall retail traffic fare during the summer months and critical back-to-school season?
Hilton Hotels & Resorts and InterContinental Hotels Group (IHG) introduced their midscale hotels - TRU and avid - several years ago. We take a closer look at the visitation trends to these affordable hotels and dive into the demographics to see who is staying at them.
Bracha Arnold
Jun 11, 2024
3 minutes
Hilton Hotels & Resorts and InterContinental Hotels Group (IHG) are two of the biggest names in lodging. The two companies operate a wide range of hotel brands, ranging from luxury chains to budget options. And falling in the middle of this range are two midscale hotel chains: TRU by Hilton and avid Hotels, operated by IHG.
What can foot traffic and demographic data reveal about the preferences of visitors to these chains? We took a closer look.
Visit Growth Year Over Year
TRU by Hilton and avid Hotels both opened their first locations in 2017, with the goal of offering travelers modern and comfortable accommodations while eschewing the amenities typically associated with more luxurious hotel categories. By streamlining services, these hotels can appeal to a diverse range of travelers while maintaining a lower price point.
The two hotel chains have expanded since their openings, with TRU operating 279 locations and avid operating 70 nationwide as of May 2024. And this expansion seems to be paying off for both brands, helping drive YoY monthly visit increases. Since June 2023, visits to the two chains have been consistently elevated YoY, save for a few minor visit lags at TRU.
Hilton and IHG both hope to continueexpanding their midscale hotel concepts, with projects in the pipeline for 2024 and beyond. And diving into the demographics can help the hotels identify their strengths and plan out marketing strategies more effectively.
Appealing Across The Board
Analyzing the psychographic makeup of TRU and avid’s trade areas by layering Spatial.ai’s PersonaLive dataset onto the two chains’ captured markets reveals that despite their budget offerings, both hotels appeal to economically diverse audiences.
Between June 2023 and May 2024, TRU and avid both attracted visitors from areas with higher-than-average shares of both “Ultra Wealthy Families” and “Blue Collar Suburbs.” The chains’ ability to appeal to both groups shows that their no-frills offerings are appreciated not just by the most price-conscious customers, but also by those with more room in their budgets to splurge.
Singles or Families?
Still, TRU drew a greater share of visitors over the analyzed period from areas over-indexed for “Ultra Wealthy Families'' – while avid drew slightly more customers from areas over-indexed for “Blue Collar Suburbs.” And diving deeper into the demographic and psychographic characteristics of TRU’s and avid’s captured markets shows that though both chains have broad appeal, there are some differences between their customer bases.
The median household income (HHI) of TRU’s captured market stood at $79.4K during the analyzed period – above the nationwide median – while that of avid remained slightly below it. And while avid’s captured market included a higher-than-average share of “Young Urban Singles” (also from Spatial.ai’s PersonaLive dataset), TRU was more likely to attract “Suburban Boomers.” So while TRU draws a wealthier and more settled clientele, avid tends to attract younger, less established guests.
These differences serve as a reminder of the differences that exist even within similar accommodation categories, and may help the two chains when deciding how to market to their respective customer bases.
Final Thoughts
Both TRU and avid seem similar enough on paper – two midscale hotel chains, geared towards a traveler that prioritizes value and convenience. And while both chains attract a wide range of households to their venues, TRU tends to see a more affluent, established visitor, while avid seems to attract more guests who are starting out in life.
For more data-driven travel & leisure insights, visit Placer.ai.
The Kroger Co, is a leading player in the grocery store space, operating its eponymous brand as well as a variety of regional banners. We dove into the data to see how key Kroger chains are faring in 2024 – and to explore the different audiences served by the company’s varied portfolio.
Samuel Roche
Jun 10, 2024
3 minutes
With sales exceeding $148 billion in 2023, The Kroger Co. is a leading player in the grocery store space. In addition to its flagship eponymous brand, the company owns a variety of regional banners, including (among others) Fred Meyer, Harris Teeter, Ralphs, Smith’s Food and Drug, Fry’s Food Stores, King Soopers, and Food 4 Less.
We dove into the data to see how key Kroger chains are faring in 2024 – and to explore the different audiences served by the company’s varied portfolio.
Setting the Stage: A Portfolio Breakdown
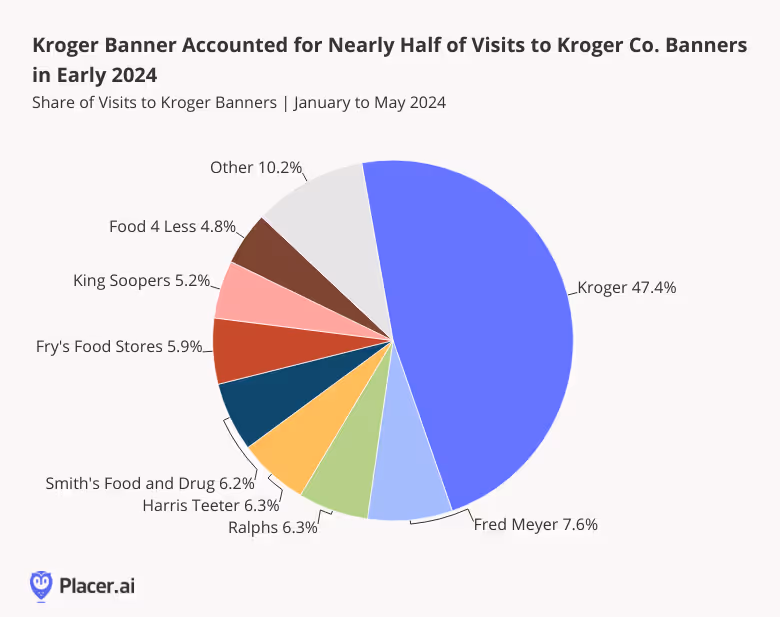
With some 1255 locations across 19 states, Kroger is The Kroger Co.’s largest grocery banner by far. And between January and May 2024, visits to the chain accounted for 47.6% of overall foot traffic to the company’s grocery portfolio. The remaining 52.4% of visits went to The Kroger Co.’s smaller banners – with Fred Meyer, Ralphs, and Harris Teeter leading the charge.
A Regional Deep Dive
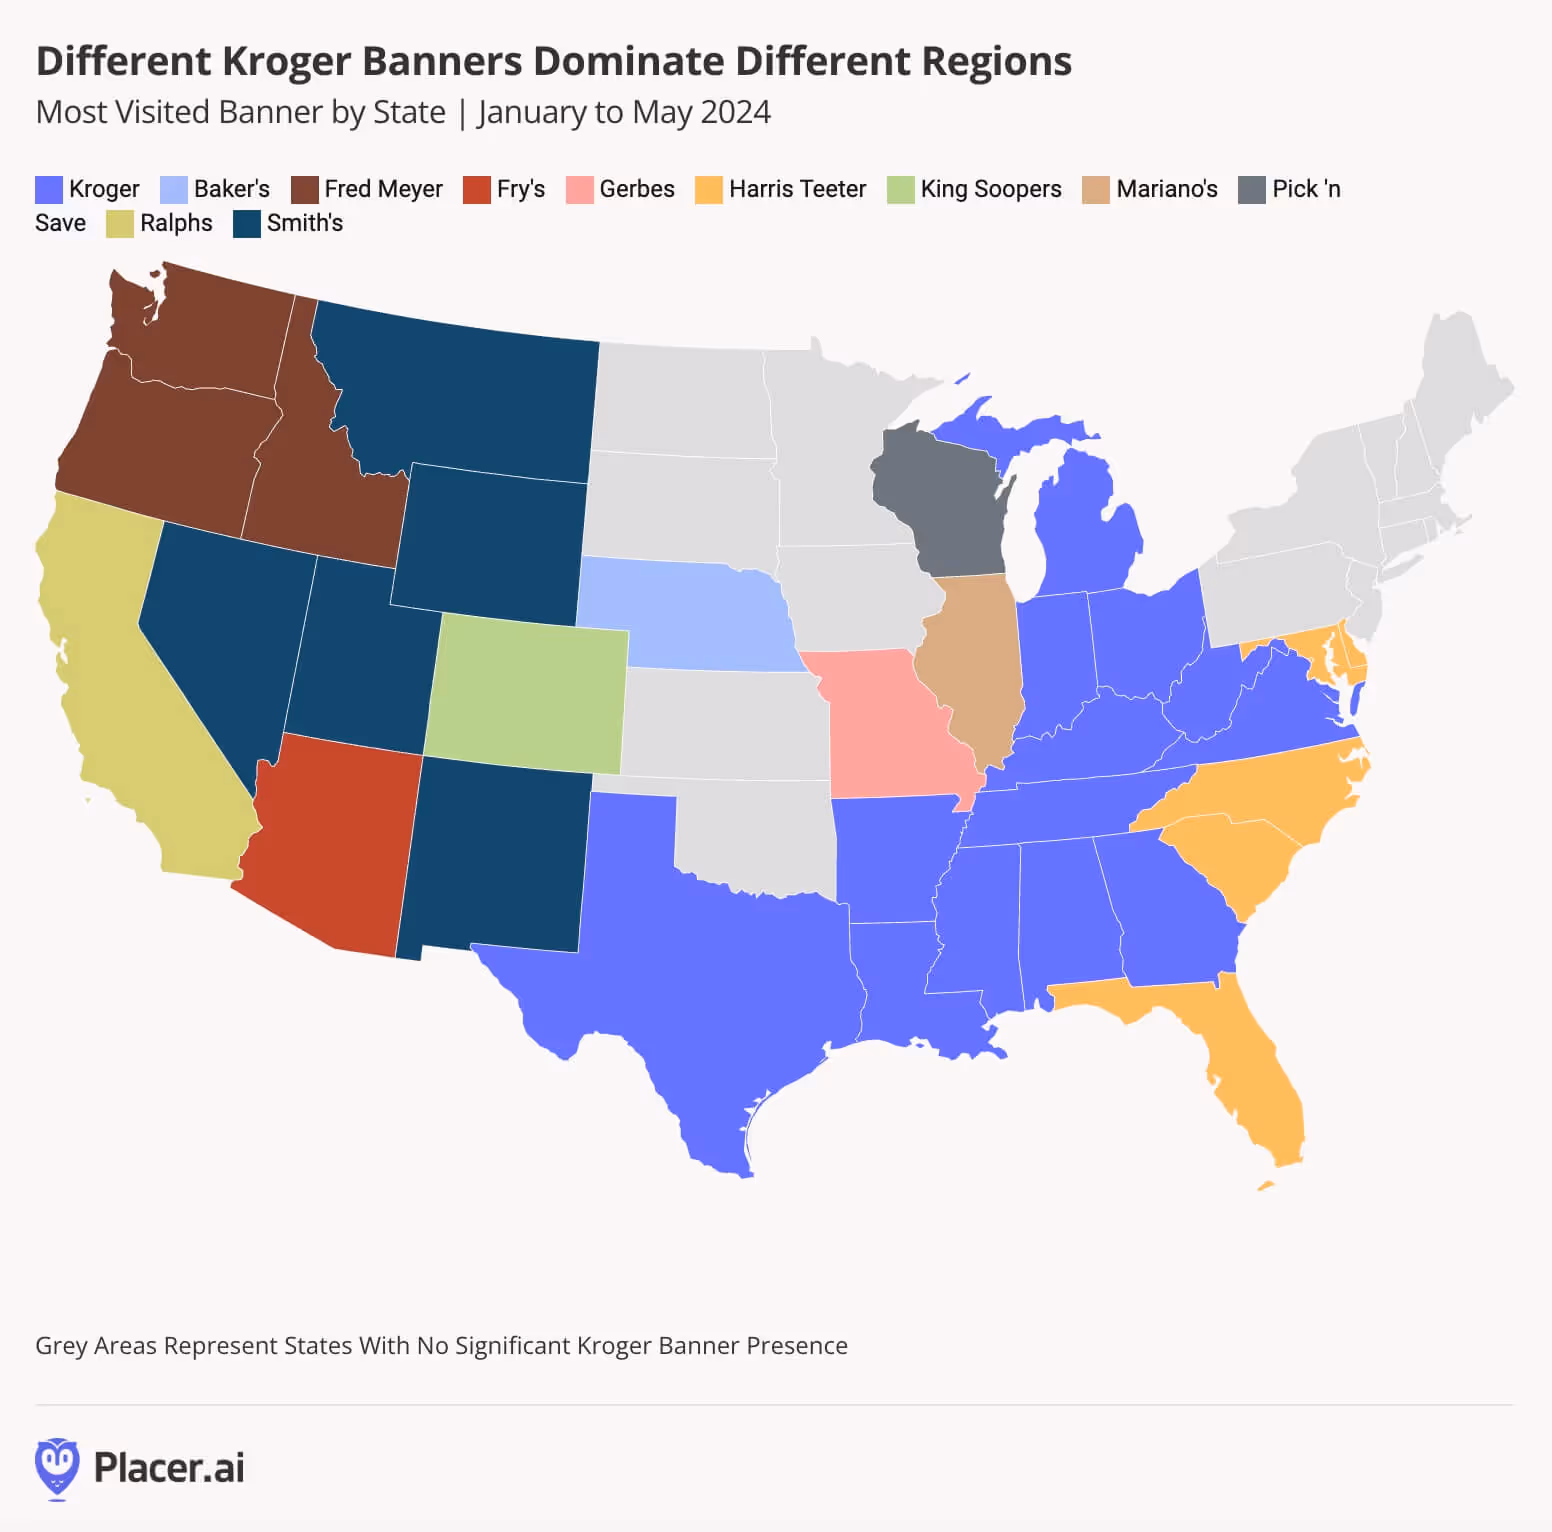
And drilling down deeper into the regional distribution of the company’s various grocery banners shows that each chain serves a different area of the country.
Kroger’s eponymous banner holds sway throughout much of the Midwest and South – while Harris Teeter serves shoppers in Maryland, Florida, and the Carolinas. Meanwhile, Fred Meyer, Smith’s, Ralphs, Fry’s, and King Soopers dominate the Western United States. And throughout some parts of the Midwest, Kroger draws consumers with a variety of smaller banners.
Like that of Albertsons, Kroger Co.’s strategy of acquiring and maintaining regional brands has allowed the company to expand its footprint across the country – while catering to the needs and preferences of local shoppers. Indeed, Kroger’s footprint now extends across three of the four U.S. regions – the West, South, and Midwest – with only the Northeast lacking a Kroger Co. presence.
Visits on the Rise
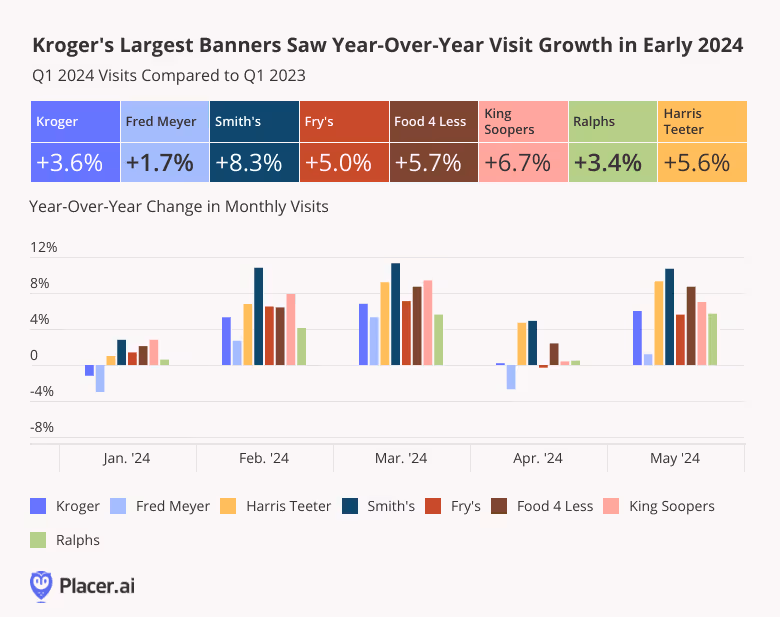
A look at recent visitation trends for Kroger Co.’s largest banners – i.e. those with at least 100 locations – shows that all experienced positive YoY visit growth in Q1 2024. The most impressive foot traffic bumps were seen by Mountain region banners Smith’s and King Soopers, followed by value-oriented Food 4 Less, and the South Atlantic-focused Harris Teeter.
On a monthly basis, too, The Kroger Co.’s major Banners saw nearly uniform YoY visit growth between January and May 2024.
Reaching Different Audiences
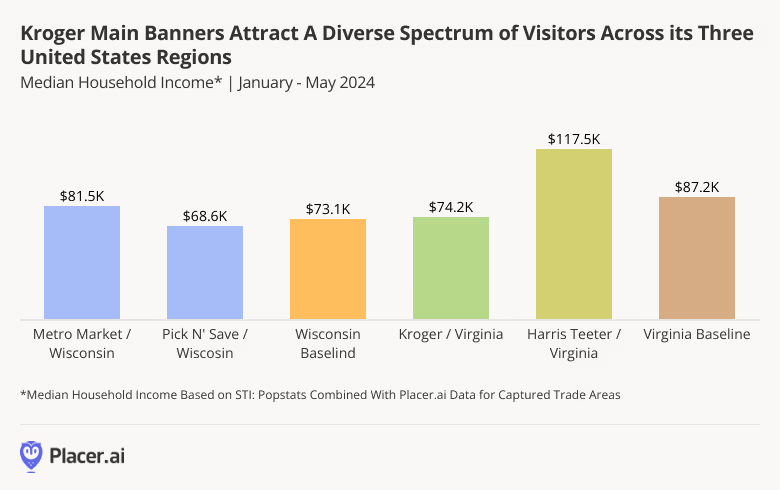
Analyzing demographic differences among the trade areas of Kroger’s different chains shows how the company leverages its portfolio of banners to serve distinct customer bases.
Virginia, for example, is served by two Kroger Co. banners – Kroger and Harris Teeter. And while the former draws shoppers from areas with a median HHI below the statewide baseline of $87.2K, the latter – with somewhat more upscale, pricier offerings – attracts a much more affluent audience. Similar differences can be observed in Wisconsin – where Pick ‘n Save and Metro Market serve different demographics.
By offering a diverse spectrum of shopping experiences, The Kroger Co. strategically positions itself to maximize market penetration and appeal to a broad range of consumers.
Looking Ahead
The Kroger Co. entered 2024 with a bang. With its extensive reach and adaptive approach, can the grocery leader maintain its positive momentum throughout the rest of the year?


.svg)