The beauty industry has proved to be one of the most resilient retail categories over the past few years – and Ulta Beauty has been one of the biggest beneficiaries of this trend. We analyze recent foot traffic performance and explore seasonal trends to better understand the chain’s visitor base.
Bracha Arnold
Mar 6, 2024
4 minutes
The multi-billion dollar beauty industry has proved to be one of the most resilient retail categories over the past few years – and Ulta Beauty has been one of the biggest beneficiaries of this trend, reporting record growth and experiencing strong foot traffic to its stores.
We dove into the location intelligence data for Ulta to analyze recent foot traffic performance, explore seasonal trends, and better understand the chain’s visitor base.
A Blush With Success Year-Over-Year
The past few years have seen Ulta’s monthly foot traffic growing on a near-constant basis – and 2023 was no exception. Year-over-year (YoY) visits to the chain were up by double digits most months and Ulta consistently outperformed the wider Beauty & Spa segment. The company’s success appears poised to continue in 2024, with January 2024 visits up 4.9% relative to the already impressive January 2023, even as foot traffic to the wider Beauty & Spa category dipped.
The consistent foot traffic growth Ulta experienced in 2023 and early 2024 is particularly impressive given that 2022 was also a banner year for the brand – meaning that foot traffic has exceeded the previous years’ growth for two years straight. And the company seems to be capitalizing on its success by further enhancing its shopping experience, expanding its presence with new stores, and emphasizing wellness offerings at existing locations to keep its customers coming back.
Holiday Highlights
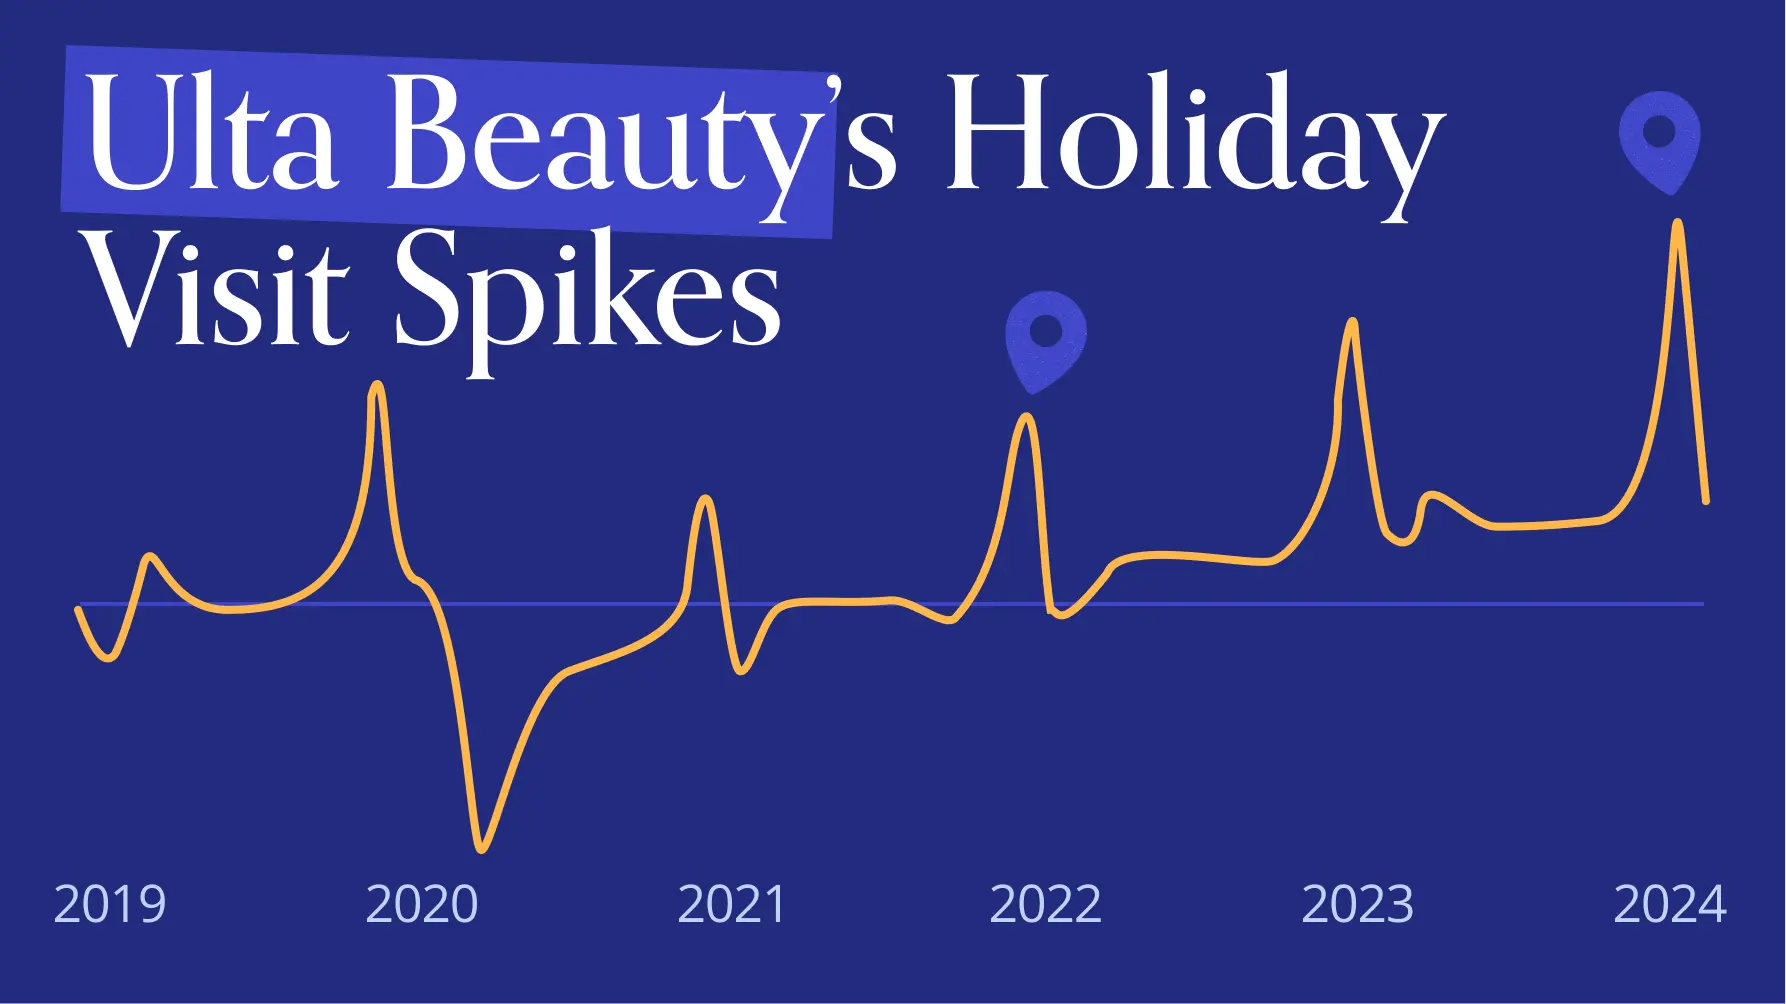
Charting the change in monthly foot traffic to Ulta helps visualize the chain’s seasonal visit patterns and highlight the company’s consistent upward climb since the 2021 retail reopening. The COVID-19 pandemic and ensuing lockdowns led to a steep drop in foot traffic, but visits picked up – and stayed up – as soon as social-distancing restrictions eased. And though inflation replaced the pandemic as an economic concern, Ulta visits continued on their upward climb, highlighting the broad appeal the chain offers to shoppers of all economic levels.
Ulta also enjoys significantly elevated visits during the holiday season, with foot traffic surging every December. And visits to the chain, even without a holiday spike, continue to exhibit growth – January 2024’s visits were 43.3% higher than they were in January 2019.
Valentine’s Variances
While December may be the month that Ulta sees the most visits, there are plenty of other minor holidays and retail opportunities that contribute to foot traffic spikes to the retailer. And although Valentine’s Day isn’t a holiday in the official sense of the word, Ulta still enjoyed a mid-week boost in visits on Wednesday, February 14th 2024.
Visits to Ulta grew 17.2% on Valentine’s Day compared to traffic of the previous six Wednesdays. February 14th 2024 also saw 10.5% more visitors to Ulta than the day did in 2023, signaling a continued, growing interest in the beauty retailer.
The Gen A Connection
Ulta has taken pains to carry products for consumers of all ages, genders, and backgrounds –and recently, one age group in particular has been making headlines for its interest in beauty and skincare. Teens and tweens have been flocking to their local malls to try out products from brands like Drunk Elephant, driven, in part, by the rise of #BeautyTok, where influencers on TikTok post their makeup and skincare routines.
And indeed, trade area data indicates that families of all types are overrepresented among Ulta’s visitor base: Analyzing the psychographic makeup of Ulta’s trade areas using the Spatial.ai: PersonaLive dataset revealed that the chain’s captured market* includes more family segments when compared to the chain’s potential market*. Specifically, the chain’s captured markets had higher rates of “Near-Urban Diverse Families”, “Upper Suburban Diverse Families”, and “Wealthy Suburban Families” relative to the chain’s potential market. On the flip side, “Young Urban Singles” saw a smaller share of visitors in Ulta’s captured market than in its potential market.
Ulta’s popularity with family segments may be due to the increased demand for skincare and makeup among the families’ younger generations. And by continuing to cater to these younger consumers – alongside the numerous other segment that shop at Ulta – the company can hope to foster long-term brand loyalty and continue driving sales and foot traffic to its stores.
*A chain’s potential market refers to the population residing in a given trade area, where the Census Block Groups (CBGs) making up the trade area are weighted to reflect the number of households in each CBG.. A chain’s captured market weighs each CBG according to the actual number of visits originating to the chain from that CBG.
Strong Foundations
Ulta continues to impress, growing its sales and foot traffic even during a uniquely challenging period for the average consumer. By creating a shopping experience that is accessible to people across all ages and income levels, the company ensures that its visits can continue to grow.
For more data-driven retail insights, follow placer.ai.
This blog includes data from Placer.ai Data Version 2.0, which implements improvements to our extrapolation capabilities, adds short visit monitoring, and enhances visit detection.
First Watch has been making waves in the casual dining space. The chain went public in 2021 and continues to drive consistent revenue and foot traffic – despite a stormy economic climate. We dove into the data to take a closer look at the consumer behavior behind First Watch’s success.
Ezra Carmel
Mar 5, 2024
3 minutes
First Watch has been around for over 40 years and is famous for being open from morning to early afternoon and a revolving menu that leans into seasonal ingredients. In recent years, the casual cafe – which derives its name from the nautical term for the first shift of the day – has made significant waves. The chain went public in 2021 and continues to drive consistent revenue and foot traffic – despite a stormy economic climate. We dove into the data to take a closer look at the consumer behavior behind First Watch’s success and understand where the chain could be heading in 2024 and beyond.
The Early Advantage
At First Watch, brunch and lunch join breakfast as the most important meals of the day. And while some of the chain’s competitors are open all day – or even all night – sticking to limited business hours has not steered the brand off course. Analysis of First Watch’s H2 2023 foot traffic compared to the wider breakfast-first category shows that First Watch’s monthly year-over-year (YoY) visits consistently outperformed the Breakfast, Coffee, Bakeries, and Dessert Shops space as a whole.
Some of the chain’s success is due to its expanding store fleet, with visits during the last five months of 2023 up by double digits compared to the equivalent months in 2022. And the chain is likely to rise even further in 2024 and beyond, with CEO Christopher Tomasso seeing continued expansion on the horizon.
Indeed, looking at more recent data shows that First Watch’s growth is continuing even relative to the already strong 2023, with foot traffic to the chain up YoY and outperforming the wider Breakfast, Bakeries & Dessert Shops space every week of 2024 so far.
The Next Voyage
C.E.O. Tomasso is determined to stay “true to who we are and what we’ve done regardless of how big we get.” And one way First Watch has stayed true to its identity is by being attentive to the preferences of its target audience. When customers wanted cocktails as a way to unwind with friends over brunch – First Watch delivered. And location intelligence can help identify the next consumer trend to drive the brand’s continued success.
Trade Area Analysis of First Watch in Q4 2023 using the AGS: Behavior & Attitudes dataset revealed that “Food Label Readers”, “Organic Foodies”, and “Vegans” were overrepresented in the restaurant’s trade areas compared to the nationwide benchmark. This indicates that First Watch’s commitment to fresh ingredients resonates with clientele that prioritize a healthy diet. Meanwhile, the data also showed that these consumers were likely to be involved in various forms of exercise; “Fitness Fans”, “Joggers”, “Pilates People”, and “Weight Lifters” were also prevalent psychographic segments in First Watch’s trade area.
This suggests that First Watch might consider exploring uncharted waters by adding smoothies or post-workout shakes to its menu, or by opening smaller-format locations in fitness centers to better serve its health-conscious audience.
Land Ho!
First Watch has enjoyed smooth sailing through a commitment to bringing diners a fresh take on breakfast, brunch, and lunch. As long as this ship stays anchored in its identity, First Watch should find that the wind is at its back for the foreseeable future.
For updates and more data-driven dining insights, visit Placer.ai.
This blog includes data from Placer.ai Data Version 2.0, which implements improvements to our extrapolation capabilities, adds short visit monitoring, and enhances visit detection.
A strong Q1 2023 and unusually cold weather were likely partially to blame for DICK’s and Hibbett’s sluggish early 2024. But by the end of January, YoY visit gaps had narrowed for both brands. Who is likely to visit these brands in 2024? We looked at the retailers’ trade areas to find out.
Ezra Carmel
Mar 4, 2024
3 minutes
Whether it’s an at-home yoga practice, a workout at the gym, or a sports league at the park, the biggest players in the sporting goods space – Hibbett Sports and DICK’s Sporting Goods – have the gear to keep a variety of consumers outfitted. Armed with the latest location intelligence data, we took a closer look at these retailers’ recent offline performance and analyzed some of the psychographic characteristics of visitors to DICK’s and Hibbett’s.
Visits Stay Close to 2022 Levels
Last year started off strong for DICK’s Sporting Goods and Hibbett Sports, with visits to both retailers up in Q1 2023 relative to the equivalent quarter in 2022. But ongoing inflation and tighter consumer budgets weighed on visits as the year progressed, and foot traffic to DICK’s and Hibbett dipped slightly year-over-year (YoY) in the second half of the year. Still, in spite of the challenges, both brands succeeded in keeping their visits close to 2022 levels and maintaining minimal visit gaps.
Early 2024 Visits Trending in a Positive Direction
The strong Q1 2023 combined with unusually cold weather were likely partially to blame for DICK’s and Hibbett’s sluggish early 2024 performance. But by the end of January, YoY visit gaps had narrowed for both brands – a promising sign for the year ahead.
Who is likely to visit these brands in 2024? We looked at the retailers’ trade area composition to find out.
Big Potential
Analyzing DICK’s and Hibbett’s trade area using the Spatial.ai: Proximity dataset revealed that both brands were positioned to drive traffic from two significant fitness-related psychographic segments at the end of 2023.
In Q4 2023, “Yoga Advocates” as well as fans of “Functional Fitness” were overrepresented in DICK’s and Hibbett’s trade area relative to the nationwide average. And DICK’s and Hibbett are investing heavily in getting these consumers in the door. DICK’s debut of a new functional fabric and ad campaign for its CALIA clothing line and Hibbett’s new joint loyalty program with Nike could provide an extra foot traffic boost from fitness-forward consumers as 2024 progresses. As temperatures thaw and demand rebounds, these consumers are likely to play a part in a foot traffic resurgence for both brands.
Room to Play in the Sporting Goods Space
But while certain sporty audience segments seem to visit both brands, diving deeper into DICK’s and Hibbett’s trade areas using the Spatial.ai: Followgraph dataset also revealed differences between the two retailers’ offline consumer base.
For example, the share of “Hunting Enthusiasts” in DICK’s trade area was 8% smaller compared to the nationwide average, while Hibbett’s trade area included 20% more “Hunting Enthusiasts” than the prevalence of the segment nationwide. Meanwhile, the “Triathlon Participants'’ segment was overrepresented in DICK’s potential market – 4.0% above the national average – and underrepresented in Hibbet’s potential market (8.0% below). These differences suggest that the sporting goods space is big enough to accommodate multiple players at the top, with leading retailers each carving out their own slice of the market.
So Much Potential
After a relatively rocky end to 2023, foot traffic appears to be on the upswing for both DICK’s and Hibbett early on in 2024. The prevalence of fitness-minded and sporting consumers in the trade areas of both brands could provide a continued foot traffic lift in the weeks and months ahead.
For updates and more data-driven foot traffic insights, visit Placer.ai.
This blog includes data from Placer.ai Data Version 2.0, which implements improvements to our extrapolation capabilities, adds short visit monitoring, and enhances visit detection.
In the U.S., one can find many different dishes that incorporate a range of culinary traditions: Kogi truck introduced us to the joy of putting short ribs and vinaigrette slaw in a corn tortilla, topped off with a distinctly Korean salsa made of Korean chiles, rice wine vinegar, and scallions; Banh mi po’ boys combine the best of Vietnamese and Louisianan tradition; Lime and jalapeno-topped yellowtail sashimi hearkens to both Japanese and Peruvian lineages.
In Los Angeles, the LA Times takes readers on a culinary journey to the world of Black Tacos, where lines can reach 3 hours at Worldwide Tacos as one chooses from unique protein options like lamb, salmon, crab, and duck and mouthwatering flavor combinations like jerk, curry, pina colada, blueberry with blue cheese and raspberry chipotle.
While often anchored with a traditional corn tortilla, Black tacos also incorporate flavors and techniques from soul food, such as versions that use barbeque sauce, yams with wild rice, ground turkey, pulled pork, or hot honey catfish.
Alta Adams has its own take on Black tacos with a jerk-spiced sweet plantain taco. Nestled within a homemade corn tortilla, one will find caramelized plantain, mango-habanero salsa and chopped onion and cilantro. In 2022, the Hollywood Reporter named this spot “Black Hollywood’s Top Restaurant for Power Dining.” This restaurant is a popular evening destination, as patrons sip their inventive cocktails well into the night and see if they might catch a glimpse of Jay-Z or John Legend.
At the Smithsonian’s National Museum of African American History and Culture, the entire month of February was dedicated to “African Americans and the Arts” and the impact of African Americans on visual arts, music, cultural movements, and more. From the BLM Movement to Harlem Hellfighters, Hip Hop and Rap to Musical Life at HBCUs, a rich cornucopia awaits. Per Spatial.ai PersonaLive, among those who visited in the past 6 months, when we look at those comprising 70% of visits, nearly 3 in 10 are Educated Urbanites, as well as a healthy dose of Young Professionals, Near-Urban Diverse Families, and Ultra Wealthy Families.
The museum also attracted a broad cross-section of different ethnicities.
Discount & Dollar stores thrived in 2022 and 2023, as inflation drove many shoppers to trade down and seek out cheaper retail alternatives. How is the category faring into the new year? We dove into the data to find out.
Lila Margalit
Feb 29, 2024
3 minutes
Discount & Dollar stores thrived in 2022 and 2023, as inflation drove many shoppers to trade down and seek out cheaper retail alternatives. But how has the category continued to fare in the new year? Have stabilizing prices led shoppers away from discount chains? Or have dollar stores cemented their position as go-to retailers even when money isn’t quite as tight?
We dove into the data to find out.
January 2024: Holding Onto Gains
Over the past two years, Discount & Dollar Stores have emerged as major disruptors, diversifying both their offerings and their price points – and the category leaders’ continued visit growth suggests that this strategy is helping the chains build significant strength. By investing in private label food items and stocking fresh produce at thousands of locations, Dollar General has established itself as a prime low-cost grocery destination. Family Dollar, owned by Dollar Tree, has also made strong inroads into the supermarket scene, with everything from fruits and veggies to cage-free eggs. Dollar Tree has also broadened its grocery selection to include an array of chilled and frozen foods.
In January 2024, Discount & Dollar Stores saw a further increase in year-over-year (YoY) visits, building upon the category’s impressive post-COVID gains. Most of the analyzed category leaders also saw YoY visit jumps – no small feat given these retailers’ strong 2022 and 2023 performance.
Sustained Seasonal Growth in the Bargain
Zooming out on the longer-term visitation trajectories of leading discount chains shows just how well positioned the category remains for continued success. Compared to a January 2020 pre-COVID baseline, visits to Dollar General and Dollar Tree were up 24.3% and 14.0%, respectively, in January 2024. While these foot traffic increases were undoubtedly fueled in part by the continued expansion of the chains’ footprints, they highlight strong and growing demand for the category’s bargain fare.
The chains’ visit patterns also reveal clear seasonality in visitation patterns to leading Discount & Dollar Stores, with the chains emerging as holiday shopping destinations. Dollar Tree, which continues to price most items at $1.25, experiences more pronounced seasonal peaks, with visits spiking during the holiday season. And though Dollar General has firmly positioned itself as a year-round destination for essential goods, it too sees foot traffic spikes in December.
The Secret to Discount Chains’ Success
The emergence of Discount & Dollar chains as affordable venues for much-needed necessities has been a major factor in the segment’s success. But the category’s strong positioning as a key holiday shopping player has also helped solidify its place in the nation’s retail landscape.
And looking at monthly fluctuations in the median household income (HHI) of Discount & Dollar Stores’ captured markets shows a subtle but distinct HHI spike during the peak holiday season – meaning that the category draws its audiences from slightly more affluent areas during this all-important time of the year. This trend may be a further indication of the mainstreaming of dollar stores – with higher-HHI consumers especially likely to seek out their bargain-priced quality merchandise in the runup to Christmas.
Key Takeaways
Since COVID, Discount & Dollar Stores have solidified their position as mainstream shopping destinations for everything from basic food items to home goods and party supplies. And if January 2024 is any indication, you can bet your bottom dollar on the category’s continued strength heading into the new year.
Follow Placer.ai for more data-driven retail analyses.
This blog includes data from Placer.ai Data Version 2.0, which implements improvements to our extrapolation capabilities, adds short visit monitoring, and enhances visit detection.


.svg)


.png)
.avif)
.png)
.png)

.avif)
.avif)
.avif)

.png)
.png)
.png)
.avif)


%20(1).png)
.png)
.png)
.avif)

