With athleisure and sportswear becoming bonafide wardrobe staples, more consumers than ever are investing in high-end items. Two players—Nike and Lululemon—are at the forefront of this trend. We examine the demographics of the two chains' consumer bases to see what is driving visits.
Ezra Carmel
Mar 18, 2024
3 minutes
Athleisure and sportswear are a go-to for consumers looking to move seamlessly between activities – from a workout to work-from-home. That functionality has kept the category running hot in recent years even while more consumers are getting back to the office and socializing. And since athleisure and sportswear are now bonafide wardrobe staples, more consumers are investing in high-end items. We dove into the data for two of the category’s biggest upscale players – Nike and lululemon – in order to take a closer look at the consumer behavior driving visit growth.
Without Breaking A Sweat
During all four quarters of 2023, Nike and lululemon saw year-over-year (YoY) foot traffic growth that surpassed the visit increases in the wider Athleisure & Sportswear space. Part of Nike’s sizable 2023 YoY visit gains were likely due to the addition of a large number of stores relative to its somewhat modest footprint. Nike is continuing to invest in own-brand stores to boost DTC business including the first U.S. Michael Jordan "World of Flight" store coming to Philadelphia, PA. Lululemon also expanded its store count – albeit more modestly – which likely also helped the company stay ahead of the competition.
How is 2024 Shaping Up?
Fueled by significant store growth, Nike managed to keep YoY foot traffic positive in the first two months of 2024 despite the arctic blast that plagued overall retail visits in January.
Lululemon and the wider Athleisure & Sportswear space were less insulated from the effects of the storm, and the comparison to a strong 2023 made for mild YoY visit gaps in January 2024. But by the end of February 2024, both lululemon and the Athleisure & Sportswear space had narrowed their visit gaps and appeared to be on an upward trajectory.
An Affluent Incline
Diving deeper into the demographic data for Nike’s trade area indicated that the aggressive expansion is not the only factor driving the brand’s recent foot traffic gains. Analysis using the AGS: Demographic Dimensions dataset revealed that since the 2021 retail reopening – and specifically Q3 2021 – the median household income (HHI) of Nike’s captured market has been higher than that of its potential market*. And the gap between the median HHI in the brand’s captured and potential markets seems to have widened even further in 2022-2023.
Driving traffic from affluent consumers appears to be an intentional strategy by the brand. Nike CEO John Donahoe recently noted that the brand is expanding in products across price points and now offers more expensive womenswear than ever before – and location intelligence indicates that this strategy is working. By Q4 2023, the median HHI of Nike’s captured market had climbed to $95.6K – the highest in nearly five years. This suggests that despite the adverse impact of inflation on some aspirational shoppers, Nike is succeeding in driving high-value foot traffic.
*A chain’s potential market refers to the population residing in a given trade area, where the Census Block Groups (CBGs) making up the trade area are weighted to reflect the number of households in each CBG. A chain’s captured market weighs each CBG according to the actual number of visits originating to the chain from that CBG.
Will the success of upscale athleisure and sportswear continue in 2024? Visit Placer.ai to find out.
This blog includes data from Placer.ai Data Version 2.0, which implements improvements to our extrapolation capabilities, adds short visit monitoring, and enhances visit detection.
The big news coming out of Dollar Tree’s Q4 2023 update was that the company plans to close 1,000 stores following a comprehensive portfolio review (which we first discussed in December). Management plans to close approximately 600 Family Dollar stores in the first half of fiscal 2024, with another 370 Family Dollar and 30 Dollar Tree stores expected to close over the next several years as store lease terms expire. The 970 anticipated Family Dollar store closures represent 11.6% of the banner’s 8,359 stores opened as of the end of February. Dollar stores were one of the strongest performing categories from a visitation (new stores and perspective during 2023 (below), so it may seem surprising that Dollar Tree plans to close so many Family Dollar stores during 2024.
Dollar Tree’s decision to close Family Dollar stores echoes a lot of what we’ve heard from other retailers closing stores in recent years, including Macy’s, CVS/Walgreens, and others. For the most part, retailers’ decisions to close stores comes down to a combination of factors: (1) population migration has changed the supply/demand balance in a given market; (2) consumer behavior has changed post-COVID; (3) the retailer is facing new sources of competition and eroding consumer loyalty; and (4) retailers are replacing underperforming stores with a modernized store layout.
Management cited changing demographics and market saturation as key considerations driving its consolidation efforts for Family Dollar. While the company has not announced which locations it plans to close, we’ve plotted Family Dollar’s 1,000 lowest performing locations over the trailing twelve months on a visit per square foot basis below.
If we compare this to a map of changes in Origin/Destination Household Income Ratio over the past four years (using Placer’s Migration Trends report), the changing demographics that Dollar Tree cited becomes evident. Many underperforming Family Dollar locations are in the Mid-Atlantic and Southeast markets, several of which have seen an increase in higher household income population due to migration (represented by the green dots below). As populations in these markets have shifted, it’s not surprising that the company is reevaluating its store portfolio in these markets.
The other factor at play behind these store closures is increasing competition. We’ve discussed disruption from Temu and other online marketplaces in the past, but dollar stores are also fighting for visitor share with value grocery chains, superstores, and convenience stores. And it’s not just lower-income consumers that these chains are fighting over–we’re seeing increasing evidence that dollar stores are seeing visits from middle income consumers. In fact, Dollar Tree CEO Rick Dreiling noted that Dollar Tree added 3.4 million new customers in 2023, mostly from households earning over $125,000 a year. We’ve previously noted how Walmart has been successful attracting more middle-income consumers but if we look at captured trade area demographics for the Dollar Tree banner (and not including Family Dollar) from Q3 2023 to Q4 2023, we do see an increase in the trade areas between $50-$150K in household income (below).
Admittedly, some of the increase in higher-income consumers can be explained by the aforementioned migration trends, but management also attributes the pick up in middle-income consumers to its multi-price point strategy called “More Choices” (which we’ve discussed in the past). In particular, we believe the company has seen success driving visits to Dollar Tree stores with its $3, $4, and $5 frozen and refrigerated assortment, which have been rolled out to more than 6,500 locations today (almost 80% of the banner’s store base as of February). The company has also discussed adding cooler capacity at Family Dollar stores; 17,000 cooler doors were added at Family Dollar last year, which brought the average to 26 coolers per store (versus a long-term goal of 30 coolers per store). We suspect that many of the closed Family Dollar stores will be replaced with new stores featuring expanded cooler offerings to better compete for customers across all demographic groups.
There are also more practical reasons for the store closures, including improved execution. Dreiling pointed out that underperforming stores can “take the bulk of a district manager's time”. By closing them, the company can better focus on service and execution at existing stores. Also, management believes that the closings will be accretive from a cash perspective (i.e., it’s cheaper to run these underperforming stores dark than it is to operate them at a loss).
When closing stores, there is always the risk that customers will churn to competing retail brands and categories. In fact, we’ve seen a meaningful number of visitors to CVS and Walgreens locations that closed the past two years migrate to nearby grocery and superstore chains. However, by replicating many of Dollar Tree’s successful strategies–including expanded cooler assortments–at future Family Dollar store openings, it gives the chain an opportunity to offset potential visitors lost to this round of closures.
Below, we’ve presented visit per location data for the 12 Dick’s House of Sport locations currently open versus Dick’s chainwide average since the beginning of 2023. The strong visits per location trends that we identified last July continued into the back half of 2023 and early 2024, with House of Sport locations now seeing 5-6 times the number of visits per location compared to the rest of the chain. For reference, the average Dick’s Sporting Goods store is roughly 50K square feet square feet compared to 100K-120K square feet for House of Sport, indicating that House of Sport is also outperforming on a visit per square foot basis.
Given the strong visitation trends, it’s not surprising that Dick’s plans to invest more in the House of Sport concept in the years ahead. In 2024, the company plans to open eight new locations, with seven being planned relocations/conversions of existing Dick’s stores and one new store at Prudential Center in Boston. The company also plans to begin construction this year on approximately 15 House of Sport locations that will open throughout 2025, bringing the total number of House of Sport locations to 35 by the end of 2025. Longer-term, management sees an opportunity for 75-100 House of Sport locations by 2027.
Interestingly, Dick’s plans to incorporate experiential elements similar to House of Sport across the rest of its store portfolio. During its Q4 2023 update this past week, management also announced plans to open 16 next-generation 50K square foot Dick’s Sporting Goods stores in 2024, including the relocation/remodeling of 12 existing stores (on top of the 11 next-generation stores already opened). These next generation stores were inspired by the House of Sport format and incorporate expanded product assortments for certain categories, emphasis on services, and improved visuals. The company also plans to open 10 Golf Galaxy Performance Center locations in 2024 (aligning well with golf’s post-COVID comeback).
In total, Dick’s Sporting Goods plans to increase square footage by approximately 2% in 2024, marking the retailer's largest annual square footage increase since 2017. Importantly, the economics behind Dick’s nascent store formats are compelling. The House of Sport formats generate approximately $35 million in omnichannel sales per store, approximately 20% EBITDA margins, and cash-on-cash returns of 35% on an initial investment of $18.5M ($11.5M capex, $3.5M inventory, and $3.5M pre-opening costs). The next-generation Dick’s stores are expected to generate $14M in omnichannel sales per store, 20% EBITDA margins, and cash-on-cash returns of 65% on an initial investment of $4.5M ($2.5M capex, $1.5M inventory, and $0.5M in pre-opening costs).
Meow Wolf’s Omega Martin Las Vegas is an immersive entertainment experience that is sui generis and requires an in-person visit to truly understand this one-of-a-kind adventure. It’s a bit like an escape room, a bit of a psychedelic art show, with tongue-in-cheek humor and a satiric take on our consumerist tendencies. Make sure to keep an open mind when you visit and don’t be afraid to touch and feel the objects. In addition to Las Vegas, there are also locations in Denver “Convergence Station”, Grapevine “The Real Unreal”, and Santa Fe “House of Eternal Return”, with Houston opening in 2024.
When we look at participants from Las Vegas, Denver, and Grapevine, per Spatial.ai Followgraph, they have a higher propensity for being enthusiasts about Artificial Intelligence, Robotics, Electric Vehicles, Celebrity Entrepreneurs, Mental Health Advocates, and Athleisure. They are more likely than average to Chase Credit Card Rewards, Invest in Real Estate, eat Mexican Food, and LoveBBQ.
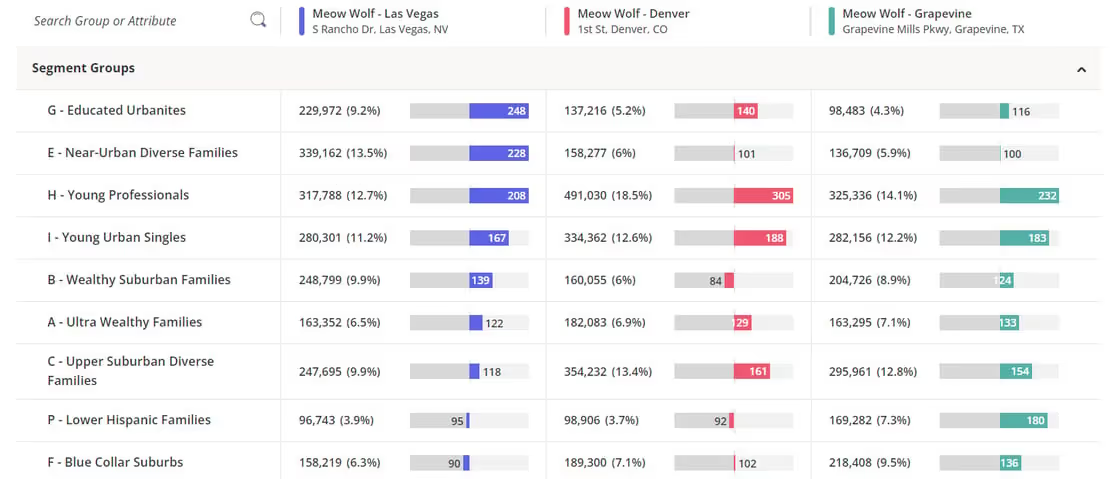
The segments they come from are varied, per Spatial.ai PersonaLive. Las Vegas tends to attract the most Near-Urban Diverse Families, followed by Young Professionals. Nearly 1 in 5 at the Denver location are Young Professionals, as are 14.1% in Grapevine.
Those visiting the Denver location stay the longest, with a median dwell time of 120 minutes. Santa Fe is next at 109 minutes.
As the experience economy evolves, the options for fun continue to grow. Here at the Anchor, we’ve delved into eatertainment, bowling, rock climbing, pickleball, mini-golf, driving ranges, and more. Enter Axe Throwing. It’s the type of activity you’ll often see on some of those reality dating shows, but upon closer inspection, it’s also come into a league of its own, and with technology allowing one to project targets onto the cork board, the ante is upped with a variety of games available. The International Axe Throwing Federation has over 20,000 members in 9 countries, pointing to the popularity of this sport worldwide. Here in the US, two large chains include Bad Axe Throwing and Bury the Hatchet.
An uncharacteristic cold snap at the beginning of the year had a major impact on consumer behavior across several retail categories. How big an influence did the conditions have on foot traffic? We dove into the latest location analytics to find out.
Ezra Carmel
Mar 14, 2024
3 minutes
Of all the predictions about what would be the prevailing retail trends in 2024, an uncharacteristic cold snap wasn’t on anyone’s radar. But so far this year, extreme weather has had a major impact on consumer behavior in a host of retail categories. How big an influence have drastic conditions had on foot traffic and what visit patterns are emerging as temperatures thaw? We dove into the latest location analytics to find out.
Off to a Cold Start
A powerful Arctic blast gripped a large portion of the continental U.S. in January 2024. And along with other disastrous consequences, the chill caused many consumers to stay indoors – resulting in a decline in overall retail visits.
Although retail foot traffic the week of January 8th, 2024 was almost in line with 2023 levels – likely due to a flux of consumers stocking up on essentials – the week of January 15th saw the overall retail visits gap widen to 2.9% year-over-year (YoY) as the storm expanded its grip on the country.
The worst of the cold abated in late January 2024, and consumers appeared to be out and about again – catching up on errands and making up for time spent cooped up at home. Overall retail visits picked up steam the week of January 22nd, 2024 and sustained positive YoY growth through February.
Mapping a Retail Storm
Zooming in on retail foot traffic by state revealed the scope of the storm’s impact on visits nationwide. Generally, states that bore the brunt of the cold blast saw the widest YoY retail visits gaps. And although perennial cold weather regions were not spared from the unusual cold spell, consumers in the often frigid Upper Midwest and Northeast may have been more acclimated to the cold and therefore able to maintain somewhat normal shopping routines.
In January 2024, Montana, Wyoming, the Dakotas, and Minnesota – along with Maine, Vermont, and New Hampshire – all experienced YoY retail visit growth, despite the extreme weather. Meanwhile, foot traffic in much of the Midwest and South buckled under the abnormal conditions.
The resilience of the Upper Midwest and the Northeast was evident again as temperatures thawed. While winter weather was still prevalent in these parts, North Dakota, Minnesota, Wisconsin, Maine, and Vermont all cozied up to over 8.0% YoY retail visit growth in February 2024.
Out of the Freezer
As was the case for retail foot traffic patterns as a whole, the cold snap took a toll on visits to the dining space early on in 2024. The data suggests that many consumers stayed home and cut back on dining out during the extreme storm. But as temperatures more or less normalized, restaurant-goers were eager to get back to their favorite dining hot spots.
Analysis of weekly foot traffic to the various dining categories in January and February 2024 once again showcased the industry’s resilience and the strength of discretionary spending as a whole.
Heat and Serve
Diving into dining foot traffic on the state level provided further evidence that freezing conditions likely influenced the eating-out behavior of consumers.
Location analytics revealed that as storms raged in January 2024, southern and midwestern states – where consumers may have been caught off guard by the extreme weather – experienced the widest YoY dining visit gaps. Meanwhile, upper midwestern and northeastern states – where consumers are generally accustomed to harsher winters – produced dining traffic growth.
In February 2024 – as temperatures warmed – several states in the Upper Midwest and Northeast mustered exceptional increases in YoY dining visits. But notably, all of the continental U.S. saw YoY dining traffic growth during that month – further indication of the dining space’s ability to bounce back from adversity and the sustained demand for going out.
Which retail trends will prevail as 2024 progresses? Visit Placer.ai to find out.
This blog includes data from Placer.ai Data Version 2.0, which implements improvements to our extrapolation capabilities, adds short visit monitoring, and enhances visit detection.


.svg)


.png)
.png)
.png)


.png)

.png)


