Dollar Tree's recently announced plan to sell Family Dollar at a significant loss is another sign of the recent struggles in the discount and dollar store sector. We dove into the data to understand what is driving Dollar Tree’s decision and what this means for Family Dollar moving forward.
Shira Petrack
Mar 31, 2025
5 minutes
Dollar Tree's recently announced plan to sell Family Dollar at a significant loss is another sign of the recent struggles in the discount and dollar store sector, highlighted by last year’s closure of 99 Cents Only and Big Lots' bankruptcy filing. We dove into the data to understand what is driving Dollar Tree’s decision and what this means for Family Dollar moving forward.
Growth Decelerating for Wider Discount & Dollar Store Category
The discount & dollar store category had been on the rise before the pandemic, and COVID gave the segment another considerable boost – in part thanks to discount and dollar stores’ designation as “essential retailers” that could remain open during lockdowns. Category leaders Dollar General and Dollar Tree continued their aggressive fleet expansions to meet the growing consumer demand, which led to a substantial overall increase in visits to the category.
But zooming in on 2024 data suggests that visit growth to the category is slowing down. Although discount & dollar stores are holding on to their pandemic gains – traffic to the segment is still 57.8% higher than it was in 2017 – year-over-year (YoY) growth is slowing, with 2024 visits up 2.8% compared to 2023, in contrast to 2022 and 2023’s YoY jumps of 7.8% and 7.7%, respectively.
This deceleration of growth is not in itself worrisome – no retail category can sustain rapid growth indefinitely. But the visit trends do signal that discount & dollar store leaders seeking an edge over the competition will need to adopt more strategic approaches and avoid allocating resources to overly risky ventures.
Dollar Tree Thrived While Family Dollar Lagged Behind
Overall visits to the Dollar Tree brand were already on the rise prior to COVID and skyrocketed over the pandemic – leading to a 60.1% increase in overall visits between 2017 and 2024. But, like with the wider category, traffic growth to Dollar Tree seems to be decelerating – the banner posted a 5.4% YoY increase in visits in 2024 compared to a 13.9% YoY increase in 2023.
But Family Dollar lagged behind, apparently immune to the COVID-driven dollar store visit surge. Traffic to the chain in 2024 was down 4.0% YoY and just 3.6% higher than it was in 2017. And although Dollar Tree’s decision to close nearly 1000 Family Dollar stores appears to be bearing fruit – in 2024, average visits per venue were up 1.7% YoY and 16.9% relative to the 2017 baseline – the improvement seems to have been insufficient to prevent the banner’s sale.
What Hampered Family Dollar’s Growth?
Family Dollar has faced plenty of difficulties in the last several years, so it’s difficult to attribute Dollar Tree’s offloading of the banner to a single factor. Still, one major element that likely hurt the brand’s performance was the intensified competition from other discount and dollar store leaders – including from sister banner Dollar Tree.
Family Dollar visitors have always been keen Walmart shoppers – since 2019, over 90% of Family Dollar yearly visitors also visited Walmart, and these cross-visit trends have remained relatively stable over the past six years. Other dollar stores were not always as popular with Family Dollar shoppers – in 2019, less than two-thirds of Family Dollar visitors also visited a Dollar Tree or a Dollar General. But as those chains grew, so did their appeal to Family Dollar shoppers – by 2024, over three-quarters of Family Dollar visitors also visited Dollar Tree or Dollar General – and this increased competition likely hampered Family Dollar’s growth.
Family Dollar Can Fill a Unique Niche in the Dollar Store Space
Still, despite the increasingly competitive discount and dollar store space, analyzing Family Dollar’s trade area composition reveals that the chain fills a unique niche within the broader discount retail sector.
Family Dollar tends to attract the least affluent visitor base – the median household income (HHI) in the chain’s captured market trade area is $53.9K, compared to $67.6K, $61.8K, and $68.7K for Walmart, Dollar General, and Dollar Tree, respectively. Family Dollar’s captured market also includes the highest share of urban areas, with 36.9% of its trade area defined as “Urban Periphery” or “Principal Urban Center” by the Esri: Tapestry Segmentation database.
Family Dollar can draw on its distinctive position as an urban-based retailer catering to value-seeking consumers to set itself apart from the competition and lay the groundwork for a successful resurgence.
Family Dollar’s Path to a Comeback
Although Family Dollar was sold at a substantial discount from its original purchase price, the chain still has a promising opportunity to re-establish itself as a powerful contender in the discount retail landscape. By prioritizing locations in urban areas that are less exposed to direct competition from the other major players and keeping its prices competitive with those of other dollar and discount retailers, Family Dollar can lay the groundwork for a successful resurgence.
For more data-driven retail insights, visit placer.ai
Five years after the pandemic, and deep into a renewed national interest in wellness and sober living, how is the Bev Alc segment faring? We took a deep dive into the space to uncover new trends, changes with consumer engagement, and potential headwinds for the industry.
Elizabeth Lafontaine
Mar 28, 2025
5 minutes
Consumers have been taking stock of their habits and behaviors over the past few years. With the explosion of semaglutide medications in the market and the high frequency of adoption by consumers, there’s a renewed focus on health and wellness across the U.S. population that extends to other consumption behaviors. One of the outcomes of this change in perspective is the increased scrutiny around the consumption of alcoholic beverages – especially among younger consumers.
At the same time, alcohol consumption increased handily during the pandemic, which has helped liquor stores and retail chains to stand out from the rest of the retail industry. As we hit the five year anniversary of the beginning of the pandemic, it’s time to dive deeper into the Bev Alc space to uncover new trends, changes with consumer engagement, and potential headwinds for the industry.
Deceleration in Liquor Store Visit Growth in 2024
Liquor store chains benefited greatly from shifts in behavior during the pandemic, and for the most part, they’ve been able to sustain those levels of success over the past few years. However, 2024 signaled a deceleration of foot traffic growth across chains, particularly in the second half of the year.
Bev Alc had been a visitation leader in the essential side of the retail industry in the early days of the pandemic, and the category continued to benefit greatly from sustained levels of alcohol consumption even after pandemic restrictions eased. But as with all pandemic-era consumer habits, as we approach the five year anniversary, reversal of some trends are taking shape: While year-over-year visits continued to rise in 2024, last year’s 4.0% average increase in monthly visits was significantly less than the 8.6%, 9.1%, 7.1%, or 6.7% average increases in monthly visits in 2020, 2021, 2022, and 2023, respectively.
There are also various factors that could potentially impact the industry this year: Decreased consumption of alcohol that could have played a role in 2024’s softening of visits is likely to continue in 2025, and potential tariffs on popular spirits like Tequila and Mezcal may impact consumer preferences going forward.
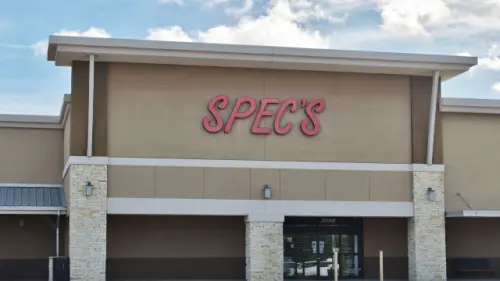
Spec’s Outperformed the Bev Alc Category in 2024
From a retailer perspective, Spec’s posted the strongest visit performance while BevMo! had the most challenging 2024 of the larger liquor retail chains, although most chains experienced some softening in foot traffic throughout the year. Bev Alc retail is a notoriously regional and local category, meaning that changes in foot traffic by chain are often impacted by what’s going on in a specific region of the U.S. BevMO! services Arizona, California and Washington, so the chain’s modest performance may point to some decreases in demand across the western part of the country. Meanwhile, Spec’s operates primarily in Texas, and its consistent YoY visit growth throughout 2024 may suggest that the shift in alcohol consumption habits has been more muted in the Lone Star State.
What’s Driving Liquor Store Visitation Shifts?
With the broader context of what’s going on across the category analyzed, what’s really driving these changes in visitation to liquor stores? As referenced, there’s been a narrative that younger consumers’ changing alcohol consumption habits will greatly impact the Bev Alc space.
But layering Spatial.ai’s Personalive demographic and psychographic visitor segmentation onto liquor store’s captured market reveals a slightly more nuanced reality. The data shows that between 2019 and 2024, the share of wealthier families and of Educated Urbanites – a younger, well-educated, and more affluent cohort – in the captured market of liquor stores. During the same period, the share of Young Professionals and Young Urban Singles – both segments of younger visitors have lower median household incomes than Educated Urbanites – actually increased.
What the data reveals is that we can’t build a singular narrative around the alcohol habits of all younger consumers; there’s also a layer of socioeconomics that has also impacted consumers' desire to frequent liquor stores and engage in alcohol consumption. This knowledge may also contribute to the changes we’ve seen in BevMo!’s business, as their highest shares of visitation come from wealthier families and Educated Urbanites.
Shifts in Visit Times
Foot traffic estimates also reveal that consumers have shifted the time of day that they visit liquor store chains. In 2024, we observed a higher share of visits after 3 PM compared to 2019, with the largest penetration shift coming between the hours of 6 PM to 8 PM. Consumers are visiting liquor stores more frequently after working hours than before the pandemic, which underscores the shifting role of alcohol in people’s lives. Our data also indicated a higher distribution of visits during weekdays in 2024 compared to 2019, but a lower share of weekend visits.
Liquor store visit frequency contextualizes the changes that we’ve observed in consumption habits, highlighting that, despite the increased interest in moderating drinking habits, the pandemic did fundamentally shift how people engage with the category and alcohol retail has become more of a presence in consumers’ weekly routines.
Adapting to Shifting Consumer Preferences
As the cultural perception of alcohol shifts, changes are likely to occur across the industry. We’ve observed more liquor brands opening bars and drinking establishments to engage directly with consumers, while there’s also still a continued rise in local and regional brands popping up. Another area that has been growing steadily over the past few years is non-alcoholic beverages. The aisles of grocery stores and liquor stores are now filled with non-alcoholic alternatives of brand names, as well as mocktail entrants into wildly popular canned cocktails. Beyond that, there’s also been an increase in the number of non-alcoholic bottle shops, and the prevalence of non-alcoholic options will likely continue to grow and extend to other areas of the country outside of major cities. The Bev Alc industry is at a true crossroads with consumers, and consumer behavior will dictate how the industry must evolve to stay relevant.
The apparel space has faced considerable headwinds in recent years – from changing consumer preferences to cutbacks in discretionary spending. We dove into the data for various apparel categories to explore emerging industry trends and see what foot traffic patterns can tell us about the state of ap
Ezra Carmel
Mar 27, 2025
4 minutes
The apparel space has faced considerable headwinds in recent years – from changing consumer preferences to cutbacks in discretionary spending. We dove into the data for various apparel categories to explore emerging industry trends and see what foot traffic patterns can tell us about the state of apparel in 2025.
Off-Price and Thrift Gain Relative Visit Share
Consumers’ emphasis on value and the excitement of a constantly changing inventory have significantly impacted the apparel space in recent years – and off-price chains and thrift stores are reaping the benefits.
Between 2019 and 2024, off-price and thrift store chains claimed growing shares of the overall apparel visit pie. Off-price’s visit share jumped from 28.1% in 2019 to 35.1% in 2024, while thrift’s increased from 9.4% to 12.2%. And while this growth came at the expense of traditional department stores and general apparel chains, the relative visit share of our luxury segment remained relatively stable – likely due to its more affluent and less value-seeking clientele.
The activewear and athleisure segment, for its part, has followed a more nuanced path in recent years. The activewear and athleisure segment saw relative visit share growth during the pandemic (between 2019 and 2021), as home workout routines and comfortable clothing became the norm. But in 2022, the category began to revert to its pre-pandemic visit share, likely due to the return of in-person gatherings and return-to-office trends.
Substantive Gains for Off Price and Thrift
Analysis of yearly visits to various apparel categories provides further insight into their foot traffic trajectories.
Since 2021, off-price visits have steadily increased compared to 2019, while thrift store visits have consistently outperformed 2019 levels since 2022. This indicates that the off-price and thrift segments are experiencing absolute visit growth alongside increased relative visit share.
However, over the last four years, visits to traditional department stores and general apparel retailers have consistently underperformed 2019 baselines – while luxury retailers have seen visits decline even as they have maintained relative visit share stability. Meanwhile, following three years of visits above 2019 levels, activewear and athleisure visits have begun to decline, dipping below the 2019 benchmark in 2024.
Singles and Large Families Drive Success
Diving into the audience demographics in the apparel space reveals several trends behind the growth of the off-price and thrift segments.
In 2024, compared to the other apparel categories, off-price had the largest share of large households (3+ people) within its captured market* (42.1%), while thrift stores had the smallest share (39.0%). This could mean that off-price chains resonate with families seeking budget-friendly staples, whereas thrift stores appeal to singles hunting for unique items.
*A category’s captured market is derived by the census block groups (CBGs) from which retailers draw their visitors weighted by the share of visits from each, and thus reflects the population that visits the category.
Consumer Behavior By Apparel Category
Diving deeper into consumer behavior in the apparel space reveals additional visitation trends in the off-price and thrift categories.
Of the analyzed apparel categories, off-price had the longest average visit duration in 2024, followed closely by thrift. Though off-price and thrift formats share a treasure-hunting environment, off-price's higher proportion of larger households may contribute to longer dwell times, as visitors shop for multiple family members at once. Still, thrift store visitors, likely to come from small households, seem to spend significant time treasure-hunting for their own wardrobes. Activewear and athleisure, meanwhile, saw the shortest average dwell time – likely driven by customers who go into the stores knowing exactly what they want.
And of the apparel categories analyzed, thrift had the largest share of weekday visits (Monday - Friday) in 2024, perhaps since its visitors are more likely to be singles and young couples free of family commitments after work or retirees with weekday availability. Still, off-price also had a relatively elevated share of weekday visitors compared to most apparel categories, suggesting that visitors juggling family-driven schedules view off-price shopping as an errand rather than a recreational activity.
Apparel in a Nutshell
Consumer preferences for value and unique finds are reshaping the apparel retail landscape, driving substantial growth in the off-price and thrift segments. While traditional retail models face challenges, understanding these shifts in consumer behaviors and demographics is key to finding success in this dynamic environment.
For more data-driven retail insights, visit Placer.ai.
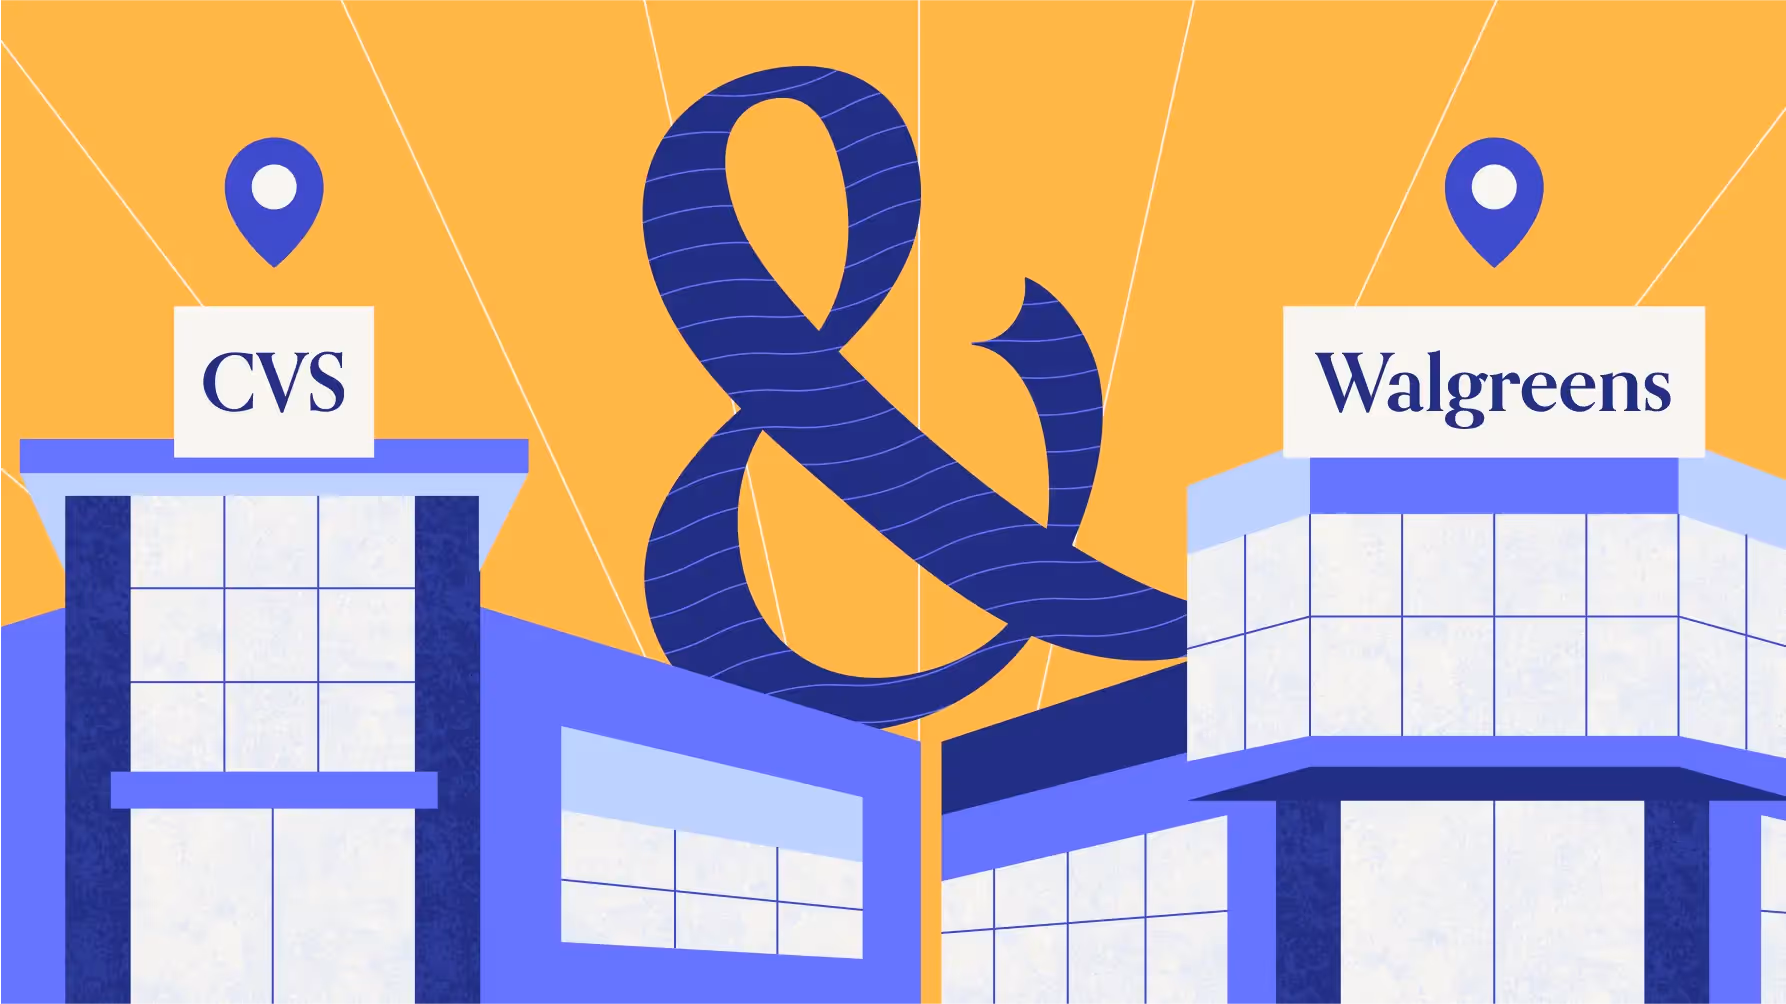
CVS and Walgreens, the two largest drugstore chains in the country, have faced increased competition in recent years. To adapt, both chains are optimizing their brick-and-mortar footprints. We took a look at the two chains’ visit performance to see what lies ahead for each.
Bracha Arnold
Mar 26, 2025
4 minutes
CVS and Walgreens, the two largest drugstore chains in the country, have faced increased competition from superstores and online platforms in recent years. To adapt, both chains are optimizing their brick-and-mortar footprints – and Walgreens is going private following its recent acquisition by Sycamore Partners.
We took a look at the two chains’ visit performance to see what lies ahead for each.
Pharmacies Rightsizing Right
CVS and Walgreens command a major portion of drugstore visits nationwide – and their foot traffic data sheds light on how each is weathering heightened competition. CVS, which consolidated its fleet between 2022 and 2024, saw both overall visits (+0.6%) and average visits per location (+2.9%) elevated YoY in Q4 2024, suggesting that these store closures have helped bolster the chain.
Walgreens, which also closed a significant number of stores over the past two years, saw overall foot traffic lag slightly throughout 2024. However, average visits per location to the chain were up in all but one quarter of the year, suggesting that Walgreen’s rightsizing moves are having a positive impact on the chain, directing more traffic to higher-performing locations.
Visits in the New Year
These patterns held into 2025, with CVS enjoying elevated YoY visits in all weeks analyzed, while Walgreens visits remained, for the most part, slightly below 2024 levels. Walgreens recently announced a definitive agreement to be acquired by private equity firm Sycamore Partners, and while the impact of this deal remains to be seen, it could create opportunities for innovation and strategic transformation.
Gaining Visit Share
CVS and Walgreens are major players in the pharmacy space, controlling the lion’s share of offline pharmacy visits (excluding general and grocery retailers with on-site pharmacies such as Walmart and Kroger.) And even as the two chains have reduced their footprints, their overall market presence has expanded – perhaps a reflection of the broader challenges facing smaller pharmacy operators.
Between Q1 2023 and Q4 2024, the share of visits to drugstore and pharmacy retailers attributed to CVS increased from 41.9% to 44.0%, while Walgreens’ share grew modestly from 49.2% to 50.4%. Meanwhile, the share of visits to smaller chains declined from 8.9% to 5.5%. This indicates that CVS’s growing visit share has not come at the expense of Walgreens – underscoring both chains’ resilience and growth potential in the face of sector-wide headwinds.
Changes for CVS
CVS closed hundreds of stores between 2022 and 2024 as it sought to refine its retail strategy – and now, the drugstore seems to be ready for its next move. The chain announced the rollout of about a dozen small-format stores, set to open throughout 2025. These stores will stock more of the essentials – cold medicine, first-aid care – and offer pharmacy services, while eschewing some of the traditional drugstore offerings like greeting cards and groceries.
And exploring CBSA-level visitation patterns at CVS suggests that this move may indeed be giving consumers what they want – especially in certain areas of the country. In 2024, short visits to CVS (i.e. those lasting less than ten minutes) increased YoY in many CBSAs nationwide, but some regions, like the Northeast, experienced stronger short visit growth than others. As CVS plans out its small-format expansion, focusing on regions with strong interest in short visits – where consumers may be particularly interested in an efficient shopping experience at a scaled-down location – could help it capture even more market share while improving customer convenience.
Prescription for Growth
CVS and Walgreens have faced their fair share of challenges in recent years, but both are adapting to stay competitive. New leadership and store formats may help them better serve customers and navigate the shifting retail pharmacy market.
Will the segment continue to adapt to a changing retail environment? Visit Placer.ai to find out.
Target is building out its baby and toddler assortment - find out what the data says about that decision.
Shira Petrack
Mar 25, 2025
1 minute
Recently, Target announced plans to add around 2,000 items to its baby and toddler assortment, with the goal of "supporting families throughout the parenting journey with products that bring joy and convenience to their everyday lives.”
The data suggests that Target shoppers are likely to react positively to this expanded baby assortment: Layering Placer.ai's trade area data with Spatial.ai's psychographic segmentation shows that Target's trade area is over-indexed for a range of family-oriented consumer segments, and affluent families in particular account for a significant share of Target's captured market. An expanded baby assortment is therefore likely to appeal to much of Target’s visitor base.
In a period marked by ongoing inflation and rising grocery prices, two chains – Trader Joe’s and Aldi – continue to thrive. We took a closer look at the two chains’ data to see what is driving their continued success.
Bracha Arnold
Mar 25, 2025
4 minutes
In a period marked by ongoing inflation and rising grocery prices, two chains – Trader Joe’s and Aldi – continue to thrive. We took a closer look at the two chains’ data to see what is driving their continued success.
Gains at the Grocery
Trader Joe’s and Aldi continue to be growth leaders in the grocery space. Both focus on selling a more limited selection of products and are known for providing quality at more budget-friendly prices. Both have also been in expansion mode, opening new stores and strengthening their market presence.
In 2024, Trader Joe’s visits increased by 6.2% compared to 2023, while Aldi saw an even more significant traffic rise of 18.2%. And while store expansion certainly contributed to this growth, average visits per location also trended upward, indicating strong demand across the two chains’ existing store networks. Trader Joe’s, which added about 35 stores in 2024, saw visits per location rise by 3.2%. Aldi, which added over 100 new locations in 2024, experienced a 13.5% increase in visits per location.
Weekly Visit Growth Continues into 2025
These strong foot traffic trends have continued into 2025, with weekly visits maintaining 2024’s momentum. Visits and visits per location were consistently elevated, an impressive feat given 2024’s already strong visit metrics.
As both chains continue to expand – Trader Joe’s has announced dozens of new openings in 2025, and Aldi has hundreds in the pipeline – the chains are well positioned for an even stronger 2025.
Income Levels Vary
Trader Joe’s and Aldi offer a similar shopping experience – limited assortment, smaller store sizes, and a focus on budget-friendly offerings – but in practice, the two chains attract different audiences. In 2024, the median household income (HHI) in Trader Joe’s captured market trade area was $110.1K, significantly higher than Aldi’s $75.7K and the national median for grocery shoppers ($82.0K).
Weekend Visits Reign Supreme
And while the two grocers attract shoppers from different sides of the income spectrum, analyzing consumer behavior at Aldi and Trader Joe’s reveals commonalities that may be driving some of their success.
Both Trader Joe’s and Aldi received a larger share of weekend visitors (35.0% and 34.4%, respectively) than the grocery nationwide average (32.1%). This suggests that, despite both chains’ limited assortment, consumers view Trader Joe’s and Aldi as weekend stock-up destinations – taking advantage of their days off to enjoy a more leisurely shopping experience at these value-driven retailers.
A Shift to Primary Grocery Shopping
The relatively high share of weekend visits is consistent with another emerging trend at the two grocers that suggests Trader Joe’s and Aldi are increasingly becoming primary grocery destinations.
Between 2023 and 2024, both Aldi and Trader Joe’s saw a decrease in the share of visitors that visited another grocery chain immediately before or after their Aldi or Trader Joe’s trip. This shift may be a result of an increasingly budget-conscious shopper, and suggests that visitors are choosing Aldi and Trader Joe’s as a main shopping destination rather than supplementing trips to larger chains.
This marks a promising shift for Trader Joe’s and Aldi as they continue expanding their footprints. By commanding a bigger slice of the grocery pie, both chains are solidifying their positions as go-to destinations for full grocery hauls.
Strength into 2025
Trader Joe’s and Aldi seem well-positioned as 2025 gets underway, with both driving continued foot traffic growth and becoming more of a primary destination for their shoppers.
As both stores expand their footprint, will these trends hold?
Discover how mall anchors are transforming in 2025 – and how a foot-traffic-focused approach to choosing key tenants can drive visits and shopper engagement.
May 29, 2025
8 minutes
Key Takeaways
1. Experiential and niche retailers can deliver anchor-level traffic. At Towne East Square Mall, the addition of a Scheels in 2023 significantly increased foot traffic and long-distance travelers, while Barnes & Noble at Coronado Center in Albuquerque has become a key driver of both foot traffic and higher-spend demographics.
2. Size isn’t everything – especially for dining venues. At Glendale Galleria and Northridge Fashion Center, smaller restaurants attracted more foot traffic than some traditional anchors.
3. Refocusing on tenants’ actual traffic contributions enables a flexible anchor approach. Balancing weekend draws like Scheels with weekday favorites such as Costco or Chick-fil-A can help maintain steady visitor flow throughout the week. Similarly, onsite fitness clubs can shift traffic to earlier in the day – an opportunity to adjust store hours and capture additional morning shoppers.
4. Temporary pop-ups can form an integral part of a visit-focused anchor strategy. The Barbie Dreamhouse Living Truck Tour generates mall visit spikes well above typical Saturday levels. Operators can integrate these events into their overall anchor strategies, offering preferential terms to high-performing pop-ups.
5. New tenants can boost traffic for existing stores in similar categories. After Aldi joined Green Acres Commons in February 2020, visits to an existing BJ’s Wholesale Club trended upwards. This synergy highlights how overlapping audiences can become a strength, creating a larger overall customer base.
The Retail Comeback Kid
Malls, it seems, are cool once again. After languishing in the wake of the pandemic, shopping centers across the country are thriving – reinventing themselves as prime “third places” where people can hang out, shop, and grab a bite to eat.
One key driver behind this resurgence is a shift in how malls view their anchor tenants. While traditional mainstays like Macy’s and JCPenney still play an important role, specialized offerings – from popular eateries to fitness centers and immersive retailtainment destinations – are increasingly taking center stage. These attractions maximize the experiential value that brick-and-mortar venues can deliver, driving visits and sales for the center as a whole.
Against this backdrop, this report leverages the latest location intelligence data to explore the types of tenants that can function as mall anchors in 2025. Should mall operators still focus on general merchandisers to draw crowds, or can dining chains and more niche retailers also do the job? How important is square footage in identifying the anchor-like tenants in a shopping center? And how can a visit-focused approach help mall operators select effective anchor or anchor-like tenants – whether to fill big-box spaces or to leverage the leasing perks traditionally reserved for major large-format chains?
Out-of-the-(Big)-Box Visit Drivers
One of the most important functions of a mall anchor is to ensure steady visitation – providing its smaller tenants with a constant flow of potential customers. And as the role of the mall continues to evolve, analyzing the actual foot traffic impacts of different types of businesses can help identify the kinds of non-traditional anchors best suited to fulfill that purpose.
The Power of a Well-Placed Scheels
Experiential venues, for example, are particularly well-poised to serve as powerful anchors in today’s retail environment – as illustrated by the visit surge experienced by Towne East Square Mall in Wichita, KS following the addition of a Scheels in July 2023.
By blending traditional retail with immersive experiences, Scheels has emerged as a true experiential destination. And this pull has also helped the mall draw more long-distance visitors willing to travel to enjoy Scheels’ offerings. In 2024, 41.9% of the mall’s customers traveled more than 50 miles to visit, compared to 35.8% back in 2018 when Sears occupied the same lot.
Scheels Anchor Brings Substantial Visit Boost to Towne East Square Mall in Wichita, KS, Attracting Visitors From Further Away
Visits to Towne East Square Mall Compared to Q1 2018 Baseline
Share of Visitors From 50+ Miles Away
Share
Embed:
The Barnes & Noble Effect
Traditionally, anchors aimed to please the widest possible audiences – with department stores, big-box chains, and grocery stores leading the way. But visitation data shows that niche concepts can also deliver anchor-level traffic if they’re compelling enough to attract dedicated fans.
The experience of the Barnes & Noble at Coronado Center in Albuquerque, NM is a case in point. After being written off as all but obsolete, Barnes & Noble has staged an impressive comeback in recent years, finding success through a more curated, localized approach to book selling. And despite not being a formal anchor, the Coronado Center Barnes & Noble accounted for 7.9% of visits to the mall in 2024 – outperforming both Macy’s and JCPenney.
Year-over-year data also shows foot traffic surging at the Coronado Center Barnes & Noble, lifting overall visitation to the mall. And demographic data reveals that the bookstore draws a more affluent audience than either the center as a whole or the two department stores – attracting a crowd with more spending power.
This example also illustrates how smaller tenants can sometimes draw larger crowds. Even though Barnes & Noble occupies a smaller onsite space than either Macy’s or JCPenney, it is proving a powerful visit driver out of proportion to its physical size.
Dining Chains Punching Above Their Size
Dining chains are also adept at punching above their square footage – often attracting crowds disproportionate to their size.
Despite its relatively small footprint, for example, the In-N-Out Burger at Glendale Galleria drew an impressive 8.6% of visits to the mall complex in 2024, outpacing some of the mall’s official anchors like DICK’s Sporting Goods, Macy’s, and JCPenney. Still, the onsite Target drew even larger crowds at 14.4% of visits.
A similar pattern emerged at Northridge Fashion Center, where Porto’s Bakery and Cafe captured a notable 15.6% of visits to the complex in 2024 – more than some of the center’s traditional department stores.
These examples underscore the potential for dining chains, which typically require less space, to serve as micro-anchors by consistently attracting outsized crowds – a key consideration for mall operators looking to sustain visitor traffic.
Choosing a Mall Anchor in 2025
Refocusing on tenants’ actual foot traffic contributions also opens the door to a more flexible and dynamic approach to anchor selection and management – one that considers each venue’s unique visitation patterns.
The Weekend/Weekday Divide
Seasonal factors, for example, can make certain anchors more powerful at specific times of the year, while different venues shine on particular days of the week.
At Jordan Creek Town Center in West Des Moines, Iowa, for instance, Scheels and Costco each delivered just under 20.0% of the complex’s overall visits in 2024. But the two retailers’ daily patterns differed significantly: Scheels saw bigger crowds on weekends, while Costco was the primary weekday destination.
Understanding differences like these can help operators optimize their tenant mix to maintain a balanced flow of shoppers throughout the week.
Another example of the impact of differing weekday traffic patterns is offered by the impact of mall-based Chick-fil-A locations on the distribution of mall visits throughout the week.
Despite its relatively small size, Chick-fil-A draws substantial traffic to malls. And after adding Chick-fil-A locations, both Northridge and Miller Hill Malls saw meaningful drops in the share of visits to the centers taking place on Sundays – even as the wider indoor mall segment saw slight upticks.
Recognizing this trend could prompt mall operators to compensate by adding more weekend-friendly traffic drivers – or to lean into this distinction by taking additional steps to bolster the mall’s role as a go-to weekday destination.
The Early-Morning Fitness Advantage
The power of different mall traffic magnets also varies throughout the day. Increasingly, shopping centers are turning to fitness centers as experiential anchors. And since many people work out early in the morning, these gyms are having a significant impact on the distribution of mall visits across dayparts.
The addition of gyms to Northshore Mall in Peabody, MA and Jackson Crossing in Jackson, MI, for instance, led to a significant rise in visits between 7:00 AM and noon. And though the rest of the stores in these malls typically open at 10:00 or 11:00 AM, this shift presents the centers with a significant opportunity.
By adjusting opening hours to accommodate these early-morning patrons, malls can capitalize on this added traffic, driving up visits and sales for relevant tenants – especially health-focused retailers such as juice bars and sporting goods stores.
Adding Temporary Pop-Ups Into the Mix
Adopting a broader, visit-focused view of anchoring also allows mall operators to apply some of the strategies typically reserved for anchors to non-conventional traffic-generating businesses, to ensure a consistent flow of traffic year-round.
Pop-up stores and events, for example, generally don’t follow the same seasonal trends as other retailers – instead, they generate short-term visit boosts during their runs, whenever in the year that may be. And a visit-focused anchor strategy can leverage some of the perks traditionally reserved for anchor tenants – such as preferential leasing terms – to complement traditional full-time anchors during slower retail periods.
The Barbie Dreamhouse Living Truck Tour is a prime example of a traffic-driving pop-up. By bringing exclusive merchandise to malls across the U.S., the truck generates plenty of buzz, drawing crowds eager to snatch up limited-edition items and immerse themselves in all things Barbie. As a result, malls hosting the tour often see significant visit spikes, with foot traffic surging well above typical Saturday levels. Well-timed pop-ups like these can help balance out traffic throughout the year, offsetting traditional slow periods.
Creating a Bigger Visit Pie
A visit-focused approach to anchor management can also help mall operators assess the potential impact of new tenants on existing stores operating in similar categories. For example, mall owners often worry that new tenants operating in similar categories might cannibalize existing businesses. But a visit-focused anchor approach reveals that a well-chosen addition can sometimes benefit current tenants – especially if they cater to similar audiences.
In February 2020, for instance, value supermarket Aldi opened at Green Acres Commons in Valley Stream, NY – a center that already hosted budget-friendly BJ’s Wholesale Club. While BJ’s visits were relatively flat in 2018 and 2019, they began to rise after Aldi’s opening (and following a pandemic-induced dip). Cross-shopping data also shows that Aldi customers were more likely to visit BJ’s than the average Green Acres patron last year.
This synergy may be due in part to the two retailers’ similar visitor bases: In 2024, the Aldi and BJ’s stores in Green Acres Common drew shoppers with comparable economic profiles. This suggests that overlapping audiences can become a strength if aligned brands attract new shoppers, who then explore multiple stores in the same center.
Visits to BJ's Wholesale Club Took Off After Addition of Aldi to Green Acres Commons – Perhaps Buoyed by Audience Similarity
Visits to Green Acres Commons BJ's Wholesale Club, Compared to Q1 2018 Baseline
Median HHI, 2024*
Cross-Shopping, 2024
*Median HHI based on STI: PopStats dataset combined with Placer.ai data for captured trade areas.
Looking ahead, effective mall anchors will be defined less by physical footprint and more by their capacity to maintain consistent, valuable foot traffic. While traditional department stores remain pivotal, smaller or niche brands can often rival – or surpass – large-format retailers. And by thinking out of the anchor box and choosing tenants that cultivate a balanced visitor flow and align with local preferences, operators can position their centers as true go-to destinations.
Dive into the data to see the trends shaping the grocery space in 2025 and uncover actionable insights for strategic decision-making in the competitive food-at-home market.
May 15, 2025
8 minutes
Key Takeaways:
1. Shoppers are taking more, shorter trips to grocery stores.Over the past 12 months, grocery stores have experienced nearly uniform YoY visit growth. And since COVID, the segment has steadily increased both overall visits and average visits per location – even as average dwell times have consistently declined.
2. Grocery stores are holding ground against fierce competition. Despite growing inroads by discount and dollar stores, wholesale clubs, and general mass retailers like Walmart and Target, grocery stores have maintained their share of the overall food-at-home visit pie over the past several years.
3. Grocery visit share is most pronounced on the coasts. In Q1 2025, grocery stores claimed the majority of food-at-home visits on the West Coast, in parts of the Northeast, Mid-Atlantic, and Mountain Regions, and in Florida and Michigan.
4. Fresh-format, value, and ethnic grocery visit shares are growing at the expense of traditional chains. And in Q1 2025, fresh-format and value grocers outperformed the other sub-segments with positive YoY visit and average visit-per-location growth.
5. Hispanic markets are on the rise. Though the broader ethnic grocery sub-segment was essentially flat YoY in Q1 2025, Hispanic-focused stores recorded increases in both visits and visits per location – and have been steadily growing visits since 2021.
6. Smaller formats for the win. In Q1 2025, smaller-format grocery store locations outpaced mid-sized and larger-format ones, underscoring the power of compact spaces to deliver significant foot traffic gains.
A Study in Resilience
Brick-and-mortar grocery stores face an uncertain market in 2025. Rising food-at-home prices (eggs, anyone?), declining consumer confidence, and increased competition from discounters, superstores, and online shopping channels all present the segment with significant headwinds. Yet even in the face of these challenges, the sector has demonstrated remarkable resilience – growing its foot traffic and holding onto visit share.
What strategies have helped the segment navigate today’s tough market? And how can industry stakeholders make the most of the opportunities in the current market? This report draws on the latest location intelligence to uncover the trends shaping grocery retail in early 2025 – highlighting insights to help key players make informed, data-driven decisions on store formats, product offerings, and more.
Growth in Aisle One
The grocery segment has experienced nearly uniform positive year-over-year (YoY) growth over the last 12 months. This sustained performance in the face of inflation and other headwinds highlights the underlying strength of the category.
Visits Up, Dwell Time Down
What is driving this growth? Since 2022, the grocery segment has seen consistent overall visit growth that has outpaced increases in visits per location – a sign that chain expansion has played a key role in the category’s success. But the average number of visits to each grocery store has also been on the rise, indicating that the segment continues to expand without cannibalizing existing store traffic.
At the same time, visitor dwell times have been steadily dropping since 2021. This shift appears to reflect a trend towards multiple, shorter trips by inflation-wary consumers eager to avoid large, costly carts or cherry pick deals across various retailers. Many shoppers may also be placing more bulk orders online and supplementing those deliveries with brief in-store stops for additional items as needed.
The bottom line: Shoppers are taking more grocery trips overall each year, but spending less time in-store during each visit. Operators can respond to this trend by optimizing layouts and promoting “grab-and-go” areas for an even more efficient quick-trip experience.
Still in Stock
Visit share data also shows that despite fierce competition from discount and dollar stores, wholesalers, and general mass retailers, the grocery segment has steadfastly preserved its share of the overall food-at-home visit pie.
Between Q1 2019 and Q1 2025, wholesale clubs and discount and dollar stores increased their share of total food-at-home visits, gains that have come primarily at the expense of Walmart and Target. Meanwhile, grocery outlets have held firm – despite some fluctuations over the years, their Q1 2019 visit share remained essentially unchanged in Q1 2025.
So even as consumers flock to alternative food purveyors in search of lower prices, grocery stores aren’t losing ground – and on a nationwide level, they remain the biggest player by far in the food-at-home shopping space.
A Coastal Advantage
Still, grocery store visit share varies significantly by region. On the West Coast, in parts of the Northeast, Mid-Atlantic, and Mountain regions, and in Florida and Michigan, grocery stores accounted for the majority of food-at-home visits in Q1 2025. Oregon (61.6%) and Washington (59.6%) led the pack, followed by Massachusetts (59.2%), Vermont (58.5%), and California (57.9%). Meanwhile, in West Virginia, Arkansas, South Dakota, Oklahoma, North Dakota, and Mississippi, less than 30% of food-at-home traffic went to grocery stores, with more shoppers in these regions turning to general mass retailers or discounters.
Grocery store operators in lower-grocery-share regions may choose to focus on price competitiveness and convenient store locations to capture more foot traffic from competitors in the space.
Fresh and Frugal on the Rise
Which types of grocery stores are thriving the most? The grocery segment is diverse, encompassing traditional grocery chains like Kroger, Safeway, and H-E-B; budget-oriented value chains such as Aldi, WinCo Foods, Grocery Outlet Bargain Market, and Market Basket; fresh-format specialty brands like Trader Joe’s, Whole Foods, and Sprouts Farmers Market; and numerous ethnic grocers.
Examining shifts in visit share among these various grocery store segments shows that traditional grocery still dominates, commanding over 70.0% of total grocery store foot traffic.
Still, over the past several years, traditional grocers have gradually ceded ground to other segments – especially value chains. Budget grocers saw a temporary surge in visits during the panic-buying days of early 2020 – and have been more gradually gaining visit share since Q1 2023. . Fresh-format banners, which lost ground in 2021 after a Q1 2020 bump, in the wake of COVID, have also been on the upswing and appear poised to capture additional visit share in the coming months and years. And though ethnic grocers still account for a relatively small portion of the overall market, they have slightly increased their visit share, reflecting heightened consumer interest in these specialized offerings.
The Discount and Premium Edge
Recent performance metrics point to a bifurcation in the grocery market similar to that observed in other retail categories. In Q1 2025, fresh-format and value retailers – which appeal, respectively, to the most and least affluent visitor bases – saw the greatest growth in both overall visits and average visits per location.
This trend highlights the power of both value and health-focused quality to motivate consumers in 2025. And grocery players that can meet these needs will be well-positioned for success in the months ahead.
WFH Fresh-Format Lunch Crunch
One factor fueling fresh-format’s success may be its role as a convenient, relatively affordable midday lunch destination for the remote work crowd.
In Q1 2025, consumers working from home accounted for 20.2% of fresh-format grocery stores’ captured market – a significantly higher share than any other analyzed grocery segment. These stores also tended to be busier midday than the other segments. Remote workers may be stopping by to grab a quick bite – and some may be choosing to do their grocery shopping during their lunch break when stores are less crowded.
This finding suggests an opportunity for grocery operators across all segments to develop or enhance in-store salad bars and quick-serve sections to tap into the lunch rush. Likewise, CPG companies may benefit from developing more ready-made, nutritious meal options that align with these midday dining habits.
Salsa Surge
Though the broader ethnic grocery category remained essentially flat in Q1 2025, Hispanic-focused grocers emerged as a sub-segment to watch. Both overall visits and average visits per location to these stores have been on the rise since 2021.
This robust demand presents an opportunity for CPG brands and grocers across segments to expand Hispanic-focused offerings, capturing a slice of this growing market.
Less is More
Finally, store size matters more than ever in 2025. During the first quarter of the year, smaller format grocery store locations (locations under 30K square feet, across different chains) outpaced larger stores with a 3.2% YoY jump in visits, showing that bigger isn’t always better in the grocery store space.
This pattern aligns with the decrease in dwell times noted above – shoppers may be making shorter trips to smaller, more convenient grocery store locations. These quick errands are ideal for picking up a few items to supplement online orders, shopping multiple deals, or sourcing specialty products unavailable at larger grocery destinations. And to lean into this trend, grocery operators might consider testing neighborhood “micro-store” concepts, focusing on curated selections, and offering convenient parking or pickup to match consumer preferences for targeted purchases and quicker trips.
Final Thoughts
Location intelligence reveals a growing, dynamic grocery landscape which is holding its ground in the face of increased competition. Shorter trips, busier lifestyles, and changing work routines are reshaping in-store experiences. And grocery players that refine their store formats, target both lunch and on-the-go shoppers, and adapt to shifting demographics can position themselves to thrive in this competitive sector. As the market continues to evolve, continuous attention to these changing patterns will be key to maintaining and expanding market share.
Dive into the data to explore recent visitation patterns and consumer trends in the fitness space - and uncover potential keys to success, rooted in location intelligence.
May 5, 2025
8 minutes
Key Takeaways
1. Elevated visitor frequency could mean that gym-goers are getting more value out of their memberships and are therefore more likely to stay signed up. Between January and March 2025, all of the gym chains analyzed had a higher share of frequent visitors (those who visited about once a week) than in the equivalent month of 2024.
2. Fitness chains at all price tiers need to be strategic about the value they offer and the amenities that can engage budget-conscious consumers. Between Q1 2022 and Q1 2025, the captured trade area median HHI increased for all fitness subsegments – value-priced, mid-range, and high-end – suggesting that consumers swapped pricier gym memberships for more affordable options.
3. Close attention should be paid to how long visitors spend at fitness chains in order to reduce crowding and bottlenecks. Between Q1 2022 and Q1 2025, the average visit length increased at value-priced, mid-range, and high-end gyms. Floorplan and equipment improvements could be considered, as well as having trainers available to help gym-goers streamline workouts.
4. Gyms can use hourly visit data to better serve their members or use promotions to stabilize facility usage throughout the day. In Q1 2025, high-end chains received a larger share of morning visits while value-priced and mid-range fitness chains received larger shares of evening visits.
Fitness Flexes Its Muscles
Like many industries in recent years, the fitness sector has experienced significant shifts in consumer behavior. From the rise in home workouts during the pandemic to the strain of hyper-inflation, foot traffic trends to gyms and health clubs have been as dynamic as the consumers they serve.
This report leverages location analytics to explore the consumer trends driving visitation in the fitness space and provides actionable insights for industry stakeholders.
Back in Shape: The COVID Recovery
The pandemic drove several shifts in the fitness space. Widespread gym closures led consumers to embrace home-based workouts, while demand for all things fitness increased due to an emphasis on overall health and wellness. This subsequently drove a renewed interest in gym-based workouts as restrictions lifted – even as some consumers remained committed to their home workout routines.
In Q1 2023, visits to fitness chains surpassed Q1 2019 levels for the first time since the onset of the pandemic, a sign that consumers had recommitted to out-of-home fitness. And in Q1 2024 and Q1 2025, fitness chains saw further growth, climbing to 12.8% and 15.5% above the Q1 2019 baseline, respectively.
Several factors have likely driven consumers’ return to gyms and health clubs, including the desire for both social connection and professional-grade facilities difficult to replicate at home. The steep increase in cost of living has likely also played a role, since consumers cutting back on discretionary spending can enjoy multiple outings and a range of recreational activities at the gym for one monthly fee.
Getting Gains: Strong Q1 ‘25
Zooming in on weekly visits to the fitness space in Q1 2025 reveals the industry’s exceptional strength and resilience in the early part of the year.
The fitness industry experienced YoY visit growth nearly every week of Q1 2025 (and 2.4% YoY visit growth overall) with only minor visit gaps the weeks of January 20th, 2025 and February 17th, 2025 – likely due to extreme weather that prevented many Americans from hitting the gym.
And the fitness industry’s weekly visit growth appeared to strengthen throughout the quarter, defying the typical waning of New Year's resolutions. This could indicate that gym visits haven't plateaued and that consumers are demonstrating greater commitment to their fitness routines compared to last year.
Increasing Reps: Visitor Frequency Up At Leading Chains
Diving into visitation patterns for leading fitness chains highlights how increased visitor frequency drove foot traffic growth in Q1 2025.
Fitness chains tend to receive the most visits during the first months of the year as consumers recommit to health and wellness in their post-holidays New Year’s resolutions. And not only do more people hit the gym – analyzing the data reveals that gym-goers also typically work out more frequently during this period. Zooming in on 2025 so far suggests that consumers are especially committed to their fitness routines this year: Leading gyms saw an increase in the proportion of frequent visitors (4+ times a month) in Q1 2025 compared to the already significant percentage of frequent visitors in the first quarter of 2024.
Elevated visitor frequency could mean that gym-goers are getting more value out of their memberships than last year, and are therefore more likely to stay signed up throughout the year.
At the same time, the data also reveals that – contrary to what may be expected – a fitness chain’s share of frequent visitors appears to be independent of the cost of membership associated with the club: Life Time, a high-end club, and EōS Fitness, a value-priced gym, had the highest shares of frequent visitors between January 2024 and March 2025. This suggests that factors other than cost, such as location convenience, class offerings, community, or individual motivation, might be more influential in driving frequent gym attendance.
Fitness Clubs at Different Price Points
Segmenting the fitness industry by membership price tiers – value-priced, mid-range, and high-end – can reveal further insights on current consumer behavior around out-of-home fitness.
Household Income Bulks Up
In Q1 2025, the captured market* median household income (HHI) was higher than the nationwide median HHI ($79.6K/year) across all price tiers – suggesting that even value-priced fitness chains are attracting a relatively affluent audience. This could indicate that gym memberships are somewhat of a luxury and that consumers from lower-income households gave up their gym memberships altogether as they tightened their purse strings.
Analyzing the historical data since Q1 2022 also reveals that the captured market median HHI has risen consistently over the past couple of years with the largest median HHI increase observed in the captured trade areas of high-end fitness chains. This suggests that middle-income households – that are more sensitive to the rising cost of living – likely swapped pricier gym memberships for more affordable options in recent years.
These metrics indicate that fitness chains at all price tiers need to think strategically about the value they offer and the amenities that can engage budget-conscious consumers who are carefully weighing every expenditure.
*Captured trade area is obtained by weighting the census block groups (CBGs) from which the chain draws its visitors according to their share of visits to the chain and thus reflects the population that visits the chain in practice.
Average Stay Increases
Fitness clubs of all types need to manage their capacity to ensure health and safety standards and a positive experience for members. And understanding the average amount of time visitors spend at the gym can help fitness chains at every price point keep their finger on the pulse of their facilities.
Between Q1 2022 and Q1 2025, the average visit length increased at value-priced, mid-range, and high-end gyms. Value-priced gyms experienced the largest increase in average visit length – from 72.4 minutes in Q1 2022 to 74.0 minutes in Q1 2025 – perhaps due to their relatively lower-income visitors spending more time enjoying club amenities after cutting back on other forms of recreation. Meanwhile, mid-range and high-end gyms experienced relatively modest increases in average visit length, which were higher to begin with – likely due to their ample class and spa offerings and overall inviting, upscale spaces.
Elevated average visit length could mean that visitors are well-engaged and less likely to cancel their memberships. But as overall gym visits are on the rise, fitness chains may want to pay close attention to how long visitors spend at the facility. Floorplan and equipment improvements could be considered in order to reduce bottlenecks, and having trainers available to instruct on equipment usage and workout technique could help gym-goers streamline workouts.
Workouts on a Schedule
Along with average visit length, understanding the daypart in which they receive the most visits is another way that fitness chains can improve efficiency and prevent overcrowding. And analysis of the hourly visits to fitness sub-segments revealed that some fitness segments receive more morning visits while others are more popular in the evenings.
In Q1 2025, high-end chains received a larger share of visits between 6 a.m. and 9 a.m. (19.7%) than value-priced and mid-range fitness chains (11.6% and 11.8%, respectively). Meanwhile, value-priced and mid-range fitness chains received larger shares of visits between 6 p.m. and 9 p.m. (21.9% and 22.2%) than high-end chains (16.5%).
Gyms can leverage this data to better serve members, for instance by scheduling more classes during peak hours. Value-priced and mid-range gyms, which saw a larger disparity between shares of morning and evening visits in Q1 2025, might also consider incentivizing off-peak usage through discounted morning memberships or early-bird snack bar deals.
Fitness Continues to Grow
The fitness space appears to be in good shape in 2025. Visits have made a full recovery from the pandemic era and still continue to grow, indicating strong consumer demand for out-of-home workouts. And using location intelligence to analyze the behavior and demographics of visitors to gyms at different price points can help identify opportunities for driving even greater success.


.svg)