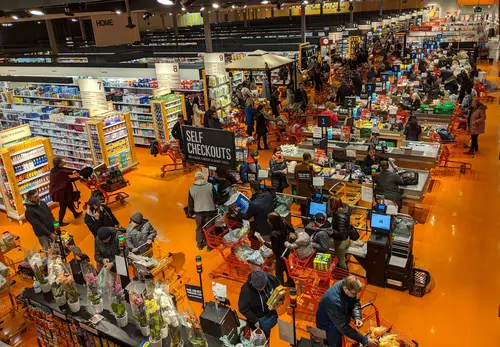
Albertsons Companies, Inc. commands a significant share of the U.S. grocery market through a wide range of grocery banners. We dove into recent customer traffic and engagement metrics to discover what’s changed for the company – and what’s stayed the same – over the past few years.
Bracha Arnold
Apr 11, 2025
4 minutes
Visits Slow Relative to 2023, But Still on Upward Trajectory
Traffic to Albertsons banners has increased steadily over the past couple of years, with visits still significantly higher (10.5%) than in pre-pandemic 2019. So while visits did dip slightly relative to 2023 (-1.1%) – likely due to stabilization following the robust growth of recent years – the minimal decline highlights Albertsons’ capacity to maintain strong foot traffic despite a challenging economic environment.
Albertsons Closes Visit Gap in 2025
Zooming into quarterly-level data also highlights Albertsons’ strength. After narrowing its year-over-year (YoY) visit gap from -2.5% in Q2 2024 to -0.9% in Q3 and Q4 2024, Q1 2025 visits are now level with Q1 2024 traffic – suggesting that Albertsons’ visits have indeed stabilized, with the company holding on the gains of the past couple of years.
Stable Visit Share Over The Years
The company’s resilience in the face of the growing competition from discount & dollar stores is likely contributing to Albertsons’ strength.
Inflation and high prices have had a major impact on grocery shopping behavior in recent years, with discount stores emerging as significant players in the grocery market. Indeed, between 2019 and 2024, the share of visits to the discount & dollar category out of total grocery and discount & dollar store visits increased from 23.4% to 25.5% – likely due to some shoppers favoring more affordable grocery channels over traditional supermarkets. Meanwhile, grocery’s relative visit share decreased, with traffic to the grocery category (excluding Albertsons banners) falling from 67.8% in 2019 to 66.0% in 2024. But Albertsons’ relative visit share remained largely stable during this period – suggesting that, even as budget-conscious consumers gravitate towards discount stores, Albertsons has managed to retain its customer base.
Shorter, Mission-Driven Visits
Albertsons, like other grocery stores, has seen an increase in short visits in recent years, leading to shorter average dwell time. Between 2019 and 2024, the average length of stay across Albertsons brands dropped from 22.7 minutes to 21.6 minutes.
The drop in visit duration may be partially attributed to the growing segment of consumers who prefer the convenience of picking up their groceries via lockers or curbside, or who are supplementing their online orders with quick trips in-store. And as Albertsons has invested in curbside pickup, delivery, and online shopping options across a number of its banners, the company is well positioned to meet the demand for flexibility and efficiency in the grocery space.
Albertsons Brands Stay the Course
Diving into some of Albertsons’ biggest brands reveals that visits to most banners stayed relatively close to 2023 levels, with YoY traffic trends ranging from -2.7% to +2.9%. While banners like Albertsons, Safeway, and VONS saw slightly fewer visits in 2024 compared to 2023, Jewel-Osco and Shaw's Supermarket enjoyed YoY visit growth.
Albertsons Keeps It Consistent
Albertsons is making the best of a challenging economic environment, keeping visits close to previous levels and maintaining its share of the grocery visit pie.
Will the grocery banner see visit growth into 2025? Visit Placer.ai for more up-to-date grocery retail insights.
Tariffs have the potential to impact everything from product pricing to in-store foot traffic. We took a look at how retail visits and consumer behavior shifted as tariffs were announced.
R.J. Hottovy
Apr 11, 2025
4 minutes
Consumer Behavior Amidst Tariff Uncertainty
While the U.S. government has currently partially paused its consideration of reciprocal tariffs on global imports, retailers are still bracing for the possibility of future enactment and potential ripple effects across the industry of the tariffs still in place. From rising supply chain costs to shifts in consumer behavior, tariffs have the potential to impact everything from product pricing to in-store foot traffic. And in an environment where consumers remain highly price-sensitive and economic uncertainty persists, understanding how tariffs could influence retail visitation is critical. While we won’t know the full impact until the tariffs are implemented and impacted retailers adjust, Placer.ai visitation data can help evaluate how the proposed tariffs may be shaping consumer patterns and what that might mean for retailers moving forward.
When new regulations like tariffs are introduced, they often create both short-term and long-term effects. In the short term, consumers remain highly price-sensitive following prolonged inflation in key areas such as food, rent, and healthcare. As a result, our visitation data suggests that some consumers acted early to avoid potential price increases tied to tariff implementation. While visit trends for the week of March 24–30, 2025 were also influenced by the timing of Easter in 2024 (which fell on March 31), Placer.ai data indicates a possible pull forward in demand during the weeks leading up to the expected implementation of the latest tariffs—particularly at “stock-up” retailers like warehouse clubs. In fact, warehouse clubs recorded their strongest year-over-year visitation week of 2025 on the week of March 24-30th, while superstores and grocery stores saw declines, likely due to comparisons to strong performance during the same Easter week in the previous year.
Pre-Tariff Traffic to Discretionary Categories
Looking at more discretionary retail categories, we also see evidence that consumers were trying to get ahead of tariff implementation. Our data indicates that retailers selling products sourced from countries potentially facing higher tariffs experienced stronger year-over-year visitation trends. The timing of Easter 2024 likely contributed to this boost as well—many of these retailers were closed or operating with reduced hours during that week last year. Categories such as home improvement, electronics, luxury department stores, apparel and accessories, and clothing all saw notable year-over-year visitation increases for the week of March 24–30, 2025, as shown below.
Tariff Resilience and Vulnerabilities
While many uncertainties remain around tariff implementation, consumers are likely to increasingly gravitate toward retailers that offer bulk purchasing, strong private label alternatives, and everyday low prices—areas where warehouse clubs and discount grocers with robust private label assortments excel. Similarly, national restaurant chains with streamlined operations, diversified global supply chains, and the ability to scale value-driven promotions will hold a competitive edge. Off-price retailers and thrift stores offering secondhand and resale items may also benefit, appealing to deal-seeking consumers. These types of retailers are often better positioned to absorb rising costs and maintain affordability, making them attractive options in an increasingly inflation-sensitive environment.
Consumer electronics, apparel, luxury goods, and beverage alcohol retailers may be disproportionately affected by potential tariffs due to their heavy reliance on imported products and limited pricing flexibility. Many electronics, luxury, and apparel items are sourced from countries subject to implemented or potential tariffs, which could significantly increase costs in categories already operating with tight margins. For beverage alcohol retailers, tariffs on imported wine, spirits, and specialty ingredients could lead to supply chain disruptions and higher prices, particularly for premium or niche products. In these segments, passing additional costs on to consumers may be challenging in an environment where shoppers remain highly price-sensitive, potentially resulting in decreased demand, inventory issues, and increased reliance on promotional strategies.
Leveraging Data to Navigate Tariff Impacts
As the U.S. moves closer to implementing new tariffs, retailers across categories must prepare for both immediate and long-term impacts. From early signs of stock-up behavior at warehouse clubs to shifting visitation patterns in discretionary categories like apparel and electronics, consumer response is already taking shape. While value-focused retailers and those with operational agility may be better positioned to weather the storm, others – particularly those reliant on imported goods – could face heightened challenges. In this evolving landscape, visitation data can help to assess consumer behavior in real time, helping retailers adapt strategies and remain competitive as the full effects of tariff policies unfold.
A Minecraft Movie shattered box office predictions with a $162.75 million opening, as eager fans – some tossing popcorn or yelling “chicken jockey” – flocked to theaters nationwide.
On the weekend of A Minecraft Movie’s release (Friday, April 4th to Sunday, April 6th), leading cinema chains AMC Theatres, Regal Cinemas, and Cinemark enjoyed a 92.6% visit boost compared to an average weekend during the past 12 months. Only Moana 2 and Deadpool & Wolverine drew bigger crowds.
And examining daily cinema visit fluctuations this year shows that visits to cinemas peaked on Saturday, April 5th, when foot traffic surged 336.7% above the year-to-date daily average.
Already dubbed “the gamer version” of 1960’s cult film The Rocky Horror Picture Show, A Minecraft Movie has become Warner Bros.’ third-biggest opening of all time. But how long will the film keep drawing crowds?
The Placer.ai Nationwide Office Building Index: The office building index analyzes foot traffic data from some 1,000 office buildings across the country. It only includes commercial office buildings, and commercial office buildings with retail offerings on the first floor (like an office building that might include a national coffee chain on the ground floor). It does NOT include government buildings or mixed-use buildings that are both residential and commercial.
RTO mandates seem to be everywhere. Following the federal government’s example, local governments from the City of Atlanta to the State of Texas have introduced stricter in-office requirements. And an increasing number of corporations are demanding full-time in-person work – including firms like JPMorgan, which began enforcing a five-day RTO mandate in early March.
But what does ground-level data tell us about how these new policies are affecting office attendance in practice? Did the RTO slowdown observed in January and February continue into March? Or is a new resurgence underway?
RTO Marches Ahead
The latest data from the Placer.ai Office Index suggests that nationwide office visits may be trending upwards once again. Although March 2025 office visit levels didn’t match the peaks of October and July 2024, visits last month were only 32.2% below March 2019 levels – an improvement over March 2024.
Significantly, among months with 21 or fewer working days, March 2025 ranked as the second-busiest in-office month since the pandemic, just slightly behind October 2023 (October and July 2024 both had 22 days). So while January and February’s decliningnumbers hinted at a stalled market, March’s uptick suggests that lower office attendance earlier in the year may have been due to temporary factors like weather – and that the RTO may still be gaining momentum.
New York Still in the Lead
Diving into the data for eleven major business hubs nationwide shows New York and Miami once again at the head of the office recovery pack. Visits to NYC office buildings in March 2025 were just 11.4% below pre-pandemic (March 2019) levels – while Miami trailed by 17.3%. Meanwhile, Atlanta (-29.3%), Washington, D.C. (-30.6%), Dallas (-30.7%), and Houston (-31.0%) all outperformed the nationwide average of -32.2%. San Francisco tied in last place with Chicago, with visits 44.6% below 2019 levels.
YoY Upticks (Nearly) Across the Board
Turning to year-over-year (YoY) data, ten of the eleven analyzed cities experienced YoY office visit growth – led by Boston, with a 10.2% uptick. Washington, D.C. also recorded strong YoY gains (9.8%) – while San Francisco continued its recent positive momentum with a 9.6% increase. Los Angeles was the only city to see a minor (-2.2%) YoY visit lag – perhaps lingering fallout from the wildfires earlier this year.
More Gains Ahead?
Overall, the Placer.ai Office Index points to a renewed upswing in RTO momentum, likely driven by increasingly strict mandates from governments and corporations. Though persistent post-pandemic office visit gaps point to the continued prevalence of hybrid work, March’s noticeable uptick suggests that offices may be poised to make further gains in the coming months.
With Q1 2025 just under our belts, we dove into the data to see how quick-service and fast-casual restaurants (QSRs) fared in the year’s early months. Which chains managed to weather the headwinds – both fiscal and meteorological – that have weighed on consumer traffic in recent months? And which brands emerged as top performers?
We dove into the data to find out.
Raising Cane’s and Taco Bell Lead QSR Space
QSRs faced a challenging environment in the first part of 2025, as harsh winter weather, economic uncertainty, and heightened value competition from fast-casual chains, full-service restaurants (Chili’s, anyone?), and even grocery stores drove visits down. Overall, QSR foot traffic declined by 1.6% year over year (YoY) in Q1, with much of the drop occurring in February – when a polar vortex and the comparison to a leap-year February 2024 led to a traffic dip. By March, however, visits began to stabilize, and the segment finished out the month with foot traffic levels essentially flat YoY (-0.3%).
Still, some QSRs stood out. Rapidly expanding Raising Cane’s Chicken Fingers, for example, saw YoY gains in both overall visits and average visits per location (12.3% and 3.7%, respectively). Known for quick, quality fare – the chain’s sauces have even inspired viral tik-tok videos – Raising Cane’s fleet growth is clearly meeting robust demand.
Taco Bell also emerged as a Q1 leader, with quarterly visits rising 3.7% YoY. The brand doubled down on value with its expanded selection of Luxe Cravings Boxes. And the tex-mex giant’s limited-time Crunchwrap Slider offering – launched in early 2025 to celebrate the 20th anniversary of the Crunchwrap Supreme – generated plenty of buzz.
Meanwhile, McDonald’s, which launched its new McValue menu in January 2025, narrowed its visit gap to 1.0% in March – an encouraging sign as the year gets into full swing.
Fast-Casual Brands Leading the Pack
Fast-casual fared somewhat better, ending Q1 2025 with flat YoY visits (+0.0%). And though the segment mirrored QSR’s monthly pattern of gains in January, a dip in February, and stabilization in March, several major players posted positive Q1 results – including Chipotle (+4.6%), Panda Express (+3.8%), Jersey Mike’s Subs (+3.1%) and Qdoba Mexican Grill (+1.5%). While fleet expansion contributed to some of these increases, menu innovation – particularly well-chosen chickenandshrimp-focused limited-time offerings – likely also played a role.
Smaller Fries Making Big Waves
In addition to these major chains, several smaller fast-casual brands enjoyed outsized visit performance in early 2025, driven by rapid expansion meeting strong demand. Dave’s Hot Chicken, capitalizing on consumers’ ongoing enthusiasm for chicken dishes, logged a remarkable 59.3% YoY visit surge in Q1 2025, and an 11.6% jump in average visits per location. Health-forward chains CAVA and sweetgreen also grew their footprints – and audiences – likely supported by the return-to-office trend and continued interest in wholesome, convenient dining options.
Looking Ahead
All told, QSR and fast-casual brands held their own in Q1 2025 – with some brands standing out through strategic value offerings, menu innovation, and expansion. How will QSRs and fast-casual chains continue to fare as 2025 wears on?
Follow Placer.ai’s data-driven dining analyses to find out.
About the Placer.ai Mall Index: The Placer.ai Mall Index analyzes data from 100 top-tier indoor malls, 100 open-air shopping centers (not including outlet malls) and 100 outlet malls across the country, in both urban and suburban areas. Placer.ai leverages a panel of tens of millions of devices and utilizes machine learning to make estimations for visits to locations across the country.
Mall Visits Rebound in March
Mall visits largely rebounded in March following their February drop. Traffic to indoor malls grew 1.8% year-over-year while open-air shopping centers and outlet malls saw their YoY visit gaps narrow to 1.1% and 0.7%, respectively. The rebound may be driven by the slight increase in consumer confidence among younger consumers (under 35 years old) and consumers from households earning over $125K a year – since affluent households are overrepresented in the trade areas of all three mall formats.
Indoor Malls Take the Lead
Indoor malls’ March YoY visit growth is the latest manifestation of the format’s strength. Between Q2 2023 and Q1 2024, open-air shopping centers led the shopping center space as this format consistently outperformed the other two mall types on a YoY visit basis. But over the past year, indoor malls have led the pack, with YoY visit trends to indoor malls consistently stronger than visitation metrics for the other two formats.
Some of the strength of indoor malls could be attributed to a sort of “survival of the fittest.” Many indoor malls shuttered in recent years, so the malls that remain in operation – such as the top-tier malls in the Placer.ai Indoor Mall Index – may be receiving some of the traffic that may have previously gone to less successful malls. Indoor malls are likely also benefiting from a renewed demand for the indoor mall experience – which could explain the string of recent investments in class B malls – from Walmart’spurchase of the Monroeville mall to Simon’s redevelopment of the Smith Haven Mall.
COVID’s Lingering Impact on Shopping Centers
March 2025 marked the five-year anniversary of the retail lockdowns. And although this past month marked an improvement in visitation trends on a YoY basis, zooming out in time reveals that the pandemic is still having a lingering impact on both the quantity and quality of mall visits across formats.
All three mall types received fewer, shorter visits in Q1 2025 compared to Q1 2019, with outlet malls seeing the largest drop in both visit numbers and visit duration. Open-air shopping centers experienced the strongest recovery in terms of visit numbers – Q1 2025 traffic was just 2.0% lower than in Q1 2019 – while visit duration fell 4.4%. Indoor malls saw the strongest rebound in visit duration, with Q1 2025 visits only 2.9% shorter than pre-pandemic – but visit numbers were down 7.4%. So despite the resilience of open-air shopping centers and the recent visit gains of indoor malls, the shopping center industry still has a ways to go before visitation patterns return to pre-COVID levels across the board.
As the industry looks beyond the five-year mark, the future of malls will likely depend on adaptability. Operators who can balance digital integration, experiential offerings, and responding to shifting consumer preferences will be best positioned to thrive in a post-COVID retail environment.
The Future of Malls
While the positive March visit data offers a degree of optimism for the mall industry, it's crucial to acknowledge that the sector is still navigating the long-term effects of the pandemic, characterized by fewer and shorter visits compared to pre-2020. At the same time, the recent success of indoor malls suggests a potential shift in consumer preferences or a concentration of traffic in stronger locations, highlighting the ongoing evolution of the retail landscape. Moving forward, the resilience and future success of malls will likely hinge on their ability to adapt to changing consumer behaviors and integrate innovative strategies that enhance the overall shopping experience.
Discover how mall anchors are transforming in 2025 – and how a foot-traffic-focused approach to choosing key tenants can drive visits and shopper engagement.
May 29, 2025
8 minutes
Key Takeaways
1. Experiential and niche retailers can deliver anchor-level traffic. At Towne East Square Mall, the addition of a Scheels in 2023 significantly increased foot traffic and long-distance travelers, while Barnes & Noble at Coronado Center in Albuquerque has become a key driver of both foot traffic and higher-spend demographics.
2. Size isn’t everything – especially for dining venues. At Glendale Galleria and Northridge Fashion Center, smaller restaurants attracted more foot traffic than some traditional anchors.
3. Refocusing on tenants’ actual traffic contributions enables a flexible anchor approach. Balancing weekend draws like Scheels with weekday favorites such as Costco or Chick-fil-A can help maintain steady visitor flow throughout the week. Similarly, onsite fitness clubs can shift traffic to earlier in the day – an opportunity to adjust store hours and capture additional morning shoppers.
4. Temporary pop-ups can form an integral part of a visit-focused anchor strategy. The Barbie Dreamhouse Living Truck Tour generates mall visit spikes well above typical Saturday levels. Operators can integrate these events into their overall anchor strategies, offering preferential terms to high-performing pop-ups.
5. New tenants can boost traffic for existing stores in similar categories. After Aldi joined Green Acres Commons in February 2020, visits to an existing BJ’s Wholesale Club trended upwards. This synergy highlights how overlapping audiences can become a strength, creating a larger overall customer base.
The Retail Comeback Kid
Malls, it seems, are cool once again. After languishing in the wake of the pandemic, shopping centers across the country are thriving – reinventing themselves as prime “third places” where people can hang out, shop, and grab a bite to eat.
One key driver behind this resurgence is a shift in how malls view their anchor tenants. While traditional mainstays like Macy’s and JCPenney still play an important role, specialized offerings – from popular eateries to fitness centers and immersive retailtainment destinations – are increasingly taking center stage. These attractions maximize the experiential value that brick-and-mortar venues can deliver, driving visits and sales for the center as a whole.
Against this backdrop, this report leverages the latest location intelligence data to explore the types of tenants that can function as mall anchors in 2025. Should mall operators still focus on general merchandisers to draw crowds, or can dining chains and more niche retailers also do the job? How important is square footage in identifying the anchor-like tenants in a shopping center? And how can a visit-focused approach help mall operators select effective anchor or anchor-like tenants – whether to fill big-box spaces or to leverage the leasing perks traditionally reserved for major large-format chains?
Out-of-the-(Big)-Box Visit Drivers
One of the most important functions of a mall anchor is to ensure steady visitation – providing its smaller tenants with a constant flow of potential customers. And as the role of the mall continues to evolve, analyzing the actual foot traffic impacts of different types of businesses can help identify the kinds of non-traditional anchors best suited to fulfill that purpose.
The Power of a Well-Placed Scheels
Experiential venues, for example, are particularly well-poised to serve as powerful anchors in today’s retail environment – as illustrated by the visit surge experienced by Towne East Square Mall in Wichita, KS following the addition of a Scheels in July 2023.
By blending traditional retail with immersive experiences, Scheels has emerged as a true experiential destination. And this pull has also helped the mall draw more long-distance visitors willing to travel to enjoy Scheels’ offerings. In 2024, 41.9% of the mall’s customers traveled more than 50 miles to visit, compared to 35.8% back in 2018 when Sears occupied the same lot.
Scheels Anchor Brings Substantial Visit Boost to Towne East Square Mall in Wichita, KS, Attracting Visitors From Further Away
Visits to Towne East Square Mall Compared to Q1 2018 Baseline
Share of Visitors From 50+ Miles Away
Share
Embed:
The Barnes & Noble Effect
Traditionally, anchors aimed to please the widest possible audiences – with department stores, big-box chains, and grocery stores leading the way. But visitation data shows that niche concepts can also deliver anchor-level traffic if they’re compelling enough to attract dedicated fans.
The experience of the Barnes & Noble at Coronado Center in Albuquerque, NM is a case in point. After being written off as all but obsolete, Barnes & Noble has staged an impressive comeback in recent years, finding success through a more curated, localized approach to book selling. And despite not being a formal anchor, the Coronado Center Barnes & Noble accounted for 7.9% of visits to the mall in 2024 – outperforming both Macy’s and JCPenney.
Year-over-year data also shows foot traffic surging at the Coronado Center Barnes & Noble, lifting overall visitation to the mall. And demographic data reveals that the bookstore draws a more affluent audience than either the center as a whole or the two department stores – attracting a crowd with more spending power.
This example also illustrates how smaller tenants can sometimes draw larger crowds. Even though Barnes & Noble occupies a smaller onsite space than either Macy’s or JCPenney, it is proving a powerful visit driver out of proportion to its physical size.
Dining Chains Punching Above Their Size
Dining chains are also adept at punching above their square footage – often attracting crowds disproportionate to their size.
Despite its relatively small footprint, for example, the In-N-Out Burger at Glendale Galleria drew an impressive 8.6% of visits to the mall complex in 2024, outpacing some of the mall’s official anchors like DICK’s Sporting Goods, Macy’s, and JCPenney. Still, the onsite Target drew even larger crowds at 14.4% of visits.
A similar pattern emerged at Northridge Fashion Center, where Porto’s Bakery and Cafe captured a notable 15.6% of visits to the complex in 2024 – more than some of the center’s traditional department stores.
These examples underscore the potential for dining chains, which typically require less space, to serve as micro-anchors by consistently attracting outsized crowds – a key consideration for mall operators looking to sustain visitor traffic.
Choosing a Mall Anchor in 2025
Refocusing on tenants’ actual foot traffic contributions also opens the door to a more flexible and dynamic approach to anchor selection and management – one that considers each venue’s unique visitation patterns.
The Weekend/Weekday Divide
Seasonal factors, for example, can make certain anchors more powerful at specific times of the year, while different venues shine on particular days of the week.
At Jordan Creek Town Center in West Des Moines, Iowa, for instance, Scheels and Costco each delivered just under 20.0% of the complex’s overall visits in 2024. But the two retailers’ daily patterns differed significantly: Scheels saw bigger crowds on weekends, while Costco was the primary weekday destination.
Understanding differences like these can help operators optimize their tenant mix to maintain a balanced flow of shoppers throughout the week.
Another example of the impact of differing weekday traffic patterns is offered by the impact of mall-based Chick-fil-A locations on the distribution of mall visits throughout the week.
Despite its relatively small size, Chick-fil-A draws substantial traffic to malls. And after adding Chick-fil-A locations, both Northridge and Miller Hill Malls saw meaningful drops in the share of visits to the centers taking place on Sundays – even as the wider indoor mall segment saw slight upticks.
Recognizing this trend could prompt mall operators to compensate by adding more weekend-friendly traffic drivers – or to lean into this distinction by taking additional steps to bolster the mall’s role as a go-to weekday destination.
The Early-Morning Fitness Advantage
The power of different mall traffic magnets also varies throughout the day. Increasingly, shopping centers are turning to fitness centers as experiential anchors. And since many people work out early in the morning, these gyms are having a significant impact on the distribution of mall visits across dayparts.
The addition of gyms to Northshore Mall in Peabody, MA and Jackson Crossing in Jackson, MI, for instance, led to a significant rise in visits between 7:00 AM and noon. And though the rest of the stores in these malls typically open at 10:00 or 11:00 AM, this shift presents the centers with a significant opportunity.
By adjusting opening hours to accommodate these early-morning patrons, malls can capitalize on this added traffic, driving up visits and sales for relevant tenants – especially health-focused retailers such as juice bars and sporting goods stores.
Adding Temporary Pop-Ups Into the Mix
Adopting a broader, visit-focused view of anchoring also allows mall operators to apply some of the strategies typically reserved for anchors to non-conventional traffic-generating businesses, to ensure a consistent flow of traffic year-round.
Pop-up stores and events, for example, generally don’t follow the same seasonal trends as other retailers – instead, they generate short-term visit boosts during their runs, whenever in the year that may be. And a visit-focused anchor strategy can leverage some of the perks traditionally reserved for anchor tenants – such as preferential leasing terms – to complement traditional full-time anchors during slower retail periods.
The Barbie Dreamhouse Living Truck Tour is a prime example of a traffic-driving pop-up. By bringing exclusive merchandise to malls across the U.S., the truck generates plenty of buzz, drawing crowds eager to snatch up limited-edition items and immerse themselves in all things Barbie. As a result, malls hosting the tour often see significant visit spikes, with foot traffic surging well above typical Saturday levels. Well-timed pop-ups like these can help balance out traffic throughout the year, offsetting traditional slow periods.
Creating a Bigger Visit Pie
A visit-focused approach to anchor management can also help mall operators assess the potential impact of new tenants on existing stores operating in similar categories. For example, mall owners often worry that new tenants operating in similar categories might cannibalize existing businesses. But a visit-focused anchor approach reveals that a well-chosen addition can sometimes benefit current tenants – especially if they cater to similar audiences.
In February 2020, for instance, value supermarket Aldi opened at Green Acres Commons in Valley Stream, NY – a center that already hosted budget-friendly BJ’s Wholesale Club. While BJ’s visits were relatively flat in 2018 and 2019, they began to rise after Aldi’s opening (and following a pandemic-induced dip). Cross-shopping data also shows that Aldi customers were more likely to visit BJ’s than the average Green Acres patron last year.
This synergy may be due in part to the two retailers’ similar visitor bases: In 2024, the Aldi and BJ’s stores in Green Acres Common drew shoppers with comparable economic profiles. This suggests that overlapping audiences can become a strength if aligned brands attract new shoppers, who then explore multiple stores in the same center.
Visits to BJ's Wholesale Club Took Off After Addition of Aldi to Green Acres Commons – Perhaps Buoyed by Audience Similarity
Visits to Green Acres Commons BJ's Wholesale Club, Compared to Q1 2018 Baseline
Median HHI, 2024*
Cross-Shopping, 2024
*Median HHI based on STI: PopStats dataset combined with Placer.ai data for captured trade areas.
Looking ahead, effective mall anchors will be defined less by physical footprint and more by their capacity to maintain consistent, valuable foot traffic. While traditional department stores remain pivotal, smaller or niche brands can often rival – or surpass – large-format retailers. And by thinking out of the anchor box and choosing tenants that cultivate a balanced visitor flow and align with local preferences, operators can position their centers as true go-to destinations.
Dive into the data to see the trends shaping the grocery space in 2025 and uncover actionable insights for strategic decision-making in the competitive food-at-home market.
May 15, 2025
8 minutes
Key Takeaways:
1. Shoppers are taking more, shorter trips to grocery stores.Over the past 12 months, grocery stores have experienced nearly uniform YoY visit growth. And since COVID, the segment has steadily increased both overall visits and average visits per location – even as average dwell times have consistently declined.
2. Grocery stores are holding ground against fierce competition. Despite growing inroads by discount and dollar stores, wholesale clubs, and general mass retailers like Walmart and Target, grocery stores have maintained their share of the overall food-at-home visit pie over the past several years.
3. Grocery visit share is most pronounced on the coasts. In Q1 2025, grocery stores claimed the majority of food-at-home visits on the West Coast, in parts of the Northeast, Mid-Atlantic, and Mountain Regions, and in Florida and Michigan.
4. Fresh-format, value, and ethnic grocery visit shares are growing at the expense of traditional chains. And in Q1 2025, fresh-format and value grocers outperformed the other sub-segments with positive YoY visit and average visit-per-location growth.
5. Hispanic markets are on the rise. Though the broader ethnic grocery sub-segment was essentially flat YoY in Q1 2025, Hispanic-focused stores recorded increases in both visits and visits per location – and have been steadily growing visits since 2021.
6. Smaller formats for the win. In Q1 2025, smaller-format grocery store locations outpaced mid-sized and larger-format ones, underscoring the power of compact spaces to deliver significant foot traffic gains.
A Study in Resilience
Brick-and-mortar grocery stores face an uncertain market in 2025. Rising food-at-home prices (eggs, anyone?), declining consumer confidence, and increased competition from discounters, superstores, and online shopping channels all present the segment with significant headwinds. Yet even in the face of these challenges, the sector has demonstrated remarkable resilience – growing its foot traffic and holding onto visit share.
What strategies have helped the segment navigate today’s tough market? And how can industry stakeholders make the most of the opportunities in the current market? This report draws on the latest location intelligence to uncover the trends shaping grocery retail in early 2025 – highlighting insights to help key players make informed, data-driven decisions on store formats, product offerings, and more.
Growth in Aisle One
The grocery segment has experienced nearly uniform positive year-over-year (YoY) growth over the last 12 months. This sustained performance in the face of inflation and other headwinds highlights the underlying strength of the category.
Visits Up, Dwell Time Down
What is driving this growth? Since 2022, the grocery segment has seen consistent overall visit growth that has outpaced increases in visits per location – a sign that chain expansion has played a key role in the category’s success. But the average number of visits to each grocery store has also been on the rise, indicating that the segment continues to expand without cannibalizing existing store traffic.
At the same time, visitor dwell times have been steadily dropping since 2021. This shift appears to reflect a trend towards multiple, shorter trips by inflation-wary consumers eager to avoid large, costly carts or cherry pick deals across various retailers. Many shoppers may also be placing more bulk orders online and supplementing those deliveries with brief in-store stops for additional items as needed.
The bottom line: Shoppers are taking more grocery trips overall each year, but spending less time in-store during each visit. Operators can respond to this trend by optimizing layouts and promoting “grab-and-go” areas for an even more efficient quick-trip experience.
Still in Stock
Visit share data also shows that despite fierce competition from discount and dollar stores, wholesalers, and general mass retailers, the grocery segment has steadfastly preserved its share of the overall food-at-home visit pie.
Between Q1 2019 and Q1 2025, wholesale clubs and discount and dollar stores increased their share of total food-at-home visits, gains that have come primarily at the expense of Walmart and Target. Meanwhile, grocery outlets have held firm – despite some fluctuations over the years, their Q1 2019 visit share remained essentially unchanged in Q1 2025.
So even as consumers flock to alternative food purveyors in search of lower prices, grocery stores aren’t losing ground – and on a nationwide level, they remain the biggest player by far in the food-at-home shopping space.
A Coastal Advantage
Still, grocery store visit share varies significantly by region. On the West Coast, in parts of the Northeast, Mid-Atlantic, and Mountain regions, and in Florida and Michigan, grocery stores accounted for the majority of food-at-home visits in Q1 2025. Oregon (61.6%) and Washington (59.6%) led the pack, followed by Massachusetts (59.2%), Vermont (58.5%), and California (57.9%). Meanwhile, in West Virginia, Arkansas, South Dakota, Oklahoma, North Dakota, and Mississippi, less than 30% of food-at-home traffic went to grocery stores, with more shoppers in these regions turning to general mass retailers or discounters.
Grocery store operators in lower-grocery-share regions may choose to focus on price competitiveness and convenient store locations to capture more foot traffic from competitors in the space.
Fresh and Frugal on the Rise
Which types of grocery stores are thriving the most? The grocery segment is diverse, encompassing traditional grocery chains like Kroger, Safeway, and H-E-B; budget-oriented value chains such as Aldi, WinCo Foods, Grocery Outlet Bargain Market, and Market Basket; fresh-format specialty brands like Trader Joe’s, Whole Foods, and Sprouts Farmers Market; and numerous ethnic grocers.
Examining shifts in visit share among these various grocery store segments shows that traditional grocery still dominates, commanding over 70.0% of total grocery store foot traffic.
Still, over the past several years, traditional grocers have gradually ceded ground to other segments – especially value chains. Budget grocers saw a temporary surge in visits during the panic-buying days of early 2020 – and have been more gradually gaining visit share since Q1 2023. . Fresh-format banners, which lost ground in 2021 after a Q1 2020 bump, in the wake of COVID, have also been on the upswing and appear poised to capture additional visit share in the coming months and years. And though ethnic grocers still account for a relatively small portion of the overall market, they have slightly increased their visit share, reflecting heightened consumer interest in these specialized offerings.
The Discount and Premium Edge
Recent performance metrics point to a bifurcation in the grocery market similar to that observed in other retail categories. In Q1 2025, fresh-format and value retailers – which appeal, respectively, to the most and least affluent visitor bases – saw the greatest growth in both overall visits and average visits per location.
This trend highlights the power of both value and health-focused quality to motivate consumers in 2025. And grocery players that can meet these needs will be well-positioned for success in the months ahead.
WFH Fresh-Format Lunch Crunch
One factor fueling fresh-format’s success may be its role as a convenient, relatively affordable midday lunch destination for the remote work crowd.
In Q1 2025, consumers working from home accounted for 20.2% of fresh-format grocery stores’ captured market – a significantly higher share than any other analyzed grocery segment. These stores also tended to be busier midday than the other segments. Remote workers may be stopping by to grab a quick bite – and some may be choosing to do their grocery shopping during their lunch break when stores are less crowded.
This finding suggests an opportunity for grocery operators across all segments to develop or enhance in-store salad bars and quick-serve sections to tap into the lunch rush. Likewise, CPG companies may benefit from developing more ready-made, nutritious meal options that align with these midday dining habits.
Salsa Surge
Though the broader ethnic grocery category remained essentially flat in Q1 2025, Hispanic-focused grocers emerged as a sub-segment to watch. Both overall visits and average visits per location to these stores have been on the rise since 2021.
This robust demand presents an opportunity for CPG brands and grocers across segments to expand Hispanic-focused offerings, capturing a slice of this growing market.
Less is More
Finally, store size matters more than ever in 2025. During the first quarter of the year, smaller format grocery store locations (locations under 30K square feet, across different chains) outpaced larger stores with a 3.2% YoY jump in visits, showing that bigger isn’t always better in the grocery store space.
This pattern aligns with the decrease in dwell times noted above – shoppers may be making shorter trips to smaller, more convenient grocery store locations. These quick errands are ideal for picking up a few items to supplement online orders, shopping multiple deals, or sourcing specialty products unavailable at larger grocery destinations. And to lean into this trend, grocery operators might consider testing neighborhood “micro-store” concepts, focusing on curated selections, and offering convenient parking or pickup to match consumer preferences for targeted purchases and quicker trips.
Final Thoughts
Location intelligence reveals a growing, dynamic grocery landscape which is holding its ground in the face of increased competition. Shorter trips, busier lifestyles, and changing work routines are reshaping in-store experiences. And grocery players that refine their store formats, target both lunch and on-the-go shoppers, and adapt to shifting demographics can position themselves to thrive in this competitive sector. As the market continues to evolve, continuous attention to these changing patterns will be key to maintaining and expanding market share.
Dive into the data to explore recent visitation patterns and consumer trends in the fitness space - and uncover potential keys to success, rooted in location intelligence.
May 5, 2025
8 minutes
Key Takeaways
1. Elevated visitor frequency could mean that gym-goers are getting more value out of their memberships and are therefore more likely to stay signed up. Between January and March 2025, all of the gym chains analyzed had a higher share of frequent visitors (those who visited about once a week) than in the equivalent month of 2024.
2. Fitness chains at all price tiers need to be strategic about the value they offer and the amenities that can engage budget-conscious consumers. Between Q1 2022 and Q1 2025, the captured trade area median HHI increased for all fitness subsegments – value-priced, mid-range, and high-end – suggesting that consumers swapped pricier gym memberships for more affordable options.
3. Close attention should be paid to how long visitors spend at fitness chains in order to reduce crowding and bottlenecks. Between Q1 2022 and Q1 2025, the average visit length increased at value-priced, mid-range, and high-end gyms. Floorplan and equipment improvements could be considered, as well as having trainers available to help gym-goers streamline workouts.
4. Gyms can use hourly visit data to better serve their members or use promotions to stabilize facility usage throughout the day. In Q1 2025, high-end chains received a larger share of morning visits while value-priced and mid-range fitness chains received larger shares of evening visits.
Fitness Flexes Its Muscles
Like many industries in recent years, the fitness sector has experienced significant shifts in consumer behavior. From the rise in home workouts during the pandemic to the strain of hyper-inflation, foot traffic trends to gyms and health clubs have been as dynamic as the consumers they serve.
This report leverages location analytics to explore the consumer trends driving visitation in the fitness space and provides actionable insights for industry stakeholders.
Back in Shape: The COVID Recovery
The pandemic drove several shifts in the fitness space. Widespread gym closures led consumers to embrace home-based workouts, while demand for all things fitness increased due to an emphasis on overall health and wellness. This subsequently drove a renewed interest in gym-based workouts as restrictions lifted – even as some consumers remained committed to their home workout routines.
In Q1 2023, visits to fitness chains surpassed Q1 2019 levels for the first time since the onset of the pandemic, a sign that consumers had recommitted to out-of-home fitness. And in Q1 2024 and Q1 2025, fitness chains saw further growth, climbing to 12.8% and 15.5% above the Q1 2019 baseline, respectively.
Several factors have likely driven consumers’ return to gyms and health clubs, including the desire for both social connection and professional-grade facilities difficult to replicate at home. The steep increase in cost of living has likely also played a role, since consumers cutting back on discretionary spending can enjoy multiple outings and a range of recreational activities at the gym for one monthly fee.
Getting Gains: Strong Q1 ‘25
Zooming in on weekly visits to the fitness space in Q1 2025 reveals the industry’s exceptional strength and resilience in the early part of the year.
The fitness industry experienced YoY visit growth nearly every week of Q1 2025 (and 2.4% YoY visit growth overall) with only minor visit gaps the weeks of January 20th, 2025 and February 17th, 2025 – likely due to extreme weather that prevented many Americans from hitting the gym.
And the fitness industry’s weekly visit growth appeared to strengthen throughout the quarter, defying the typical waning of New Year's resolutions. This could indicate that gym visits haven't plateaued and that consumers are demonstrating greater commitment to their fitness routines compared to last year.
Increasing Reps: Visitor Frequency Up At Leading Chains
Diving into visitation patterns for leading fitness chains highlights how increased visitor frequency drove foot traffic growth in Q1 2025.
Fitness chains tend to receive the most visits during the first months of the year as consumers recommit to health and wellness in their post-holidays New Year’s resolutions. And not only do more people hit the gym – analyzing the data reveals that gym-goers also typically work out more frequently during this period. Zooming in on 2025 so far suggests that consumers are especially committed to their fitness routines this year: Leading gyms saw an increase in the proportion of frequent visitors (4+ times a month) in Q1 2025 compared to the already significant percentage of frequent visitors in the first quarter of 2024.
Elevated visitor frequency could mean that gym-goers are getting more value out of their memberships than last year, and are therefore more likely to stay signed up throughout the year.
At the same time, the data also reveals that – contrary to what may be expected – a fitness chain’s share of frequent visitors appears to be independent of the cost of membership associated with the club: Life Time, a high-end club, and EōS Fitness, a value-priced gym, had the highest shares of frequent visitors between January 2024 and March 2025. This suggests that factors other than cost, such as location convenience, class offerings, community, or individual motivation, might be more influential in driving frequent gym attendance.
Fitness Clubs at Different Price Points
Segmenting the fitness industry by membership price tiers – value-priced, mid-range, and high-end – can reveal further insights on current consumer behavior around out-of-home fitness.
Household Income Bulks Up
In Q1 2025, the captured market* median household income (HHI) was higher than the nationwide median HHI ($79.6K/year) across all price tiers – suggesting that even value-priced fitness chains are attracting a relatively affluent audience. This could indicate that gym memberships are somewhat of a luxury and that consumers from lower-income households gave up their gym memberships altogether as they tightened their purse strings.
Analyzing the historical data since Q1 2022 also reveals that the captured market median HHI has risen consistently over the past couple of years with the largest median HHI increase observed in the captured trade areas of high-end fitness chains. This suggests that middle-income households – that are more sensitive to the rising cost of living – likely swapped pricier gym memberships for more affordable options in recent years.
These metrics indicate that fitness chains at all price tiers need to think strategically about the value they offer and the amenities that can engage budget-conscious consumers who are carefully weighing every expenditure.
*Captured trade area is obtained by weighting the census block groups (CBGs) from which the chain draws its visitors according to their share of visits to the chain and thus reflects the population that visits the chain in practice.
Average Stay Increases
Fitness clubs of all types need to manage their capacity to ensure health and safety standards and a positive experience for members. And understanding the average amount of time visitors spend at the gym can help fitness chains at every price point keep their finger on the pulse of their facilities.
Between Q1 2022 and Q1 2025, the average visit length increased at value-priced, mid-range, and high-end gyms. Value-priced gyms experienced the largest increase in average visit length – from 72.4 minutes in Q1 2022 to 74.0 minutes in Q1 2025 – perhaps due to their relatively lower-income visitors spending more time enjoying club amenities after cutting back on other forms of recreation. Meanwhile, mid-range and high-end gyms experienced relatively modest increases in average visit length, which were higher to begin with – likely due to their ample class and spa offerings and overall inviting, upscale spaces.
Elevated average visit length could mean that visitors are well-engaged and less likely to cancel their memberships. But as overall gym visits are on the rise, fitness chains may want to pay close attention to how long visitors spend at the facility. Floorplan and equipment improvements could be considered in order to reduce bottlenecks, and having trainers available to instruct on equipment usage and workout technique could help gym-goers streamline workouts.
Workouts on a Schedule
Along with average visit length, understanding the daypart in which they receive the most visits is another way that fitness chains can improve efficiency and prevent overcrowding. And analysis of the hourly visits to fitness sub-segments revealed that some fitness segments receive more morning visits while others are more popular in the evenings.
In Q1 2025, high-end chains received a larger share of visits between 6 a.m. and 9 a.m. (19.7%) than value-priced and mid-range fitness chains (11.6% and 11.8%, respectively). Meanwhile, value-priced and mid-range fitness chains received larger shares of visits between 6 p.m. and 9 p.m. (21.9% and 22.2%) than high-end chains (16.5%).
Gyms can leverage this data to better serve members, for instance by scheduling more classes during peak hours. Value-priced and mid-range gyms, which saw a larger disparity between shares of morning and evening visits in Q1 2025, might also consider incentivizing off-peak usage through discounted morning memberships or early-bird snack bar deals.
Fitness Continues to Grow
The fitness space appears to be in good shape in 2025. Visits have made a full recovery from the pandemic era and still continue to grow, indicating strong consumer demand for out-of-home workouts. And using location intelligence to analyze the behavior and demographics of visitors to gyms at different price points can help identify opportunities for driving even greater success.


.svg)