Following the August 7th tariff implementation, manufacturing visits experienced a significant drop, indicating that businesses are working through stockpiled inventory. This suggests a period of reassessment and adjustment in supply chain strategies.
Lila Margalit
Aug 28, 2025
1 minute
In June and July 2025, visits to Placer’s Industrial Manufacturing Composite Index grew 3.0% and 2.3% year over year (YoY), respectively, as supply chains raced against the clock to build inventory in advance of the new tariffs set to come into effect on August 7th. But as the deadline approached, YoY visits to these sites by employees and logistics partners began to decline, dropping to 4.2% YoY during the week of August 11th, 2025.
The timing of this decline, occurring just days after tariff implementation, points to manufacturers potentially working through stockpiled inventory and reassessing supply chain strategies under the new cost structure. While it's still early to determine whether this represents a temporary recalibration or the beginning of a more sustained slowdown, the data suggests that the manufacturing sector is entering a period of adjustment as businesses adapt to the new tariff environment.
Bath & Body Works (BBWI) leveraged its semi-annual sale to drive visit growth despite economic headwinds.
Bracha Arnold
Aug 27, 2025
1 minute
Bath & Body Works emerged as a surprise retail winner in February 2025’s Placer 100 roundup, when overall visits to the chain jumped by 13.7% YoY in conjunction with its Disney-themed fragrance release. And the chain is maintaining its relevance in the face of declining discretionary spending and tighter consumer budgets through a multi-pronged approach, including store expansions, a TikTok presence, and partnerships with influencers.
Still, traffic to the chain reflects the impact of softened discretionary spending. Although overall traffic increased 3.5% in Q2 2025 compared to Q2 2024, thanks in part to the chain's strategic expansion, same-store visits for the quarter fell slightly, as seen in the chart below. But foot traffic rebounded dramatically in July, when its semi-annual sale sent same-store visits up by 12.7% and overall visits up by 17.5%, highlighting how compelling promotions – especially when consumer budgets are tight – can lead to foot traffic spikes.
Visit Placer.ai/anchor for the latest data-driven retail insights.
Ulta (ULTA) drives Q2 2025 growth with new stores and a clear pivot away from Target. Discover how the brand's core business and customer base are set to fuel its next chapter.
Bracha Arnold
Aug 26, 2025
3 minutes
The beauty industry continues to flourish, with external factors like the rise of #BeautyTok, the influence of online creators, and a steady stream of new products driving interest. Within this landscape, Ulta (ULTA) has been driving strong sales, capitalizing on continued interest in beauty to fuel this growth.
Ulta Navigates Headwinds
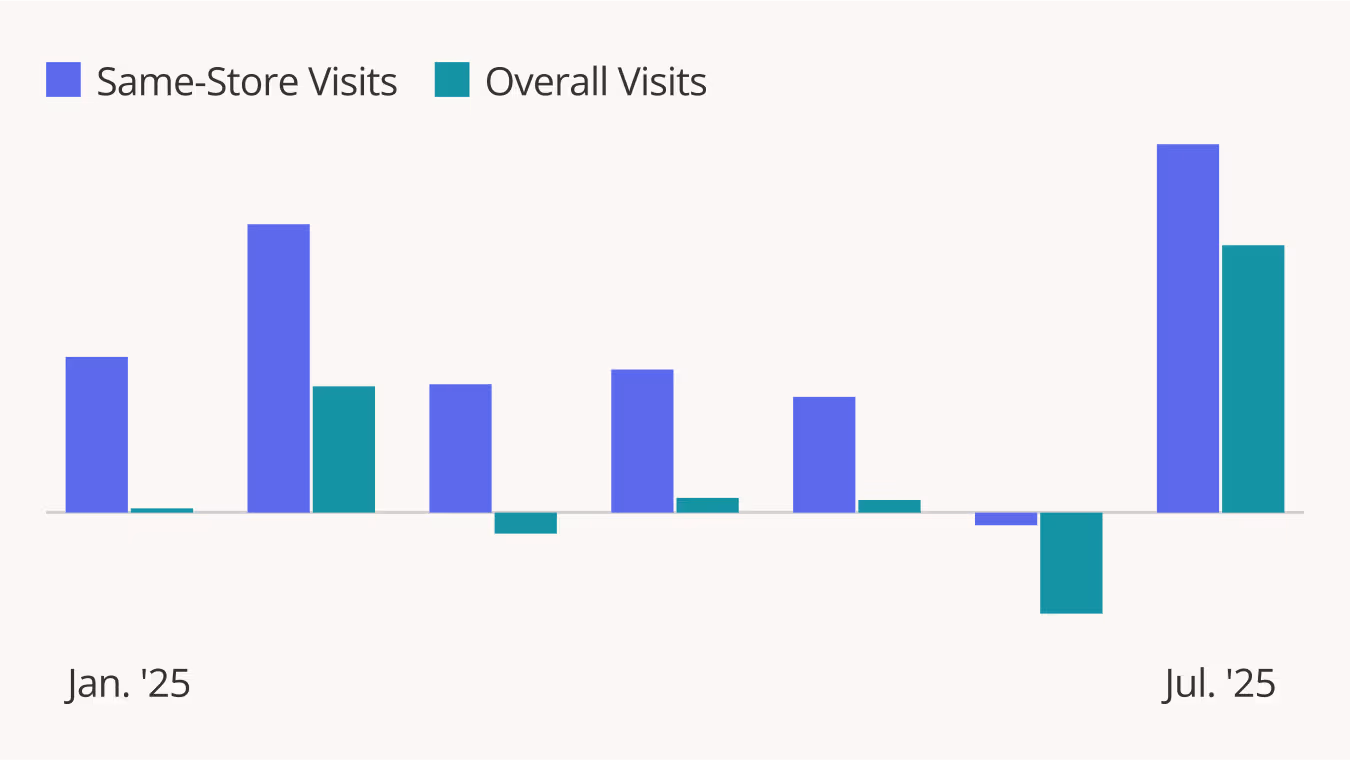
Following major gains through the pandemic years and beyond, Ulta's visits have flattened slightly. In Q2 2025, overall visits to the chain grew by 1.4% year over year (YoY), likely thanks to store openings (Ulta opened 62 new stores between Q1 2024 and Q1 2025), as same-store visits declined by 1.1% in the same period.
Despite softer same-store foot traffic as seen in the chart below, Ulta delivered strong comp sales growth of 2.9% last quarter, driven by a 2.3% rise in average ticket size and a 10.0% increase in e-commerce sales. Now, the chain seems to be entering a new phase of its story, choosing to wind down its Target partnership in favor of its Ulta Beauty Unleashed growth plan.
Ulta Shoppers Ready for Target Break
As Ulta’s growth momentum slows, its decision not to renew its six-year partnership with Target may be a strategic move to direct traffic to its growing store fleet.
The partnership launched in 2021 with the goals of making prestige beauty more accessible to Target shoppers while helping Ulta "deepen loyalty with existing guests and introduce Ulta Beauty to new guests." And, at least for Ulta, the strategy seems to have worked – the share of Target shoppers also visiting Ulta stores has increased significantly since the launch, as seen in the chart below. This suggests that the Ulta shop-in-shops helped the chain acquire new customers through the brand exposure generated by the partnership.
But the data also suggests that the benefits to Ulta may be diminishing. Since 2023, the share of Target shoppers also visiting Ulta appears to have plateaued around 30%, indicating that the shop-in-shops are no longer driving meaningful traffic to stand-alone Ulta stores. Meanwhile, Ulta now has a larger store fleet than it did in 2021 (the company opened approximately 150 new stores between Q2 2021 and Q1 2025). This expansion likely also contributed to increased cross-visitation while reducing the partnership's value proposition, as beauty consumers now have more opportunities to visit standalone Ulta stores. With the partnership's customer acquisition benefits plateauing and Ulta's expanded footprint reducing reliance on Target's locations, ending the collaboration appears to be a logical step toward maximizing traffic to Ulta's own stores.
Now, both brands have new opportunities to focus on their relative strengths. For Ulta, that means building out its Ulta Beauty Unleashed program, which will see the brand focus on improving store operations, enhancing the digital experience, and moving into new markets. Meanwhile, incoming Target CEO Michael Fiddelke plans to take the company back to its roots, focusing on its own merchandise and using technology to improve efficiency.
Ulta Beats Expectations
As Ulta transitions away from its Target partnership and focuses on its Ulta Beauty Unleashed growth plan, the company is well-positioned to capitalize on expanding store operations, enhanced digital experiences, and entry into new markets.
For the latest data-driven retail insights, visit Placer.ai/anchor.
Dollar Tree's strategic refocus is driving accelerating traffic growth in Q2 2025 while Dollar General's momentum has cooled. Geographic analysis reveals both chains operate in distinct regional strongholds, creating significant white space expansion opportunities rather than direct competition.
Shira Petrack
Aug 26, 2025
3 minutes
Dollar General and Dollar Tree have grown significantly in recent years, upending the competitive dynamics in the wider retail landscape. Can these chains continue to grow? Or are they beginning to reach their saturation point? We dove into the data to find out.
Focus on Dollar Tree Banner Delivers Growth
Dollar Tree recently completed the sale of the Family Dollar brand, allowing management to dedicate its efforts to "Dollar Tree's long-term growth, profitability and returns on capital."
The strategic refocus appears to be already paying off. As the chart below shows, year-over-year (YoY) overall and same-store visits to the chain have surged in recent months, indicating strong organic performance amplified by fleet expansion.
Dollar General Still Growing – At a Slower Pace
Meanwhile, Dollar General is also experiencing traffic growth – though momentum has cooled slightly. After posting a robust 12.2% visit increase between July 2023 and July 2024, growth has decelerated to 2.9% year-over-year in July 2025.
Still, although Dollar General's growth has slowed while Dollar Tree's growth has picked up, Dollar General remains the significantly larger chain. In H1 2025, 58.7% of combined visits to the two retailers went to Dollar General, compared to 41.3% of visits to Dollar Tree. And just because Dollar General's growth has slowed somewhat does not mean that the company has reached its saturation point.
Even though both chains have been growing for several years, geographic data reveals that domestic expansion opportunities for both retailers still exist.
The map below shows the share of combined visits to Dollar General and Dollar Tree going to each chain by DMA. Dollar Tree receives a majority of visits in the yellow DMAs, which are heavily concentrated in the Western United States. In contrast, Dollar General receives the majority of visits in the purple DMAs which cover most of the Midwest and South.
This distinct geographic segmentation indicates that rather than competing head-to-head, each chain has built regional strongholds – creating significant white space opportunities for cross-regional expansion. Dollar Tree's renewed focus and accelerating traffic position it well to build up its position in the South and Midwest – Dollar General's traditional markets. Conversely, Dollar General's established operational scale and proven rural market penetration strategy could drive significant growth for the chain in Dollar Tree's Western strongholds.
Dollar Tree & Dollar General's Growth Potential
Dollar Tree’s sharpened focus and accelerating traffic growth signal strong long-term potential, while Dollar General’s scale ensures it remains a formidable player despite cooling momentum. With distinct geographic strongholds, both retailers still have significant white space for expansion – setting the stage for continued growth rather than saturation.
For the most up-to-date superstore visit data, check out Placer.ai's free tools.
Value-oriented retailers Five Below and Ollie's achieved exceptional Q2 2025 visit growth through aggressive store expansion while maintaining strong same-store performance, demonstrating the expanding market opportunity for value-oriented discretionary retail.
Shira Petrack
Aug 22, 2025
3 minutes
Expansions, Rising Demand Drive Visits Growth For Five Below & Ollie’s
Value-oriented retailers Ollie's Bargain Market (OLLI) and Five Below (FIVE) continue their impressive growth trajectory, with Q2 2025 visits surging 18.3% and 14.3% year-over-year, respectively.
Both chains are aggressively expanding their footprints – Ollie's acquired around 40 Big Lots leases and opened 25 of its projected 75 new stores by May 2025, while Five Below plans to add 150 locations this year after opening hundreds in 2024. Critically, the expansions are not coming at the expense of existing stores. Same-store visits grew 9.4% at Ollie's and 5.9% at Five Below, meaning individual locations are actually busier now than last year – despite the larger fleet size.
These positive traffic trends underscore the strong consumer appetite for value-oriented discretionary retail in today's economic environment and highlight the growth potential of the two chains.
Five Below and Ollie's positive visit trends demonstrate that growth doesn't have to be zero-sum. Rather than cannibalizing each other's traffic, both chains are successfully growing in parallel, as their increased store presence and busier locations expand the overall value-oriented discretionary retail market.
This growth can also be seen from the cross-visitation data in the chart below. H1 2025 saw the largest share of Ollie's shoppers visiting Five Below and the largest share of Five Below shoppers visiting Ollie's in recent years. (The cross-visitation from Ollie's to Five Below was likely significantly higher than the reverse due to Five Below's much larger physical footprint.)
This rising cross-visitation between the two chains validates the expanding market opportunity for value-oriented discretionary retail, as consumers increasingly embrace multiple value-oriented shopping destinations to meet their needs.
Broad Appeal In the Bargain Space
The strong performance of Five Below and Ollie's in Q2 2025 demonstrates the resilience and growth potential of the discount retail sector during challenging economic times.
Visit Placer.ai/anchor for the latest data-driven retail insights.
Summary: Gap Inc. showed real progress in Q2 2025, with overall visits up 3.6% year over year. Old Navy drove the gains with a 4.8% boost, while Gap posted positive traffic despite a smaller store base. A strong spring surge, partly fueled by tariff pull-forward, gave way to softer summer visits. Meanwhile, the return of middle-income shoppers signals that revitalization efforts are resonating.
Lila Margalit
Aug 22, 2025
3 minutes
Real Signs of Progress
Gap Inc. is showing real signs of progress in its turnaround efforts. Since CEO Richard Dickson took the helm in August 2023, the company has been working to revitalize its portfolio of brands – and the latest foot traffic data confirms that strategy is beginning to deliver results.
In Q2 2025, visits to the company’s four banners—Old Navy, Gap, Athleta, and Banana Republic—rose 3.6% year over year (YoY), outperforming the broader apparel category (excluding department stores and off-price retailers), which saw traffic decline 2.2%.
Focusing on the company’s two largest and strongest performers, Old Navy led with a 4.8% increase in overall foot traffic and a 4.5% gain in same-store visits. The namesake Gap brand also posted growth despite a smaller U.S. store base. Notably, overall visits to Gap slightly outpaced same-store sales, signaling that store closures are effectively removing underperformers, while new locations are resonating with shoppers.
Springtime Surge
Turning to monthly foot traffic trends, both Old Navy and Gap posted significant year-over-year visit gains in April and May 2025 before seeing visitation taper in June and July.
The two chains’ springtime surge may be partially attributed to tariff pull-forward. Following the announcement of new tariffs in early April, many consumers appear to have accelerated purchases to avoid anticipated price increases. This pull-forward effect likely shifted demand into April and May, inflating growth in the short term but contributing to softer traffic in June and July. Memorial Day sales and campaigns like the company’s “Feels Like Gap” campaign may have also resonated with consumers.
Winning Back the Core Consumer
Another encouraging sign for the company lies in the shifting income profiles of visitors to its flagship brands.
As illustrated in the chart, the median household incomes (HHIs) of both Gap and Old Navy’s captured markets rose in 2022 and 2023. Inflation and higher prices likely pushed lower-income consumers to trade down to alternatives, leaving Gap and Old Navy with relatively more affluent shoppers.
But since 2023 (for Gap) and 2024 (for Old Navy), HHIs in the chains’ trade areas have begun to decline slightly – suggesting the return of middle-income households. This subtle but meaningful shift indicates that revitalization efforts are reconnecting with the company’s historical core audience – middle-income shoppers who value style at an attainable price point.
Looking Ahead
Gap Inc.’s Q2 2025 performance provides encouraging evidence that its turnaround strategy is taking hold. Yet the company remains at a delicate juncture. Athleta and Banana Republic continue to lag behind their sister brands, and tariffs represent a significant headwind that could weigh on profitability.
Still, there is reason for optimism. If Gap Inc. can maintain its renewed connection with middle-income shoppers, refine its store strategy, and adapt effectively to the shifting tariff landscape, the momentum seen this quarter could help advance a sustained recovery.
Visit Placer.ai/anchor for the latest data-driven retail insights.
Discover how mall anchors are transforming in 2025 – and how a foot-traffic-focused approach to choosing key tenants can drive visits and shopper engagement.
May 29, 2025
8 minutes
Key Takeaways
1. Experiential and niche retailers can deliver anchor-level traffic. At Towne East Square Mall, the addition of a Scheels in 2023 significantly increased foot traffic and long-distance travelers, while Barnes & Noble at Coronado Center in Albuquerque has become a key driver of both foot traffic and higher-spend demographics.
2. Size isn’t everything – especially for dining venues. At Glendale Galleria and Northridge Fashion Center, smaller restaurants attracted more foot traffic than some traditional anchors.
3. Refocusing on tenants’ actual traffic contributions enables a flexible anchor approach. Balancing weekend draws like Scheels with weekday favorites such as Costco or Chick-fil-A can help maintain steady visitor flow throughout the week. Similarly, onsite fitness clubs can shift traffic to earlier in the day – an opportunity to adjust store hours and capture additional morning shoppers.
4. Temporary pop-ups can form an integral part of a visit-focused anchor strategy. The Barbie Dreamhouse Living Truck Tour generates mall visit spikes well above typical Saturday levels. Operators can integrate these events into their overall anchor strategies, offering preferential terms to high-performing pop-ups.
5. New tenants can boost traffic for existing stores in similar categories. After Aldi joined Green Acres Commons in February 2020, visits to an existing BJ’s Wholesale Club trended upwards. This synergy highlights how overlapping audiences can become a strength, creating a larger overall customer base.
The Retail Comeback Kid
Malls, it seems, are cool once again. After languishing in the wake of the pandemic, shopping centers across the country are thriving – reinventing themselves as prime “third places” where people can hang out, shop, and grab a bite to eat.
One key driver behind this resurgence is a shift in how malls view their anchor tenants. While traditional mainstays like Macy’s and JCPenney still play an important role, specialized offerings – from popular eateries to fitness centers and immersive retailtainment destinations – are increasingly taking center stage. These attractions maximize the experiential value that brick-and-mortar venues can deliver, driving visits and sales for the center as a whole.
Against this backdrop, this report leverages the latest location intelligence data to explore the types of tenants that can function as mall anchors in 2025. Should mall operators still focus on general merchandisers to draw crowds, or can dining chains and more niche retailers also do the job? How important is square footage in identifying the anchor-like tenants in a shopping center? And how can a visit-focused approach help mall operators select effective anchor or anchor-like tenants – whether to fill big-box spaces or to leverage the leasing perks traditionally reserved for major large-format chains?
Out-of-the-(Big)-Box Visit Drivers
One of the most important functions of a mall anchor is to ensure steady visitation – providing its smaller tenants with a constant flow of potential customers. And as the role of the mall continues to evolve, analyzing the actual foot traffic impacts of different types of businesses can help identify the kinds of non-traditional anchors best suited to fulfill that purpose.
The Power of a Well-Placed Scheels
Experiential venues, for example, are particularly well-poised to serve as powerful anchors in today’s retail environment – as illustrated by the visit surge experienced by Towne East Square Mall in Wichita, KS following the addition of a Scheels in July 2023.
By blending traditional retail with immersive experiences, Scheels has emerged as a true experiential destination. And this pull has also helped the mall draw more long-distance visitors willing to travel to enjoy Scheels’ offerings. In 2024, 41.9% of the mall’s customers traveled more than 50 miles to visit, compared to 35.8% back in 2018 when Sears occupied the same lot.
Scheels Anchor Brings Substantial Visit Boost to Towne East Square Mall in Wichita, KS, Attracting Visitors From Further Away
Visits to Towne East Square Mall Compared to Q1 2018 Baseline
Share of Visitors From 50+ Miles Away
Share
Embed:
The Barnes & Noble Effect
Traditionally, anchors aimed to please the widest possible audiences – with department stores, big-box chains, and grocery stores leading the way. But visitation data shows that niche concepts can also deliver anchor-level traffic if they’re compelling enough to attract dedicated fans.
The experience of the Barnes & Noble at Coronado Center in Albuquerque, NM is a case in point. After being written off as all but obsolete, Barnes & Noble has staged an impressive comeback in recent years, finding success through a more curated, localized approach to book selling. And despite not being a formal anchor, the Coronado Center Barnes & Noble accounted for 7.9% of visits to the mall in 2024 – outperforming both Macy’s and JCPenney.
Year-over-year data also shows foot traffic surging at the Coronado Center Barnes & Noble, lifting overall visitation to the mall. And demographic data reveals that the bookstore draws a more affluent audience than either the center as a whole or the two department stores – attracting a crowd with more spending power.
This example also illustrates how smaller tenants can sometimes draw larger crowds. Even though Barnes & Noble occupies a smaller onsite space than either Macy’s or JCPenney, it is proving a powerful visit driver out of proportion to its physical size.
Dining Chains Punching Above Their Size
Dining chains are also adept at punching above their square footage – often attracting crowds disproportionate to their size.
Despite its relatively small footprint, for example, the In-N-Out Burger at Glendale Galleria drew an impressive 8.6% of visits to the mall complex in 2024, outpacing some of the mall’s official anchors like DICK’s Sporting Goods, Macy’s, and JCPenney. Still, the onsite Target drew even larger crowds at 14.4% of visits.
A similar pattern emerged at Northridge Fashion Center, where Porto’s Bakery and Cafe captured a notable 15.6% of visits to the complex in 2024 – more than some of the center’s traditional department stores.
These examples underscore the potential for dining chains, which typically require less space, to serve as micro-anchors by consistently attracting outsized crowds – a key consideration for mall operators looking to sustain visitor traffic.
Choosing a Mall Anchor in 2025
Refocusing on tenants’ actual foot traffic contributions also opens the door to a more flexible and dynamic approach to anchor selection and management – one that considers each venue’s unique visitation patterns.
The Weekend/Weekday Divide
Seasonal factors, for example, can make certain anchors more powerful at specific times of the year, while different venues shine on particular days of the week.
At Jordan Creek Town Center in West Des Moines, Iowa, for instance, Scheels and Costco each delivered just under 20.0% of the complex’s overall visits in 2024. But the two retailers’ daily patterns differed significantly: Scheels saw bigger crowds on weekends, while Costco was the primary weekday destination.
Understanding differences like these can help operators optimize their tenant mix to maintain a balanced flow of shoppers throughout the week.
Another example of the impact of differing weekday traffic patterns is offered by the impact of mall-based Chick-fil-A locations on the distribution of mall visits throughout the week.
Despite its relatively small size, Chick-fil-A draws substantial traffic to malls. And after adding Chick-fil-A locations, both Northridge and Miller Hill Malls saw meaningful drops in the share of visits to the centers taking place on Sundays – even as the wider indoor mall segment saw slight upticks.
Recognizing this trend could prompt mall operators to compensate by adding more weekend-friendly traffic drivers – or to lean into this distinction by taking additional steps to bolster the mall’s role as a go-to weekday destination.
The Early-Morning Fitness Advantage
The power of different mall traffic magnets also varies throughout the day. Increasingly, shopping centers are turning to fitness centers as experiential anchors. And since many people work out early in the morning, these gyms are having a significant impact on the distribution of mall visits across dayparts.
The addition of gyms to Northshore Mall in Peabody, MA and Jackson Crossing in Jackson, MI, for instance, led to a significant rise in visits between 7:00 AM and noon. And though the rest of the stores in these malls typically open at 10:00 or 11:00 AM, this shift presents the centers with a significant opportunity.
By adjusting opening hours to accommodate these early-morning patrons, malls can capitalize on this added traffic, driving up visits and sales for relevant tenants – especially health-focused retailers such as juice bars and sporting goods stores.
Adding Temporary Pop-Ups Into the Mix
Adopting a broader, visit-focused view of anchoring also allows mall operators to apply some of the strategies typically reserved for anchors to non-conventional traffic-generating businesses, to ensure a consistent flow of traffic year-round.
Pop-up stores and events, for example, generally don’t follow the same seasonal trends as other retailers – instead, they generate short-term visit boosts during their runs, whenever in the year that may be. And a visit-focused anchor strategy can leverage some of the perks traditionally reserved for anchor tenants – such as preferential leasing terms – to complement traditional full-time anchors during slower retail periods.
The Barbie Dreamhouse Living Truck Tour is a prime example of a traffic-driving pop-up. By bringing exclusive merchandise to malls across the U.S., the truck generates plenty of buzz, drawing crowds eager to snatch up limited-edition items and immerse themselves in all things Barbie. As a result, malls hosting the tour often see significant visit spikes, with foot traffic surging well above typical Saturday levels. Well-timed pop-ups like these can help balance out traffic throughout the year, offsetting traditional slow periods.
Creating a Bigger Visit Pie
A visit-focused approach to anchor management can also help mall operators assess the potential impact of new tenants on existing stores operating in similar categories. For example, mall owners often worry that new tenants operating in similar categories might cannibalize existing businesses. But a visit-focused anchor approach reveals that a well-chosen addition can sometimes benefit current tenants – especially if they cater to similar audiences.
In February 2020, for instance, value supermarket Aldi opened at Green Acres Commons in Valley Stream, NY – a center that already hosted budget-friendly BJ’s Wholesale Club. While BJ’s visits were relatively flat in 2018 and 2019, they began to rise after Aldi’s opening (and following a pandemic-induced dip). Cross-shopping data also shows that Aldi customers were more likely to visit BJ’s than the average Green Acres patron last year.
This synergy may be due in part to the two retailers’ similar visitor bases: In 2024, the Aldi and BJ’s stores in Green Acres Common drew shoppers with comparable economic profiles. This suggests that overlapping audiences can become a strength if aligned brands attract new shoppers, who then explore multiple stores in the same center.
Visits to BJ's Wholesale Club Took Off After Addition of Aldi to Green Acres Commons – Perhaps Buoyed by Audience Similarity
Visits to Green Acres Commons BJ's Wholesale Club, Compared to Q1 2018 Baseline
Median HHI, 2024*
Cross-Shopping, 2024
*Median HHI based on STI: PopStats dataset combined with Placer.ai data for captured trade areas.
Looking ahead, effective mall anchors will be defined less by physical footprint and more by their capacity to maintain consistent, valuable foot traffic. While traditional department stores remain pivotal, smaller or niche brands can often rival – or surpass – large-format retailers. And by thinking out of the anchor box and choosing tenants that cultivate a balanced visitor flow and align with local preferences, operators can position their centers as true go-to destinations.
Dive into the data to see the trends shaping the grocery space in 2025 and uncover actionable insights for strategic decision-making in the competitive food-at-home market.
May 15, 2025
8 minutes
Key Takeaways:
1. Shoppers are taking more, shorter trips to grocery stores.Over the past 12 months, grocery stores have experienced nearly uniform YoY visit growth. And since COVID, the segment has steadily increased both overall visits and average visits per location – even as average dwell times have consistently declined.
2. Grocery stores are holding ground against fierce competition. Despite growing inroads by discount and dollar stores, wholesale clubs, and general mass retailers like Walmart and Target, grocery stores have maintained their share of the overall food-at-home visit pie over the past several years.
3. Grocery visit share is most pronounced on the coasts. In Q1 2025, grocery stores claimed the majority of food-at-home visits on the West Coast, in parts of the Northeast, Mid-Atlantic, and Mountain Regions, and in Florida and Michigan.
4. Fresh-format, value, and ethnic grocery visit shares are growing at the expense of traditional chains. And in Q1 2025, fresh-format and value grocers outperformed the other sub-segments with positive YoY visit and average visit-per-location growth.
5. Hispanic markets are on the rise. Though the broader ethnic grocery sub-segment was essentially flat YoY in Q1 2025, Hispanic-focused stores recorded increases in both visits and visits per location – and have been steadily growing visits since 2021.
6. Smaller formats for the win. In Q1 2025, smaller-format grocery store locations outpaced mid-sized and larger-format ones, underscoring the power of compact spaces to deliver significant foot traffic gains.
A Study in Resilience
Brick-and-mortar grocery stores face an uncertain market in 2025. Rising food-at-home prices (eggs, anyone?), declining consumer confidence, and increased competition from discounters, superstores, and online shopping channels all present the segment with significant headwinds. Yet even in the face of these challenges, the sector has demonstrated remarkable resilience – growing its foot traffic and holding onto visit share.
What strategies have helped the segment navigate today’s tough market? And how can industry stakeholders make the most of the opportunities in the current market? This report draws on the latest location intelligence to uncover the trends shaping grocery retail in early 2025 – highlighting insights to help key players make informed, data-driven decisions on store formats, product offerings, and more.
Growth in Aisle One
The grocery segment has experienced nearly uniform positive year-over-year (YoY) growth over the last 12 months. This sustained performance in the face of inflation and other headwinds highlights the underlying strength of the category.
Visits Up, Dwell Time Down
What is driving this growth? Since 2022, the grocery segment has seen consistent overall visit growth that has outpaced increases in visits per location – a sign that chain expansion has played a key role in the category’s success. But the average number of visits to each grocery store has also been on the rise, indicating that the segment continues to expand without cannibalizing existing store traffic.
At the same time, visitor dwell times have been steadily dropping since 2021. This shift appears to reflect a trend towards multiple, shorter trips by inflation-wary consumers eager to avoid large, costly carts or cherry pick deals across various retailers. Many shoppers may also be placing more bulk orders online and supplementing those deliveries with brief in-store stops for additional items as needed.
The bottom line: Shoppers are taking more grocery trips overall each year, but spending less time in-store during each visit. Operators can respond to this trend by optimizing layouts and promoting “grab-and-go” areas for an even more efficient quick-trip experience.
Still in Stock
Visit share data also shows that despite fierce competition from discount and dollar stores, wholesalers, and general mass retailers, the grocery segment has steadfastly preserved its share of the overall food-at-home visit pie.
Between Q1 2019 and Q1 2025, wholesale clubs and discount and dollar stores increased their share of total food-at-home visits, gains that have come primarily at the expense of Walmart and Target. Meanwhile, grocery outlets have held firm – despite some fluctuations over the years, their Q1 2019 visit share remained essentially unchanged in Q1 2025.
So even as consumers flock to alternative food purveyors in search of lower prices, grocery stores aren’t losing ground – and on a nationwide level, they remain the biggest player by far in the food-at-home shopping space.
A Coastal Advantage
Still, grocery store visit share varies significantly by region. On the West Coast, in parts of the Northeast, Mid-Atlantic, and Mountain regions, and in Florida and Michigan, grocery stores accounted for the majority of food-at-home visits in Q1 2025. Oregon (61.6%) and Washington (59.6%) led the pack, followed by Massachusetts (59.2%), Vermont (58.5%), and California (57.9%). Meanwhile, in West Virginia, Arkansas, South Dakota, Oklahoma, North Dakota, and Mississippi, less than 30% of food-at-home traffic went to grocery stores, with more shoppers in these regions turning to general mass retailers or discounters.
Grocery store operators in lower-grocery-share regions may choose to focus on price competitiveness and convenient store locations to capture more foot traffic from competitors in the space.
Fresh and Frugal on the Rise
Which types of grocery stores are thriving the most? The grocery segment is diverse, encompassing traditional grocery chains like Kroger, Safeway, and H-E-B; budget-oriented value chains such as Aldi, WinCo Foods, Grocery Outlet Bargain Market, and Market Basket; fresh-format specialty brands like Trader Joe’s, Whole Foods, and Sprouts Farmers Market; and numerous ethnic grocers.
Examining shifts in visit share among these various grocery store segments shows that traditional grocery still dominates, commanding over 70.0% of total grocery store foot traffic.
Still, over the past several years, traditional grocers have gradually ceded ground to other segments – especially value chains. Budget grocers saw a temporary surge in visits during the panic-buying days of early 2020 – and have been more gradually gaining visit share since Q1 2023. . Fresh-format banners, which lost ground in 2021 after a Q1 2020 bump, in the wake of COVID, have also been on the upswing and appear poised to capture additional visit share in the coming months and years. And though ethnic grocers still account for a relatively small portion of the overall market, they have slightly increased their visit share, reflecting heightened consumer interest in these specialized offerings.
The Discount and Premium Edge
Recent performance metrics point to a bifurcation in the grocery market similar to that observed in other retail categories. In Q1 2025, fresh-format and value retailers – which appeal, respectively, to the most and least affluent visitor bases – saw the greatest growth in both overall visits and average visits per location.
This trend highlights the power of both value and health-focused quality to motivate consumers in 2025. And grocery players that can meet these needs will be well-positioned for success in the months ahead.
WFH Fresh-Format Lunch Crunch
One factor fueling fresh-format’s success may be its role as a convenient, relatively affordable midday lunch destination for the remote work crowd.
In Q1 2025, consumers working from home accounted for 20.2% of fresh-format grocery stores’ captured market – a significantly higher share than any other analyzed grocery segment. These stores also tended to be busier midday than the other segments. Remote workers may be stopping by to grab a quick bite – and some may be choosing to do their grocery shopping during their lunch break when stores are less crowded.
This finding suggests an opportunity for grocery operators across all segments to develop or enhance in-store salad bars and quick-serve sections to tap into the lunch rush. Likewise, CPG companies may benefit from developing more ready-made, nutritious meal options that align with these midday dining habits.
Salsa Surge
Though the broader ethnic grocery category remained essentially flat in Q1 2025, Hispanic-focused grocers emerged as a sub-segment to watch. Both overall visits and average visits per location to these stores have been on the rise since 2021.
This robust demand presents an opportunity for CPG brands and grocers across segments to expand Hispanic-focused offerings, capturing a slice of this growing market.
Less is More
Finally, store size matters more than ever in 2025. During the first quarter of the year, smaller format grocery store locations (locations under 30K square feet, across different chains) outpaced larger stores with a 3.2% YoY jump in visits, showing that bigger isn’t always better in the grocery store space.
This pattern aligns with the decrease in dwell times noted above – shoppers may be making shorter trips to smaller, more convenient grocery store locations. These quick errands are ideal for picking up a few items to supplement online orders, shopping multiple deals, or sourcing specialty products unavailable at larger grocery destinations. And to lean into this trend, grocery operators might consider testing neighborhood “micro-store” concepts, focusing on curated selections, and offering convenient parking or pickup to match consumer preferences for targeted purchases and quicker trips.
Final Thoughts
Location intelligence reveals a growing, dynamic grocery landscape which is holding its ground in the face of increased competition. Shorter trips, busier lifestyles, and changing work routines are reshaping in-store experiences. And grocery players that refine their store formats, target both lunch and on-the-go shoppers, and adapt to shifting demographics can position themselves to thrive in this competitive sector. As the market continues to evolve, continuous attention to these changing patterns will be key to maintaining and expanding market share.
Dive into the data to explore recent visitation patterns and consumer trends in the fitness space - and uncover potential keys to success, rooted in location intelligence.
May 5, 2025
8 minutes
Key Takeaways
1. Elevated visitor frequency could mean that gym-goers are getting more value out of their memberships and are therefore more likely to stay signed up. Between January and March 2025, all of the gym chains analyzed had a higher share of frequent visitors (those who visited about once a week) than in the equivalent month of 2024.
2. Fitness chains at all price tiers need to be strategic about the value they offer and the amenities that can engage budget-conscious consumers. Between Q1 2022 and Q1 2025, the captured trade area median HHI increased for all fitness subsegments – value-priced, mid-range, and high-end – suggesting that consumers swapped pricier gym memberships for more affordable options.
3. Close attention should be paid to how long visitors spend at fitness chains in order to reduce crowding and bottlenecks. Between Q1 2022 and Q1 2025, the average visit length increased at value-priced, mid-range, and high-end gyms. Floorplan and equipment improvements could be considered, as well as having trainers available to help gym-goers streamline workouts.
4. Gyms can use hourly visit data to better serve their members or use promotions to stabilize facility usage throughout the day. In Q1 2025, high-end chains received a larger share of morning visits while value-priced and mid-range fitness chains received larger shares of evening visits.
Fitness Flexes Its Muscles
Like many industries in recent years, the fitness sector has experienced significant shifts in consumer behavior. From the rise in home workouts during the pandemic to the strain of hyper-inflation, foot traffic trends to gyms and health clubs have been as dynamic as the consumers they serve.
This report leverages location analytics to explore the consumer trends driving visitation in the fitness space and provides actionable insights for industry stakeholders.
Back in Shape: The COVID Recovery
The pandemic drove several shifts in the fitness space. Widespread gym closures led consumers to embrace home-based workouts, while demand for all things fitness increased due to an emphasis on overall health and wellness. This subsequently drove a renewed interest in gym-based workouts as restrictions lifted – even as some consumers remained committed to their home workout routines.
In Q1 2023, visits to fitness chains surpassed Q1 2019 levels for the first time since the onset of the pandemic, a sign that consumers had recommitted to out-of-home fitness. And in Q1 2024 and Q1 2025, fitness chains saw further growth, climbing to 12.8% and 15.5% above the Q1 2019 baseline, respectively.
Several factors have likely driven consumers’ return to gyms and health clubs, including the desire for both social connection and professional-grade facilities difficult to replicate at home. The steep increase in cost of living has likely also played a role, since consumers cutting back on discretionary spending can enjoy multiple outings and a range of recreational activities at the gym for one monthly fee.
Getting Gains: Strong Q1 ‘25
Zooming in on weekly visits to the fitness space in Q1 2025 reveals the industry’s exceptional strength and resilience in the early part of the year.
The fitness industry experienced YoY visit growth nearly every week of Q1 2025 (and 2.4% YoY visit growth overall) with only minor visit gaps the weeks of January 20th, 2025 and February 17th, 2025 – likely due to extreme weather that prevented many Americans from hitting the gym.
And the fitness industry’s weekly visit growth appeared to strengthen throughout the quarter, defying the typical waning of New Year's resolutions. This could indicate that gym visits haven't plateaued and that consumers are demonstrating greater commitment to their fitness routines compared to last year.
Increasing Reps: Visitor Frequency Up At Leading Chains
Diving into visitation patterns for leading fitness chains highlights how increased visitor frequency drove foot traffic growth in Q1 2025.
Fitness chains tend to receive the most visits during the first months of the year as consumers recommit to health and wellness in their post-holidays New Year’s resolutions. And not only do more people hit the gym – analyzing the data reveals that gym-goers also typically work out more frequently during this period. Zooming in on 2025 so far suggests that consumers are especially committed to their fitness routines this year: Leading gyms saw an increase in the proportion of frequent visitors (4+ times a month) in Q1 2025 compared to the already significant percentage of frequent visitors in the first quarter of 2024.
Elevated visitor frequency could mean that gym-goers are getting more value out of their memberships than last year, and are therefore more likely to stay signed up throughout the year.
At the same time, the data also reveals that – contrary to what may be expected – a fitness chain’s share of frequent visitors appears to be independent of the cost of membership associated with the club: Life Time, a high-end club, and EōS Fitness, a value-priced gym, had the highest shares of frequent visitors between January 2024 and March 2025. This suggests that factors other than cost, such as location convenience, class offerings, community, or individual motivation, might be more influential in driving frequent gym attendance.
Fitness Clubs at Different Price Points
Segmenting the fitness industry by membership price tiers – value-priced, mid-range, and high-end – can reveal further insights on current consumer behavior around out-of-home fitness.
Household Income Bulks Up
In Q1 2025, the captured market* median household income (HHI) was higher than the nationwide median HHI ($79.6K/year) across all price tiers – suggesting that even value-priced fitness chains are attracting a relatively affluent audience. This could indicate that gym memberships are somewhat of a luxury and that consumers from lower-income households gave up their gym memberships altogether as they tightened their purse strings.
Analyzing the historical data since Q1 2022 also reveals that the captured market median HHI has risen consistently over the past couple of years with the largest median HHI increase observed in the captured trade areas of high-end fitness chains. This suggests that middle-income households – that are more sensitive to the rising cost of living – likely swapped pricier gym memberships for more affordable options in recent years.
These metrics indicate that fitness chains at all price tiers need to think strategically about the value they offer and the amenities that can engage budget-conscious consumers who are carefully weighing every expenditure.
*Captured trade area is obtained by weighting the census block groups (CBGs) from which the chain draws its visitors according to their share of visits to the chain and thus reflects the population that visits the chain in practice.
Average Stay Increases
Fitness clubs of all types need to manage their capacity to ensure health and safety standards and a positive experience for members. And understanding the average amount of time visitors spend at the gym can help fitness chains at every price point keep their finger on the pulse of their facilities.
Between Q1 2022 and Q1 2025, the average visit length increased at value-priced, mid-range, and high-end gyms. Value-priced gyms experienced the largest increase in average visit length – from 72.4 minutes in Q1 2022 to 74.0 minutes in Q1 2025 – perhaps due to their relatively lower-income visitors spending more time enjoying club amenities after cutting back on other forms of recreation. Meanwhile, mid-range and high-end gyms experienced relatively modest increases in average visit length, which were higher to begin with – likely due to their ample class and spa offerings and overall inviting, upscale spaces.
Elevated average visit length could mean that visitors are well-engaged and less likely to cancel their memberships. But as overall gym visits are on the rise, fitness chains may want to pay close attention to how long visitors spend at the facility. Floorplan and equipment improvements could be considered in order to reduce bottlenecks, and having trainers available to instruct on equipment usage and workout technique could help gym-goers streamline workouts.
Workouts on a Schedule
Along with average visit length, understanding the daypart in which they receive the most visits is another way that fitness chains can improve efficiency and prevent overcrowding. And analysis of the hourly visits to fitness sub-segments revealed that some fitness segments receive more morning visits while others are more popular in the evenings.
In Q1 2025, high-end chains received a larger share of visits between 6 a.m. and 9 a.m. (19.7%) than value-priced and mid-range fitness chains (11.6% and 11.8%, respectively). Meanwhile, value-priced and mid-range fitness chains received larger shares of visits between 6 p.m. and 9 p.m. (21.9% and 22.2%) than high-end chains (16.5%).
Gyms can leverage this data to better serve members, for instance by scheduling more classes during peak hours. Value-priced and mid-range gyms, which saw a larger disparity between shares of morning and evening visits in Q1 2025, might also consider incentivizing off-peak usage through discounted morning memberships or early-bird snack bar deals.
Fitness Continues to Grow
The fitness space appears to be in good shape in 2025. Visits have made a full recovery from the pandemic era and still continue to grow, indicating strong consumer demand for out-of-home workouts. And using location intelligence to analyze the behavior and demographics of visitors to gyms at different price points can help identify opportunities for driving even greater success.


.svg)