Recent survey data shows that many employees - and companies - prefer a hybrid work approach. But what’s happening on the ground? We checked in with our Nationwide and regional Office Indexes to find out.
Lila Margalit
May 8, 2024
3 minutes
The Placer.ai Nationwide Office Building Index: The office building index analyzes foot traffic data from some 1,000 office buildings across the country. It only includes commercial office buildings, and commercial office buildings with retail offerings on the first floor (like an office building that might include a national coffee chain on the ground floor). It does NOT include mixed-use buildings that are both residential and commercial.
Recent survey data shows that while most people don’t want to go back to the office five days a week, they also don’t want to be fully remote. Many employees – and companies – prefer a middle-of-the-road approach that balances flexibility with opportunities for in-person engagement, learning, and collaboration.
But what’s happening on the ground? We checked in with our Nationwide and regional Office Indexes to find out.
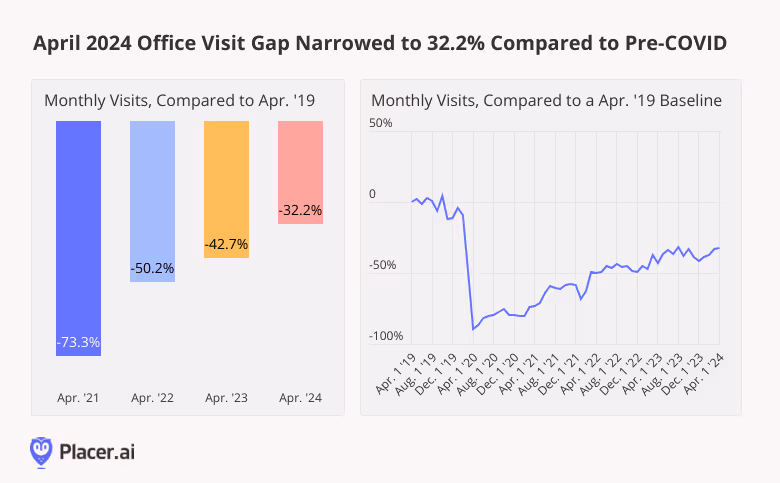
Office Visit Gap Continues to Narrow
Last month saw a continuation of the positive office recovery momentum observed in February and March 2024. April 2024 office visits were just 32.2% below what they were in the equivalent period of 2019 (pre-pandemic), and nearly the highest they’ve been since COVID. Comparing monthly visits to an April 2019 baseline also shows that April 2024 was outperformed only by August 2023 – a rare month featuring 23 business days. (April 2024 had 22 business days – as did April 2019).
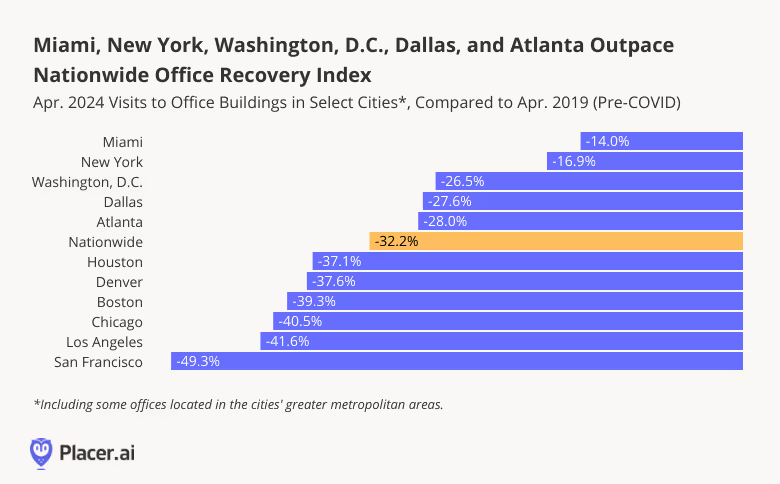
Miami, New York, Washington, D.C., Dallas, and Atlanta Outperform Nationwide Baseline
Drilling down into the data for major regional hubs shows Miami and New York solidifying their office recovery leads with respective pre-COVID visit gaps of just 14.0% and 16.9%. But these weren’t the only cities to shine: Washington, D.C., Dallas, and Atlanta also outperformed the nationwide baseline – and like Miami, experienced their single busiest in-office months since COVID.
San Francisco Wins Again
All the analyzed regional hubs saw significant YoY office visit growth – with the prize once again going to San Francisco, where visits were up 26.0%. Though San Francisco still lags significantly behind other regional hubs compared to pre-COVID, the city’s persistent YoY office visit growth may signal a light at the end of the Golden Gate City’s commercial real estate tunnel.
To be fair, April 2023 had two less business days than April 2024 – a fact that may have served to amplify YoY growth trends across the board. But even accounting for this discrepancy, last month’s strong office recovery was a particularly strong one – showing that RTO remains very much a work in progress.
Looking Ahead
The benefits and drawbacks of remote work are still being debated. But no matter how you slice it, spending some time in the office each week seems to have its benefits. As companies and employees continue to negotiate the new hybrid status quo, office visit patterns will continue to shift nationwide.
Follow Placer.ai for more data-driven office insights.
We dove into the latest foot traffic analytics for leading movie theater chains – AMC Theatres, Regal Cinemas, and Cinemark – to uncover how recent consumer behavior and visitor demographics are setting the stage for the cinema category’s next chapter.
Ezra Carmel
May 7, 2024
3 minutes
We dove into the latest foot traffic analytics for leading movie theater chains – AMC Theatres, Regal Cinemas, and Cinemark – to uncover how recent consumer behavior and visitor demographics are setting the stage for the cinema category’s next chapter.
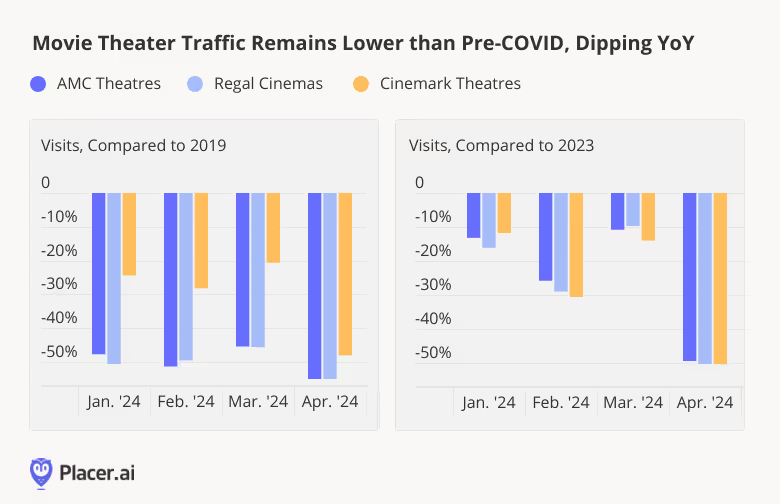
Visits in 2024: An Underwhelming Sequel So Far
Cinemas have yet to reclaim their pre-COVID glory – and during the first few months of 2024, visits to AMC and Regal, and to a lesser extent Cinemark, remained substantially below 2019 levels. While some of these visit gaps can be attributed to exhibitors downsizing their real estate portfolios, the rise in at-home entertainment continues to impact pre-pandemic foot traffic comparisons.
In addition, since the pandemic, blockbuster releases have taken on even greater importance as drivers of movie theater visit spikes. And in early 2024, a relative absence of new blockbusters took its toll on theater operators’ performance. Between January and April 2024, cinema leaders saw YoY visit dips – likely attributable in part to delayed releases. And smash-hit titles that drove box-office success in early 2023 – including Avatar: The Way of Water, Ant Man, and The Super Mario Bros. Movie – helped set the stage for challenging YoY comparisons.
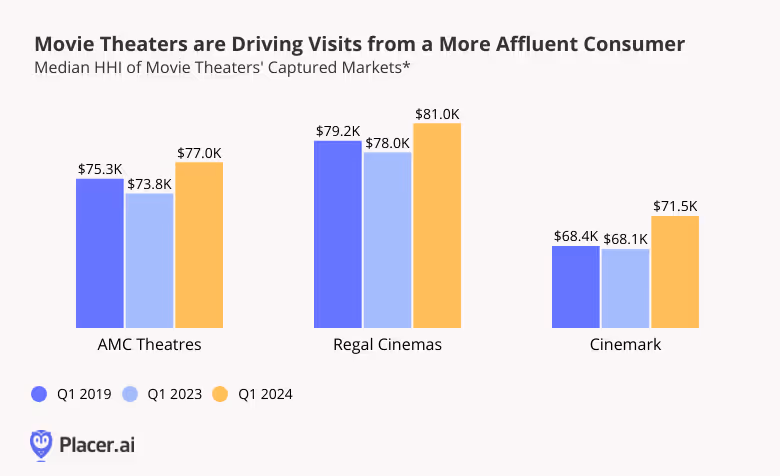
More High-Income Theater Visitors
Despite these visit gaps, analysis of changing visitor demographics suggests that there remain a variety of ways for theater operators to succeed.
Analyzing cinema leaders’ captured markets with demographics from STI: PopStats shows that today’s movie-goers are more affluent than they were before COVID. After dipping in Q1 2023, the median household incomes (HHIs) of AMC, Regal Cinema, and Cinemark’s captured markets spiked in Q1 2024, surpassing the chains’ own pre-pandemic benchmarks. This shift may be due in part to discretionary spending cutbacks by less affluent consumers – who may be particularly inclined to hold off on going to the movies when there are no big releases on offer.
For exhibitors, the increase in visitors’ spending power presents an important opportunity: Affluent movie-goers are likely to spend more on revenue-boosting concessions and premium formats, a boon for theater chains at a time when visit gaps linger.
Looking Ahead
Five years after COVID sent movie theaters into a tailspin, the category is holding its own. Though routine visits remain lower than they were before the pandemic, a shifting customer base continues to provide operators with new avenues for success.
For more data-driven entertainment insights, visit Placer.ai.
This blog includes data from Placer.ai Data Version 2.0, which implements improvements to our extrapolation capabilities, adds short visit monitoring, and enhances visit detection.
The fitness industry has experienced steady growth in recent years, propelled by consumers’ prioritization of health and wellness – and gyms across the country are benefiting. We take a closer look at the data to see how the segment is performing relative to last year.
Bracha Arnold
May 6, 2024
3 minutes
The fitness industry has experienced steady growth in recent years, propelled by consumers’ prioritization of health and wellness – and gyms across the country are benefiting.
So with 2024 underway, we dove into the data to examine the segment’s performance during the first months of the year. Did Fitness’ strong January showing persist beyond the season of new year’s resolutions? And how did major gym chains – including Planet Fitness, Life Time, Crunch Fitness, and EōS – perform in Q1 2024 relative to last year?
Let’s Get Physical
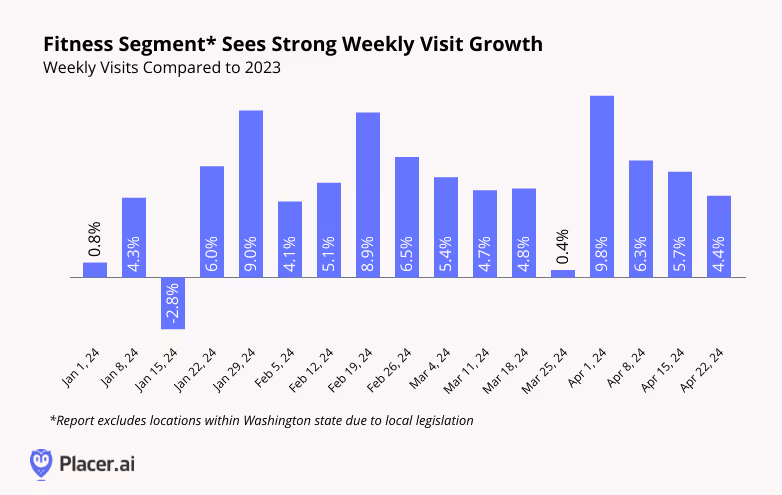
Fitness has been a consistent success story over the past few years, and the category is showing no signs of slowing down. Year-over-year (YoY) visits to the industry were up nearly every week between January and April 2024, with the sole exception of the week of January 15th, when an Arctic blast saw many people hunkering down indoors. And visits remained slightly elevated even during the week of March 25th, when Easter celebrations likely distracted many people from their gym goals – an impressive feat given the comparison to a non-holiday week in 2023.
Flexing Into 2024
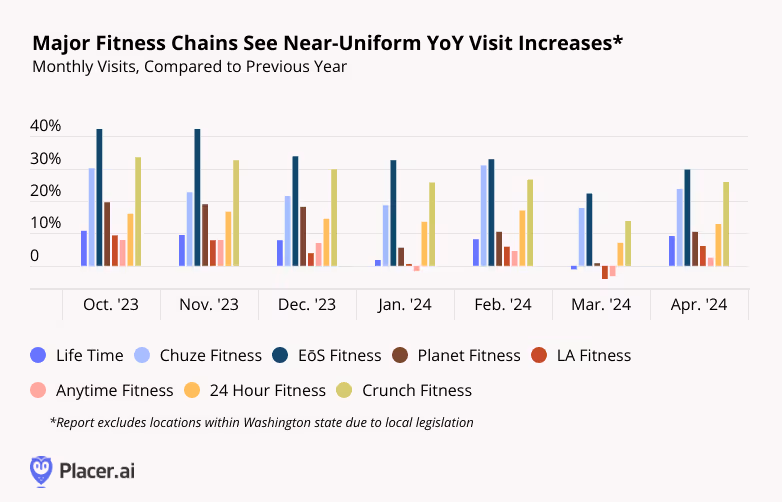
Drilling down into visit trends for eight major fitness chains shows that in today’s robust fitness environment, there’s enough demand to sustain a variety of chains: Both premium and mid-range options like Life Time and LA Fitness as well as more affordable choices like Planet Fitness and Crunch Fitness saw visits increase or remain steady for most of Q1 – and all saw YoY visit bumps in April.
Getting Pumped
Some gym-goers hit the gym several times a week and spend hours working out, while others have a more relaxed get-in-shape schedule. And analyzing leading chains’ visitation patterns shows that gyms are finding success by catering to fitness buffs’ varying preferences.
Perhaps unsurprisingly, the data reveals a strong correlation between a chain’s share of frequent visitors (i.e. those visiting the gym eight or more times in a month), and a chain’s share of visitors staying longer than 90 minutes. While some clubs, including Life Time and EōS appear to attract highly dedicated gym-goers, others, including Planet Fitness and Anytime Fitness, seem to draw more casual visitors.
The fact that both fitness chains attracting frequent visitors for longer workouts and gyms that cater to more casual exercisers who spend less time in the gym during each session are seeing positive visitation trends indicates that there are plenty of models for fitness success in 2024.
The Final Weigh-In
One thing seems clear – interest in gyms is not going away anytime soon. Visits continue to show YoY growth, and the industry is full of options for every kind of fitness enthusiast. Whether opting for occasional visits or adhering to a structured workout regimen – there’s something for everyone.
To stay ahead of the latest retail and fitness developments, visit placer.ai/blog.
Following a busy week of Q1 2024 updates several restaurant chains, the key question facing operators is whether menu price increases the past several years have forced consumers into alternative food retail channels. Several restaurant chains--most notably McDonald’s–highlighted a more “discriminating” consumer during their quarterly updates. According McDonald’s CEO Chris Kempczinski on the company’s Q1 2024 update this week: “U.S. consumers continued to be even more discriminating with every dollar that they spend as they faced elevated prices in their day-to-day spending which is putting pressure on the QSR industry.” In turn, this has resulted in flat-to-declining industry traffic in the U.S. during the quarter. Looking at year-to-date visitation trends across the different restaurant categories, we see a weak start to the year due to inclement weather, followed by a rebound to low-single-digit growth for the limited-service categories (QSR and fast casual) and low-single-digit declines for the full-service restaurant chains.
As we discuss throughout this week’s Anchor report, consumers will likely remain discriminating over the next several quarters. As such, we expect a continuation of the channel shifts we’ve been witnessing across the broader food retail sector. According to our data, the QSR category saw a +5% increase in visits from 2019-2023, while the full-service restaurant category saw a -8% decrease in visits (partly explained by the permanent closure of many smaller, regional full-service dining chains). Conversely, the grocery, superstore, convenience store, and dollar/discount stores have all seen meaningfully higher visit growth over the same period (as our friends at Restaurant Business have also called out), indicating these channels are taking share from the restaurant industry.
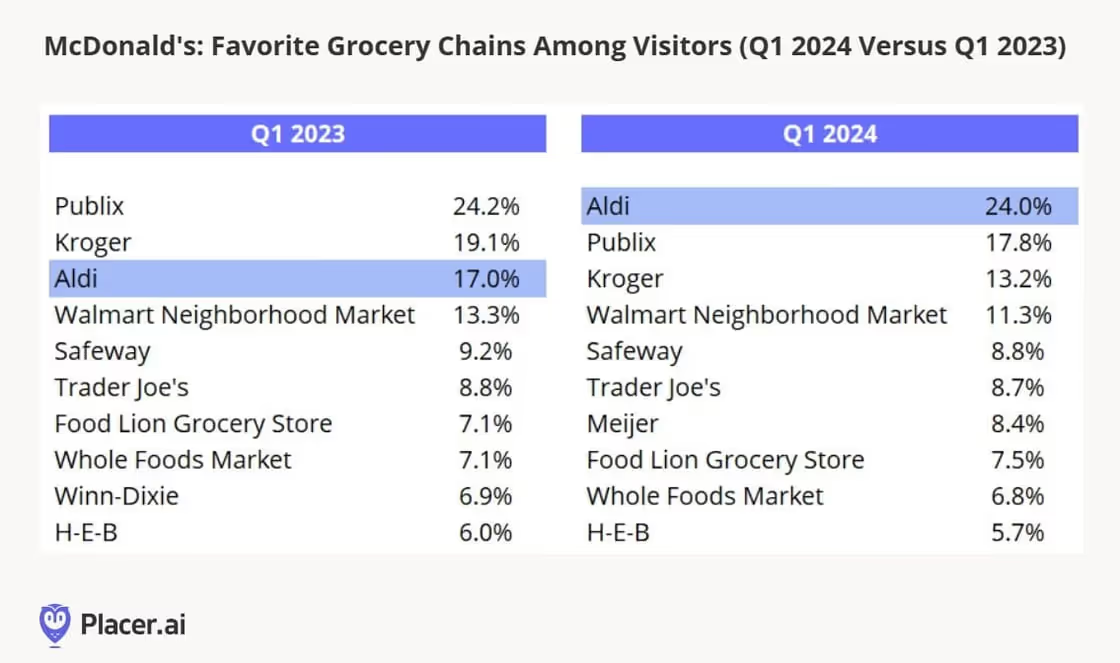
Looking at McDonald’s cross-visitation trends during the quarter, we see further evidence of this shift. We’ve compared the favorite grocery chains of McDonald’s visitors in Q1 2024 to Q1 2023 below. We see a material increase in the percentage of McDonald’s visitors that visited an Aldi location year-over-year–24% versus 17% in the year ago period. We also see a decrease in percentage of visits to most conventional grocery chains.
Not surprisingly, McDonald’s plans to accentuate its value offerings in the coming quarters. On its update call, management noted that 90% of its U.S. locations offer meal bundles for $4 or less and that it has been running several promotions through its digital app. The company also noted the need to align around a strong national value proposition so that the company can use its tremendous media scale to drive high consumer awareness. It will likely take time for McDonald’s to organize around its value platform, but once it does start to promote its value offerings on a nationwide basis, we would expect much of the rest of the QSR category to follow suit.
This weekend, Formula 1 is once again ready to take the track in the United States, this time at the Miami Grand Prix on Sunday. The Miami Grand Prix is the first U.S. race in the 2024 calendar, followed by the U.S. Grand Prix in Austin, Texas and the Las Vegas Grand Prix in the fall.
America has grown into the new epicenter of the sport and is the only country besides Italy to host multiple races in a singular season. Not only does the U.S. host races, but countless American retail, tech, CPG and hospitality brands serve as team sponsors, including Marriott, Rokt, Tommy Hilfiger, Google, eBay, Coca Cola and more. For brands looking at the consumption habits of younger, more affluent consumers, the rise of Formula 1 in the U.S. can help unlock insights on this group. Credit for Formula 1’s exponential growth in popularity is largely due to the Netflix docuseries, Drive to Survive, which just released its sixth season in the first quarter of 2024. According to Netflix, over 90 million hours of the program were watched throughout the first half of last year. The immense popularity of the show and its behind the scenes access to the luxurious world of F1 generated a large demand for the sport by Americans, and the appetite for home grown F1 races where U.S. based fans can participate is palpable.
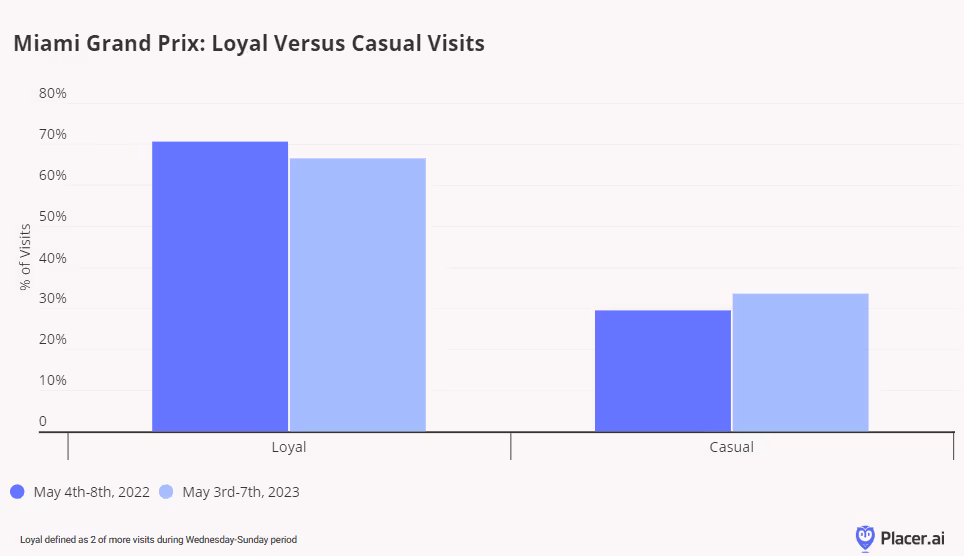
2024 is the third running of the Miami Grand Prix, held around Hard Rock Stadium, with the event debuting in 2022. According to Placer.ai data, traffic at the event, which usually runs Thursday-Sunday, in 2023 increased 3% compared to 2022. Usually during grand prix weekends, visitors have the option to purchase single or multi-day passes, and our data (as shown below) indicates that there were fewer repeat visits in 2023 compared to 2022; consumers may have chosen single day passes more often or made the event a part of a larger weekend in Miami. The highest number of visits occurred on Sunday each year, which aligns with the fact that the actual race takes place that day, with practice sessions and qualifying taking place on Friday and Saturday respectively.
Despite slightly fewer loyal visits during the weekend, the time spent at the event increased, with an average of 179 minutes, up 4% year-over-year. With consumers spending around three hours at the venue, there is a huge opportunity for American CPG and retail companies to engage with this captive audience.
The U.S. Grand Prix, held annually in Austin, has seen similar success from the influx of American F1 fans. Traffic at the 2023 event weekend grew by 38% compared to 2019. 2022 saw peak event attendance, most likely due to a competitive and exhilarating end to the 2021 season that bled into the next year. 2023 also saw the highest percentage of three-day visits during the weekend, highlighting that most U.S. Grand Prix attendees visit the track multiple days for the various race weekend events.
While the growth of the event itself is impressive, the change in visitor demographics provides an even more striking opportunity for American retailers and brands. 2023 brought the highest percentage of visits from young professionals and young urban singles compared to all other segments in 2023. Young professionals also grew to 36% of visits in 2023 from less than 30% in 2019, showcasing the rise in younger and more affluent visitors. Both the popularity of Netflix coupled with the increase in influencer marketing brand trips to races may both have contributed to this shift over time.
It’s clear that Formula 1’s growing popularity has no doubt fueled race expansion stateside and that has been able to capture the attention of the elusive younger consumer, especially those with disposable income. Brands, licensees and retailers have all jumped on the opportunity to collaborate with drivers, teams and race weekends to tap into this growth market. Sporting events are a highly competitive landscape, excuse the pun, but the intersection of sports and content have paved the way for Formula 1’s success in the U.S.
Last week, Chipotle’s Q1 2024 update featured a number of positives, including visitation trends that outperformed the broader restaurant category and strong contribution from new store openings. More than 5% of the company’s 7% comparable sales growth during the quarter was driven by transaction growth, and year-over-year visitation trends have accelerated thus far in April. (Recall that our year-over-year visitation data includes contribution from stores opened during the past year as well as improvements in visits per location).
Impressively, there were multiple sources driving Chipotle’s transaction growth during the quarter. The company’s strong track record for menu innovation under CEO Brian Niccol continued during the most recent quarter, with the company spotlighting Barbacoa and the return of Chicken Al Pastor as a limited time offer. Management will continue to explore new menu additions, and is currently developing a new product pipeline for the next 18-24 months.
While menu innovation is important, it’s clear that throughput (the amount of customers that can be served with Chipotle’s assembly line process) is becoming a major factor in visitation traffic outperformance. We believe this has been driven by lower employee turnover rates—the company noted that it is experiencing the lowest turnover rates since Niccol joined the company in March 2018. According to management, throughput reached the highest levels in four years because of more consistent staffing, which aligns with our visit per location data for the past five years (below).
Chipotle noted that its throughput improved by nearly 2 entrees in its peak 15 minutes compared to last year with each month showing an acceleration. According to the company, “the restaurants run more smoothly as our teams are properly trained and deployed, which allows them to keep up with demand without stress. This leads to more stability and therefore more experienced teams that execute better every day, and this can be seen in our latest turnover data which is at historically low levels.” Our data also shows that visitation trends are improving during its peak hours, but that its peak hours are also changing. Historically, the hours between 12:00 PM-2:00 PM have represented Chipotle’s most frequently visited hours, but post-pandemic, we’ve seen visits shift to the 6:00 PM-8:00 PM timeframe (below). Return-to-office trends partly explain these trends, as do Chipotle’s push into smaller, more suburban/rural markets.
When we look at visit per location trends by hour, we see that most of the improvement during the Q1 2024 compared to Q1 2023 took place during the later afternoon and evening dayparts.
Looking ahead, Chipotle sees an opportunity to improve peak hour throughput, including adjusting the cadence of digital orders to better balance the deployment of labor (thus eliminating the need to pull a crew member from the front makeline to help the digital makeline during peak periods). The company also plans to bring back a coaching tool for its associates that it had in place prior to the pandemic. With more and more retailers embracing generative AI to help educate and train their employees-–a trend we heard consistently at this week’s Analytics Unite conference–we would expect Chipotle to also adopt generative AI with its updated coaching tool, potentially unlocking greater throughput improvements in the process.
Dive into the data to find out how the dining category is performing in 2025, which segments are coming out on top, and how dining consumer behavior has shifted in recent years.
June 26, 2025
10 minutes
Key Takeaways:
1. Overall dining traffic is mostly flat, but growth is concentrated in specific areas.
While nationwide dining visits were nearly unchanged in early 2025, western states like Utah, Idaho, and Nevada showed moderate growth, while states in the Midwest and South, along with Washington D.C., saw declines.
2. Fine dining and coffee chains are growing through expansion, not just busier locations.
These two segments were the only ones to see an increase in total visits, but their visits-per-location actually decreased, indicating that opening new stores is the primary driver of their growth.
3. Higher-income diners are driving the growth in resilient categories.
The segments that saw visit growth—fine dining and coffee—also attracted customers with the highest median household incomes, suggesting that affluent consumers are still spending on dining despite economic headwinds.
4. Remote work continues to reshape dining habits.
The share of suburban customers at fine dining establishments has increased since 2019, while it has decreased for coffee chains. This reflects a shift towards "destination" dining closer to home and away from commute-based coffee runs.
5. Limited-service restaurants own the weekdays; full-service restaurants win the weekend.
QSR, fast casual, and coffee chains see the majority of their traffic from Monday to Friday, whereas casual and fine dining see a significant spike in visits on weekends.
6. Each dining segment dominates a specific time of day.
Consumer visits are highly predictable by the hour: coffee leads in the early morning, fast casual peaks at lunch, casual dining takes the afternoon, fine dining owns the dinner slot, and QSR captures the late-night crowd.
Year-over-Year Dining Traffic Trends
Dining Visits Mostly Up in the West, Down in Most of Midwest and East
Overall dining visits held relatively steady in the first five months of 2025, with year-over-year (YoY) visits to the category down 0.5% for January to May 2025 compared to the same period in 2024. Most of the country saw slight declines (less than 2.0%), though some states and districts experienced larger drops: Washington, D.C, saw the largest visit gap (-3.6% YoY), followed by Kansas and North Dakota (-2.9%), Arkansas (-2.8%), Missouri and Kentucky (-2.6%), Oklahoma (-2.1%), and Louisiana (-2.0%).
Still, there were several pockets of moderate dining strength, specifically in the west of the United States. January to May 2025 dining visits in Utah, Idaho, and Nevada increased 1.8% to 2.4% YoY, while the coastal states saw traffic rise 0.6% (California) to 1.2% (Washington). Vermont also saw a slight increase in dining visits (+1.9%).
Coffee & Fine Dining See Strongest Overall Visit Growth
Diving into visit trends by dining segment shows that fine dining and coffee saw the strongest overall visit trends, with visits to the segments up 1.3% and 2.6% YoY, respectively, between January and May 2025. But visits per location trends were negative for both segments – a decline of 0.8% YoY for fine dining and 1.8% for coffee during the period – suggesting that much of the visit strength is due to expansions rather than more crowded restaurants and coffee shops.
In contrast, full-service casual dining saw overall visits decrease by 1.5%, while visits per location remained stable (+0.2%) YoY between January and May 2025. Several casual dining chains have rightsized in the past twelve months – including Red Lobster, TGI Fridays, and Outback Steakhouse – which impacted overall visit numbers. But the data seems to show that their rightsizing was effective, as the remaining locations successfully absorbed the traffic and maintained performance levels from the previous year. And the monthly data also provides much reason for optimism, with May traffic up both overall and on a visit per location basis – suggesting that the casual dining segment is well positioned for growth in the second half of 2025.
Meanwhile, QSR and fast casual chains saw similar minor visits per venue dips (-1.5% and -1.2%, respectively). At the same time, QSR also saw an overall visit dip (-0.8%) while traffic to fast casual chains increased slightly (+0.3%) – suggesting that the fast casual segment is expanding more aggressively than QSR. But the two segments decoupled somewhat in May, with overall traffic and visits per venue to fast casual chains up YoY while traffic remained flat and visits per venue fell slightly for QSR – perhaps due to the relatively greater affluence of fast casual's consumer base.
Dining Demographics
Visitor Income Levels Hold Steady in Most Segments
Analyzing the income levels of visitors to the various dining segments over time shows that each segment followed a slightly different trend – and the differences in visitor income may help explain some of the current traffic patterns.
The only three segments with YoY visit growth – casual dining, fine dining, and coffee – also had the highest captured market median household income (HHI). Although the median HHI in the captured market of upscale and fine dining chains fell after COVID, it has risen back steadily over time and now stands at $98.0K – slightly higher than the $97.1K median HHI between January to May 2019. This may explain the segment's resilience in the face of wider consumer headwinds. Meanwhile, the median HHI at fast casual and coffee chains has fallen slightly, perhaps due to aggressive expansions in the space – including Dave's Hot Chicken and Dutch Bros – which likely broadened the reach of the segments, driving visits up and trade area median HHI down.
Like fine dining, casual dining also saw its trade area median HHI increase slightly over time – but the segment has still been facing visit dips. This could mean that, even though consumers trading down to casual dining may have boosted the trade area median HHI for the segment, it still might not have been enough to make up for the customers lost to tighter budgets.
The QSR segment saw its trade area median HHI remain remarkably steady – and visits to the segment have also been quite consistent – staying between $70.6K and $70.9K between 2019 and 2025 – which may explain why the segment's visits remained relatively stable YoY.
Suburban Dining Patterns
Diving into the psychographic segmentation shows that, although the fine dining segment attracted visitors from the highest-income areas between January and May 2025, fast casual chains drew the highest share of visitors from suburban areas, followed by casual dining and coffee. QSR attracted the smallest share of suburban visitors, with just 30.5% of the category's captured market between January and May 2025 belonging to Spatial.ai: PersonaLive suburban segments.
But looking at the data since 2019 reveals small but significant changes in the shares of suburban audiences in some categories' captured markets. And although the percentage changes are slight, these represent hundreds of thousands of diners every year.
The data shows that shares of suburban segments in the captured markets of fine dining chains have increased, while their share in the captured market of coffee chains has decreased. The shares of suburban visitors to QSR, fast casual, and casual chains have remained relatively steady.
This may suggest that the COVID-19 pandemic and the subsequent rise of remote and hybrid work models are still impacting consumer dining habits, benefiting destination-worthy experiences in suburban locales such as fine dining chains while reducing the necessity of daily coffee runs that were often tied to commuting and office work. Meanwhile, the stability in QSR, fast casual, and casual dining segments could indicate that these categories continue to meet consistent suburban demand for convenience and everyday dining, largely unaffected by the redistribution seen in the fine dining and coffee sectors.
Dining Consumer Behavior Trends
Although QSR, fast casual, casual dining, fine dining, and coffee all fall under the wider dining umbrella, the data shows distinct consumer behavior patterns regarding visits to these five categories.
Limited Service Leads Weekday Visit Share, Full Service Rules the Weekend
Limited service segments, including QSR, fast casual, and coffee tend to see higher shares of visits on weekdays, while full service segments – casual dining and fine dining – receive higher shares of weekend visits. Diving deeper shows that QSR has the largest share of weekday visits, with 72.3% of traffic coming in between Monday and Friday, followed by fast casual (69.8% of visits on weekdays) and coffee (69.4% of visits on weekdays.) Looking at trends within the work week shows that QSR receives a slightly larger visit share between Monday and Thursday compared to the other limited service segments. Meanwhile, coffee seems to receive the smallest share of Friday visits – 16.3% compared to 17.0% for fast casual and 17.2% for QSR.
On the full-service side, casual dining and fine dining chains have relatively similar shares of weekend visits (39.0% and 38.8%, respectively), but fine dining also sees an uptick of visits on Fridays (with 19.1% of weekly visits) as consumers choose to start the weekend on a festive note.
Each Segment Owns a Different Daypart
Hourly visit patterns also show variability between the segments. Coffee is the unsurprising leader of early visits, with 14.6% of visits taking place before 8 AM and, almost two-thirds (64.9%) of visits taking place before 2 PM. Fast casual leads the lunch rush (29.4% of visits between 11 AM and 2 PM), casual dining chains receive the largest share of afternoon (2 PM to 5 PM) visits, and fine dining chains receive the largest share of dinner visits, with almost 70% of visits taking place between 5 PM and 11 PM. QSR leads the late night visit share – 4.1% of visits take place between 11 PM and 5 AM – followed by casual dining chains (3.2% late night and overnight visit share), likely due to the popularity of 24-hour diners.
This suggests that each dining segment effectively "owns" a different part of the day, from the morning coffee ritual and the quick lunch break to the leisurely evening meal and late-night cravings.
Shorter Visits in Most Segments
An analysis of average visit duration also reveals a small but lasting shift in post-pandemic dining behavior. Between January and May 2025, the average dwell time for nearly every dining segment was shorter than during the same period in 2019. This efficiency trend is evident across limited-service categories like QSR, fast casual, and coffee shops, suggesting a continued emphasis on speed and convenience.
The one notable exception to this trend is upscale and fine dining, where the average visit duration has actually increased compared to pre-COVID levels. This may suggest that, while visits to most segments have become more transactional, consumers are treating fine dining more as an extended, deliberate experience, reinforcing its position as a destination-worthy occasion.
Dive into the data to see how consumer response to major promotional events – from Black Friday and the back-to-school shopping rush to brand-crafted LTOs – varies by market.
June 19, 2025
Key Takeaways
1. The Midwest is the only region where Black Friday retail visits outpace Super Saturday.
But several major Midwestern markets, including Chicago and Detroit, actually see higher shopper turnout on Super Saturday.
2. Holiday season demographic shifts also vary across regions.
Nationwide, electronics stores see a slight uptick in median household income (HHI) in December – yet in certain markets, electronics retailers such as Best Buy see a drop in captured market median HHI during this period.
3. Back-to-school shopping starts earliest for clothing and office supplies retailers in the South Central region, likely tied to earlier school schedules.
But back-to-school visits surge higher for these retailers in the Northeast later in the season.
4. The share of college students among back-to-school shoppers varies by region.
In August 2024, “Collegians” made up the largest share of Target’s back-to-school shopping crowd in New England, and the smallest in the West.
5. Mother’s Day drives the biggest restaurant visit spikes in the Middle Atlantic Region, while Father’s Day sees its biggest boosts in the South Atlanticstates.
Mother’s Day diners also tend to travel farther to celebrate, suggesting an extra effort to treat mom.
6. Western states proved particularly responsive to McDonald’s recent Minecraft promotion.
During the week of A Minecraft Movie’s release, the promotion drove significantly higher visit spikes in the West than in the Eastern U.S.
Zooming in on Local Trends
Retailers rely on promotional events to fuel sales – from classics like Black Friday and back-to-school sales to unique limited-time offers (LTOs) and pop-culture collaborations. Yet consumer preferences and behavior can vary significantly by region, making it critical to tailor campaigns to local markets.
This report dives into the data to reveal how consumers in 2025 are responding to major retail promotions, exploring both broad regional trends and more localized market-level nuances. Where is Black Friday most popular, and which areas see a bigger turnout on Super Saturday? Where are restaurants most packed on Mother’s Day, and where on Father’s Day? Which region kicks off back-to-school shopping – and where are August shoppers most likely to be college students? And also – which part of the country went all out on McDonald’s recent Minecraft LTO?
Read on to find out.
The Holiday Season: A Regional Story
Promotions aimed at boosting foot traffic on key holiday season milestones like Black Friday and Super Saturday are central to retailers’ strategies across industries. The day after Thanksgiving and the Saturday before Christmas typically rank among in-store retail’s busiest days, last year generating foot traffic surges of 50.1% and 56.3%, respectively, compared to a 12-month daily average. And
But a closer look at regional data shows that these promotions land differently across the country. In the Midwest, Black Friday outperformed Super Saturday last year, fueling the nation’s biggest post-Thanksgiving retail visit spike – a testament to the milestone’s strong local appeal. Meanwhile, in the Western U.S. Black Friday trailed well behind Super Saturday, though both milestones drove smaller upticks than in other regions. And in New England and the South Central states, Super Saturday achieved its biggest impact, suggesting that last-minute holiday specials may resonate especially well in that area.
Plenty of Local Variety
Digging deeper into major Midwestern hubs shows that even within a single region, holiday promotions can produce widely different responses.
In St. Louis, Indianapolis, and Minneapolis, for example, consumers followed the broader Midwestern pattern, flocking to stores on Black Friday exhibiting less enthusiasm for Super Saturday deals. By contrast, Chicago and Detroit saw Super Saturday edge ahead, with Chicago’s Black Friday peak falling below the nationwide average of 50.1%. examples highlight the power of local preferences to shape holiday campaign results.
Differing Demographic Shifts Across Regions
Holiday promotions don’t just drive visit spikes; they also spark subtle but significant changes in the demographic profiles of brick-and-mortar shoppers, expanding many retailers’ audiences during peak periods. And these shifts, too, can vary widely across regions.
Outlet malls, department stores, and beauty & self-care chains, for instance, which typically attract higher-income consumers, tend to see slight declines in the median household incomes (HHI) of their visitor bases in December. This dip may be due to promotions drawing in more mid- and lower-income shoppers during the peak holiday season. Electronics stores and superstores, on the other hand, which generally serve a less affluent base, see modest upticks in median HHI in the lead-up to Christmas.
But once again, drilling further down into regional chain-level data reveals more nuanced regional patterns. Take Best Buy, a leading holiday season electronics destination. In some of the chain’s biggest, more affluent markets – including New York, Los Angeles, and Chicago – the big-box retailer sees small dips in median HHI during December. But in Atlanta and Houston – also relatively affluent, but slightly less so – December saw a minor HHI uptick, hinting at a stronger holiday rush from higher-income shoppers in those cities.
Back-to-School Bonanzas
Back-to-school promotions also play a pivotal role in the retail calendar, with superstores, apparel chains, office supply stores and others all vying for shopper attention. And though summer markdowns drive increased foot traffic nationwide, both the timing of these shifts and the composition of the back-to-school shopping crowd differ among regions.
A Southern Head Start
Analyzing weekly fluctuations in regional foot traffic to clothing and office supplies stores shows, for example, that back-to-school shopping picks up earliest in the South Central region, likely due to earlier school start dates.
But the biggest visit peaks occur in the Northeast – with clothing retailer foot traffic surging in New England in late August, and office supplies stores seeing an even bigger surge in the Middle Atlantic region in early September. Retailers and advertisers can plan their back-to-school deals around these differences, targeting promotions to local trends.
A New England Collegian Affair
Though K-12 families drive much of the back-to-school rush, college student shoppers also play a substantial role. And here, too, their participation varies by region.
For instance, the “Collegians” segment accounted for 2.2% of Target’s shopper base nationwide over the past year – rising to 3.0% in August 2024. But regionally, the share of “Collegians” soared as high as 4.0% in New England versus just 2.2% in the West. So while retailers in New England may choose to lean into the college vibe, those in Western states may place greater emphasis on families with children.
Mother’s Day and Father’s Day: Differing Dining Peaks
When it comes to dining, Mother’s Day and Father’s Day are the busiest days of the year for the full-service restaurant (FSR) category, as families treat their parents to a hassle-free meal out. And eateries nationwide capitalize on this trend by offering a variety of deals and promotions that add a little extra charm (and value) to the experience.
Atlantic Specials
Nationwide, Mother’s Day drives more FSR foot traffic than Father’s Day – except in parts of the Pacific Northwest, where Father’s Day traditions run especially deep. Still, the size of these holiday boosts varies substantially by region.
This year, for instance, Mother’s Day (May 11, 2025) drove the largest FSR surge in the Middle Atlantic, with the South Atlantic and Midwest not far behind. Father’s Day, by contrast, saw its biggest lift in the South Atlantic. Mother’s Day proved least resonant in the West, whereas Father’s Day had its smallest impact in New England.
Going the Extra Mile for Mom
Dining behavior also differs between the two occasions. Mother’s Day celebrants display a slight preference for morning FSR visits and a bigger one for afternoon visits, while Father’s Day crowds favor evenings – perhaps reflecting a preference for sports bars and later dinners with dad. Another interesting nuance: On Mother’s Day, a larger share of FSR visits originate from between 3 and 50 miles away compared to Father’s Day, suggesting that families go the extra mile – sometimes literally – to celebrate mom.
Self-Styled Celebrations: Driving Traffic with DIY Milestones
While established dates like Black Friday or Mother’s Day naturally spur promotions, brands can also craft their own moments with limited-time offers (LTOs). And much like holiday campaigns, these retailer-led events can produce varied outcomes across different regions.
Fast food restaurants, for example, have leaned heavily on limited-time offers (LTOs) and pop-culture tie-ins to fuel buzz in what remains a challenging overall market. And McDonald’s recent Minecraft promotion, launched on April 1, 2025 to coincide with the April 3 release of A Minecraft Move, shows just how impactful the practice can be.
Nationally, the Minecraft promotion (featuring offerings for both kids and adults) drove a 6.9% lift in visits during the movie’s opening week. But the impact of the promotion was far from uniform across the U.S. Many of McDonald’s Western markets – including Utah, Idaho, Nevada, California, Texas, Arizona, Colorado, and Oregon – recorded visit lifts above 10.0%. Meanwhile, Kentucky saw a 2.1% dip, and several other Eastern states registered modest gains below 3.0%. The McDonald’s example illustrates the power of regional tastes to shape the success of even the most creative pop-culture collabs.
Adopting a Regional Lens
Whether it’s properly timing holiday and back-to-school discounts, recognizing where Mother’s Day or Father’s Day will resonate more, or pinpointing markets that respond best to pop-culture tie-ins, the data reveals that effective promotions depend heavily on local nuances. And by analyzing regional and DMA-level trends, retailers and advertisers can craft compelling, relevant campaigns that heighten engagement where it matters most.
Discover how mall anchors are transforming in 2025 – and how a foot-traffic-focused approach to choosing key tenants can drive visits and shopper engagement.
May 29, 2025
8 minutes
Key Takeaways
1. Experiential and niche retailers can deliver anchor-level traffic. At Towne East Square Mall, the addition of a Scheels in 2023 significantly increased foot traffic and long-distance travelers, while Barnes & Noble at Coronado Center in Albuquerque has become a key driver of both foot traffic and higher-spend demographics.
2. Size isn’t everything – especially for dining venues. At Glendale Galleria and Northridge Fashion Center, smaller restaurants attracted more foot traffic than some traditional anchors.
3. Refocusing on tenants’ actual traffic contributions enables a flexible anchor approach. Balancing weekend draws like Scheels with weekday favorites such as Costco or Chick-fil-A can help maintain steady visitor flow throughout the week. Similarly, onsite fitness clubs can shift traffic to earlier in the day – an opportunity to adjust store hours and capture additional morning shoppers.
4. Temporary pop-ups can form an integral part of a visit-focused anchor strategy. The Barbie Dreamhouse Living Truck Tour generates mall visit spikes well above typical Saturday levels. Operators can integrate these events into their overall anchor strategies, offering preferential terms to high-performing pop-ups.
5. New tenants can boost traffic for existing stores in similar categories. After Aldi joined Green Acres Commons in February 2020, visits to an existing BJ’s Wholesale Club trended upwards. This synergy highlights how overlapping audiences can become a strength, creating a larger overall customer base.
The Retail Comeback Kid
Malls, it seems, are cool once again. After languishing in the wake of the pandemic, shopping centers across the country are thriving – reinventing themselves as prime “third places” where people can hang out, shop, and grab a bite to eat.
One key driver behind this resurgence is a shift in how malls view their anchor tenants. While traditional mainstays like Macy’s and JCPenney still play an important role, specialized offerings – from popular eateries to fitness centers and immersive retailtainment destinations – are increasingly taking center stage. These attractions maximize the experiential value that brick-and-mortar venues can deliver, driving visits and sales for the center as a whole.
Against this backdrop, this report leverages the latest location intelligence data to explore the types of tenants that can function as mall anchors in 2025. Should mall operators still focus on general merchandisers to draw crowds, or can dining chains and more niche retailers also do the job? How important is square footage in identifying the anchor-like tenants in a shopping center? And how can a visit-focused approach help mall operators select effective anchor or anchor-like tenants – whether to fill big-box spaces or to leverage the leasing perks traditionally reserved for major large-format chains?
Out-of-the-(Big)-Box Visit Drivers
One of the most important functions of a mall anchor is to ensure steady visitation – providing its smaller tenants with a constant flow of potential customers. And as the role of the mall continues to evolve, analyzing the actual foot traffic impacts of different types of businesses can help identify the kinds of non-traditional anchors best suited to fulfill that purpose.
The Power of a Well-Placed Scheels
Experiential venues, for example, are particularly well-poised to serve as powerful anchors in today’s retail environment – as illustrated by the visit surge experienced by Towne East Square Mall in Wichita, KS following the addition of a Scheels in July 2023.
By blending traditional retail with immersive experiences, Scheels has emerged as a true experiential destination. And this pull has also helped the mall draw more long-distance visitors willing to travel to enjoy Scheels’ offerings. In 2024, 41.9% of the mall’s customers traveled more than 50 miles to visit, compared to 35.8% back in 2018 when Sears occupied the same lot.
Scheels Anchor Brings Substantial Visit Boost to Towne East Square Mall in Wichita, KS, Attracting Visitors From Further Away
Visits to Towne East Square Mall Compared to Q1 2018 Baseline
Share of Visitors From 50+ Miles Away
Share
Embed:
The Barnes & Noble Effect
Traditionally, anchors aimed to please the widest possible audiences – with department stores, big-box chains, and grocery stores leading the way. But visitation data shows that niche concepts can also deliver anchor-level traffic if they’re compelling enough to attract dedicated fans.
The experience of the Barnes & Noble at Coronado Center in Albuquerque, NM is a case in point. After being written off as all but obsolete, Barnes & Noble has staged an impressive comeback in recent years, finding success through a more curated, localized approach to book selling. And despite not being a formal anchor, the Coronado Center Barnes & Noble accounted for 7.9% of visits to the mall in 2024 – outperforming both Macy’s and JCPenney.
Year-over-year data also shows foot traffic surging at the Coronado Center Barnes & Noble, lifting overall visitation to the mall. And demographic data reveals that the bookstore draws a more affluent audience than either the center as a whole or the two department stores – attracting a crowd with more spending power.
This example also illustrates how smaller tenants can sometimes draw larger crowds. Even though Barnes & Noble occupies a smaller onsite space than either Macy’s or JCPenney, it is proving a powerful visit driver out of proportion to its physical size.
Dining Chains Punching Above Their Size
Dining chains are also adept at punching above their square footage – often attracting crowds disproportionate to their size.
Despite its relatively small footprint, for example, the In-N-Out Burger at Glendale Galleria drew an impressive 8.6% of visits to the mall complex in 2024, outpacing some of the mall’s official anchors like DICK’s Sporting Goods, Macy’s, and JCPenney. Still, the onsite Target drew even larger crowds at 14.4% of visits.
A similar pattern emerged at Northridge Fashion Center, where Porto’s Bakery and Cafe captured a notable 15.6% of visits to the complex in 2024 – more than some of the center’s traditional department stores.
These examples underscore the potential for dining chains, which typically require less space, to serve as micro-anchors by consistently attracting outsized crowds – a key consideration for mall operators looking to sustain visitor traffic.
Choosing a Mall Anchor in 2025
Refocusing on tenants’ actual foot traffic contributions also opens the door to a more flexible and dynamic approach to anchor selection and management – one that considers each venue’s unique visitation patterns.
The Weekend/Weekday Divide
Seasonal factors, for example, can make certain anchors more powerful at specific times of the year, while different venues shine on particular days of the week.
At Jordan Creek Town Center in West Des Moines, Iowa, for instance, Scheels and Costco each delivered just under 20.0% of the complex’s overall visits in 2024. But the two retailers’ daily patterns differed significantly: Scheels saw bigger crowds on weekends, while Costco was the primary weekday destination.
Understanding differences like these can help operators optimize their tenant mix to maintain a balanced flow of shoppers throughout the week.
Another example of the impact of differing weekday traffic patterns is offered by the impact of mall-based Chick-fil-A locations on the distribution of mall visits throughout the week.
Despite its relatively small size, Chick-fil-A draws substantial traffic to malls. And after adding Chick-fil-A locations, both Northridge and Miller Hill Malls saw meaningful drops in the share of visits to the centers taking place on Sundays – even as the wider indoor mall segment saw slight upticks.
Recognizing this trend could prompt mall operators to compensate by adding more weekend-friendly traffic drivers – or to lean into this distinction by taking additional steps to bolster the mall’s role as a go-to weekday destination.
The Early-Morning Fitness Advantage
The power of different mall traffic magnets also varies throughout the day. Increasingly, shopping centers are turning to fitness centers as experiential anchors. And since many people work out early in the morning, these gyms are having a significant impact on the distribution of mall visits across dayparts.
The addition of gyms to Northshore Mall in Peabody, MA and Jackson Crossing in Jackson, MI, for instance, led to a significant rise in visits between 7:00 AM and noon. And though the rest of the stores in these malls typically open at 10:00 or 11:00 AM, this shift presents the centers with a significant opportunity.
By adjusting opening hours to accommodate these early-morning patrons, malls can capitalize on this added traffic, driving up visits and sales for relevant tenants – especially health-focused retailers such as juice bars and sporting goods stores.
Adding Temporary Pop-Ups Into the Mix
Adopting a broader, visit-focused view of anchoring also allows mall operators to apply some of the strategies typically reserved for anchors to non-conventional traffic-generating businesses, to ensure a consistent flow of traffic year-round.
Pop-up stores and events, for example, generally don’t follow the same seasonal trends as other retailers – instead, they generate short-term visit boosts during their runs, whenever in the year that may be. And a visit-focused anchor strategy can leverage some of the perks traditionally reserved for anchor tenants – such as preferential leasing terms – to complement traditional full-time anchors during slower retail periods.
The Barbie Dreamhouse Living Truck Tour is a prime example of a traffic-driving pop-up. By bringing exclusive merchandise to malls across the U.S., the truck generates plenty of buzz, drawing crowds eager to snatch up limited-edition items and immerse themselves in all things Barbie. As a result, malls hosting the tour often see significant visit spikes, with foot traffic surging well above typical Saturday levels. Well-timed pop-ups like these can help balance out traffic throughout the year, offsetting traditional slow periods.
Creating a Bigger Visit Pie
A visit-focused approach to anchor management can also help mall operators assess the potential impact of new tenants on existing stores operating in similar categories. For example, mall owners often worry that new tenants operating in similar categories might cannibalize existing businesses. But a visit-focused anchor approach reveals that a well-chosen addition can sometimes benefit current tenants – especially if they cater to similar audiences.
In February 2020, for instance, value supermarket Aldi opened at Green Acres Commons in Valley Stream, NY – a center that already hosted budget-friendly BJ’s Wholesale Club. While BJ’s visits were relatively flat in 2018 and 2019, they began to rise after Aldi’s opening (and following a pandemic-induced dip). Cross-shopping data also shows that Aldi customers were more likely to visit BJ’s than the average Green Acres patron last year.
This synergy may be due in part to the two retailers’ similar visitor bases: In 2024, the Aldi and BJ’s stores in Green Acres Common drew shoppers with comparable economic profiles. This suggests that overlapping audiences can become a strength if aligned brands attract new shoppers, who then explore multiple stores in the same center.
Visits to BJ's Wholesale Club Took Off After Addition of Aldi to Green Acres Commons – Perhaps Buoyed by Audience Similarity
Visits to Green Acres Commons BJ's Wholesale Club, Compared to Q1 2018 Baseline
Median HHI, 2024*
Cross-Shopping, 2024
*Median HHI based on STI: PopStats dataset combined with Placer.ai data for captured trade areas.
Looking ahead, effective mall anchors will be defined less by physical footprint and more by their capacity to maintain consistent, valuable foot traffic. While traditional department stores remain pivotal, smaller or niche brands can often rival – or surpass – large-format retailers. And by thinking out of the anchor box and choosing tenants that cultivate a balanced visitor flow and align with local preferences, operators can position their centers as true go-to destinations.


.svg)


.avif)


