College students are a coveted retail segment, so today, we dove into the data on spending habits to see when they shop, what they like to buy, and how retailers can get their attention.
Lila Margalit
Oct 3, 2023
4 minutes
College students make up a small percentage of the overall U.S. population. But they often have money to spend – and back-to-college shopping is a significant driver of retail sales. This year in particular, students heading back to school were expected to spend record amounts on dorm decor, clothing, and other campus essentials. And since today’s college students make up a large chunk of tomorrow’s affluent consumers, retailers across industries are eager to cement positive relationships with the segment.
So with fall semester just under way, we dove into the data to explore the spending habits of today’s undergraduate young adults. When do they shop? What do they like to buy? And what can retailers do to get their attention?
A Distinctly Seasonal Affair
To get a sense of when collegians tend to do the most shopping, we analyzed the monthly share of college students in the captured markets of select retailers and segments, using audience segmentation data from Spatial.ai’s PersonaLive. And the analysis revealed that student consumer behavior follows a clear seasonal pattern.
In 2019, the share of college students in the captured markets of big box superstores like Target and Walmart peaked in August, and to a lesser extent in June, July, and September, as collegians enjoyed their summer vacations and did their back-to-school shopping. Additional upticks emerged in January, when many students were on winter break. But during regular school months, when midterms, finals, and homework likely kept many students hunkered down in the library, their share in the chains’ captured markets was much lower. While this pattern was disrupted in the wake of COVID, it returned in full force in 2022. Similar seasonality arose when looking at wider segments like apparel and off-price retail, as well as various dining categories.
Price Isn’t Everything
In addition to seasonality, the above graphs also appear to indicate that despite their tight budgets, collegians don’t necessarily prioritize price over everything else. So to further explore the shopping preferences of college kids, we examined the share of the #College segment in the captured markets of popular chains across categories.
Trade area data seems to indicate that university students shop at Target, frequent non-off-price-apparel chains, eat at fast-casual restaurants – and make up smaller shares of the customer bases of less expensive alternatives. Indeed, as hard-up as they may be, undergrads know how to splurge and are willing to pay for high quality stuff. They can’t get enough Urban Outfitters and love mid to higher range brands like Madewell and lululemon athletica.
At the same time, college students are highly oriented to thrift shops – especially those like Buffalo Exchange and Plato’s Closet, where they can sell their old clothes and snag stylish, name-brand items for a steal.
Seasonal Opportunities
Of course, the share of collegians in the captured market of any given retailer or segment can also be impacted by the behavior of other demographics. For example, if a particular chain attracts an extremely broad audience, a lower relative share of college students may indicate that their presence is being offset by other segments. Still, while a small share of collegians in a chain’s trade area may not necessarily mean that the chain does not appeal to this group, a disproportionate share of students in a chain’s captured market is a strong indication that the brand is embraced by this demographic.
And chains which see a smaller share of college students among their customer base may draw an outsize proportion of undergrads during peak season. Walmart’s captured market, for example, was just 14.0% over-indexed for the #College segment between September 2022 and August 2023, compared to a nationwide baseline. But looking just at August 2023 – peak college Back to School shopping season – the share of #College students in its captured market was 94.0% higher than the nationwide average. Walmart also enjoyed higher-than-average shares of collegians in September, June, July, January, and to a lesser extent – October. Dollar Tree, too, attracted an outsize share of collegians in the summer and in January.
Key Takeaways
Collegian shopping habits are shaped by the rhythms of campus life. And while students are budget-conscious, they place a high premium on quality and are willing to spend money on things that are important to them. Brands that can lean into college students’ seasonal groove – while providing the products they crave at price points that don’t break the bank – will be poised to win over this demographic, gaining customers that may stay with them for life.
How will college spending habits continue to evolve as the school year progresses? Which brands will stand out as collegian favorites?
Follow Placer.ai’s data-driven insights to find out.
Marriott International is a major player in the U.S. hospitality world, with 31 brands under its umbrella. Recently, the company launched the hotel industry's first retail media network. We dive the foot traffic data and consumer demographic metrics to discover what this may mean for the brand.
Lila Margalit
Jul 18, 2023
4 minutes
Marriott International, Inc. has long been a dominant player on the U.S. hospitality scene. The company boasts a wide-ranging portfolio of some 31 brands, running the gamut from luxury chains like The Ritz Carlton to more budget-friendly options like Courtyard by Marriott. And with more than 8,500 locations worldwide, including some 5,700 in the U.S., the hotel giant is continuing to expand its footprint.
Against this backdrop, Marriott International’s decision last May to launch the hospitality industry’s first media network – leveraging visitor data to let external brands advertise to its customers – should come as no surprise. With millions of customers passing through its doors each year, Marriott is particularly well-placed to help relevant advertising partners reach new audiences. The network, powered by Yahoo, offers both online and offline marketing opportunities, including in-room television and digital-screen promotions.
To better understand the potential reach of Marriott’s advertising network, we dove into the data to explore the characteristics and preferences of the people that visit the hospitality leader’s various brands and locations. By layering foot traffic data with demographic and psychographic metrics from STI: Popstats, AGS Behavior & Attitudes, and Experian’s Mosaic, we examined Marriott’s different captured markets, gaining insight into the habits, interests, and profiles of its customer bases.
*A chain or venue’s captured market refers to the population residing in its trade area, weighted to reflect the actual share of visits from each Census Block Group comprising the trade area.
Something for Everyone
Marriott’s brands are divided into three tiers: Luxury, Premium, and Select. And with something for everyone, the company’s customer base encompasses a wide swath of society – from budget-conscious families looking for inexpensive accommodations, to affluent singles on the hunt for high-end, luxury getaways. Marriott also runs several extended-stay venues, including Residence Inn and TownePlace Suites.
A look at the profiles of visitors to four different Marriott chains shows that, as expected, wealthier patrons tend to frequent the company’s luxury hotels, while less affluent customers tend to visit its more budget-oriented Select brands. But even the company’s less pricey offerings – such as Four Points by Sheraton (acquired by Marriott in 2016) – attract consumers from relatively affluent areas. And certain Select tier destinations, like Marriott’s Millennial and GenZ-oriented Moxy Hotels, draw higher-HHI travelers than some Premium brands.
The household compositions and consumer preferences of visitors to Marriott’s various brands also differ. Four Points stands out as a prime destination for families with children, as well as older couples – while Moxy attracts an outsize share of “Young City Solos.” Moxy and Ritz Carlton guests are more likely to be museum goers and use ride share apps like Lyft and Uber. And visitors to Four Points and Westin locations are more apt to be into DIY home improvement.
Getting into the Groove with Moxy
One Marriott chain that has been doing particularly well in recent months is Moxy Hotels, a brand squarely targeted at the “young at heart.” Positioned as an experiential destination – a place to play, and not just stay – Moxy Hotels’ website exudes youthfulness, inviting travelers to “PLAY ON #ATTHEMOXY,” and touting the chain’s fun communal spaces. The rooms are relatively compact and affordable, and at some locations, guests can check in at the bar and claim a complimentary cocktail.
And the chain, which boasts some 120 properties across 23 countries (including more than 30 in the U.S.), experienced positive year-over-year (YoY) visit growth throughout H1 2023. While some of this growth is undoubtedly due to the chain’s continuedexpansion, the average number of visits to each Moxy Hotel also increased. The consumer quest for funexperiences, which has propelled experiential models in retail and dining, appears to be leaving its mark on the hotel industry as well.
Moxy Hotel’s highly targeted experiential vibe may make it particularly attractive for advertisers interested in reaching younger consumers. But while Moxy targets a pretty specific demographic, the profile of its customers is far from uniform. Visitors to Moxy’s New Orleans Hotel, for example, are more likely to have a lower HHI and to include families with children than visitors to its Washington, D.C. and East Village (New York) venues. And while more than 60.0% of visitors to the East Village Moxy in H1 2023 were locals hailing from less than 30 miles away, 81.5% of visitors to the New Orleans Moxy came from further away.
Looking Ahead
Buoyed by a post-COVID travel boom that has seen people flocking back to hotels and airlines, Marriott International – along with its media network – appearspoised for further growth. While the network will undoubtedly harness Marriott’s own first-party data, including from its Bonvoy loyalty program, location intelligence can offer additional layers of insight into the actual audiences it is likely to reach.
For more data-driven foot traffic insights, visit Placer.ai.
Although many dining chains have been challenged by recent economic headwinds, others are finding success. We take a closer look at the location analytics for CAVA, a growing fast-casual chain, to see what lies ahead for the chain.
Ezra Carmel
May 31, 2023
3 minutes
Although many dining chains have been challenged by recent economic headwinds, others are finding success. Adding itself to the list of restaurant winners in 2023 is CAVA – a growing Mediterranean fast-casual chain that recently filed for an initial public offering (IPO). We dove into the location analytics for CAVA to take a closer look at how the company is thriving in a turbulent economic climate and what lies ahead for the chain in its next chapter.
Growing Appetites
CAVA has shown a remarkable ability to drive foot traffic over the past couple of years. Since 2019, CAVA’s baseline visit growth has outperformed the fast-casual restaurant space nearly every month – with visits really taking off in 2021. The brand has been able to capitalize on growing suburban markets – accounting for 80% of locations – which may be contributing to the chain’s visit growth.
Visits to CAVA have skyrocketed. And like other fast-casual success stories, CAVA has embraced drive-thrus and invested in a streamlined in-store experience, both of which are likely contributing to at least some of the brand’s recent strength.
In addition to impressive visit growth, CAVA recorded a 12.8% revenue increase in 2022 compared to 2021 – no small feat considering the impact of inflation on overall restaurant traffic.
A Fast Favorite
Zooming into visits per venue showcases CAVA’s strength even more clearly. CAVA’s visits-per-venue seem to follow industry trends – as overall fast-casual visits-per-venue fell year-over-year (YoY) between January and April 2023, CAVA’s visit-per-venue growth slowed as well. But although the direction was similar, the actual performance differed substantially, with the company significantly outperforming the wider fast-casual category.
CAVA’s YoY monthly visits per venue have been up since January 2023 – a particularly impressive feat in light of the chain’s continued expansion, and an indication that new locations are driving traffic despite the current economic environment. So, while CAVA appears to be affected by broader restaurant trends, the brand remains far ahead of the fast-casual dining space.
Kitchen Conversions
CAVA’s bold brick-and-mortar strategy is part of the reason why it has been able to get ahead of the pack in the fast-casual category. The company acquired Zoës Kitchen in 2018 and has since rebranded almost all Zoës Kitchen locations as CAVA restaurants. Such a strategy is relatively rare in the restaurant industry, but location analytics show that the move has paid off.
Since Q1 2021, CAVA’s YoY visits per venue have consistently outperformed visits-per-venue at the remaining Zoës Kitchen locations. This not only validates CAVA’s decision to phase out the Zoës Kitchen brand but also suggests that CAVA resonates with Zoës Kitchen diners who continue to visit a location when it becomes a CAVA restaurant.
Hungry For More
CAVA’s IPO announcement is a welcome next step for one of the fastest-growing fast-casual chains. With a focused expansion strategy and an eye on growing markets, there may be no telling how far the company can go.
For updates and more data-driven foot traffic insights, visit Placer.ai.
Our latest white paper, Who’s in the Stands? An In-Depth Look at Arena and Stadium Visits, uses location intelligence tools to uncover the demographic and psychographic characteristics of sporting events attendees – including Super Bowl fans. Read on for a taste of our findings.
Ezra Carmel
Feb 9, 2023
3 minutes
Our latest white paper, Who’s in the Stands? An In-Depth Look at Arena and Stadium Visits, uses location intelligence tools to uncover the demographic and psychographic characteristics of sporting events attendees – including Super Bowl fans. Below is a taste of our findings.
Super Travel Plans
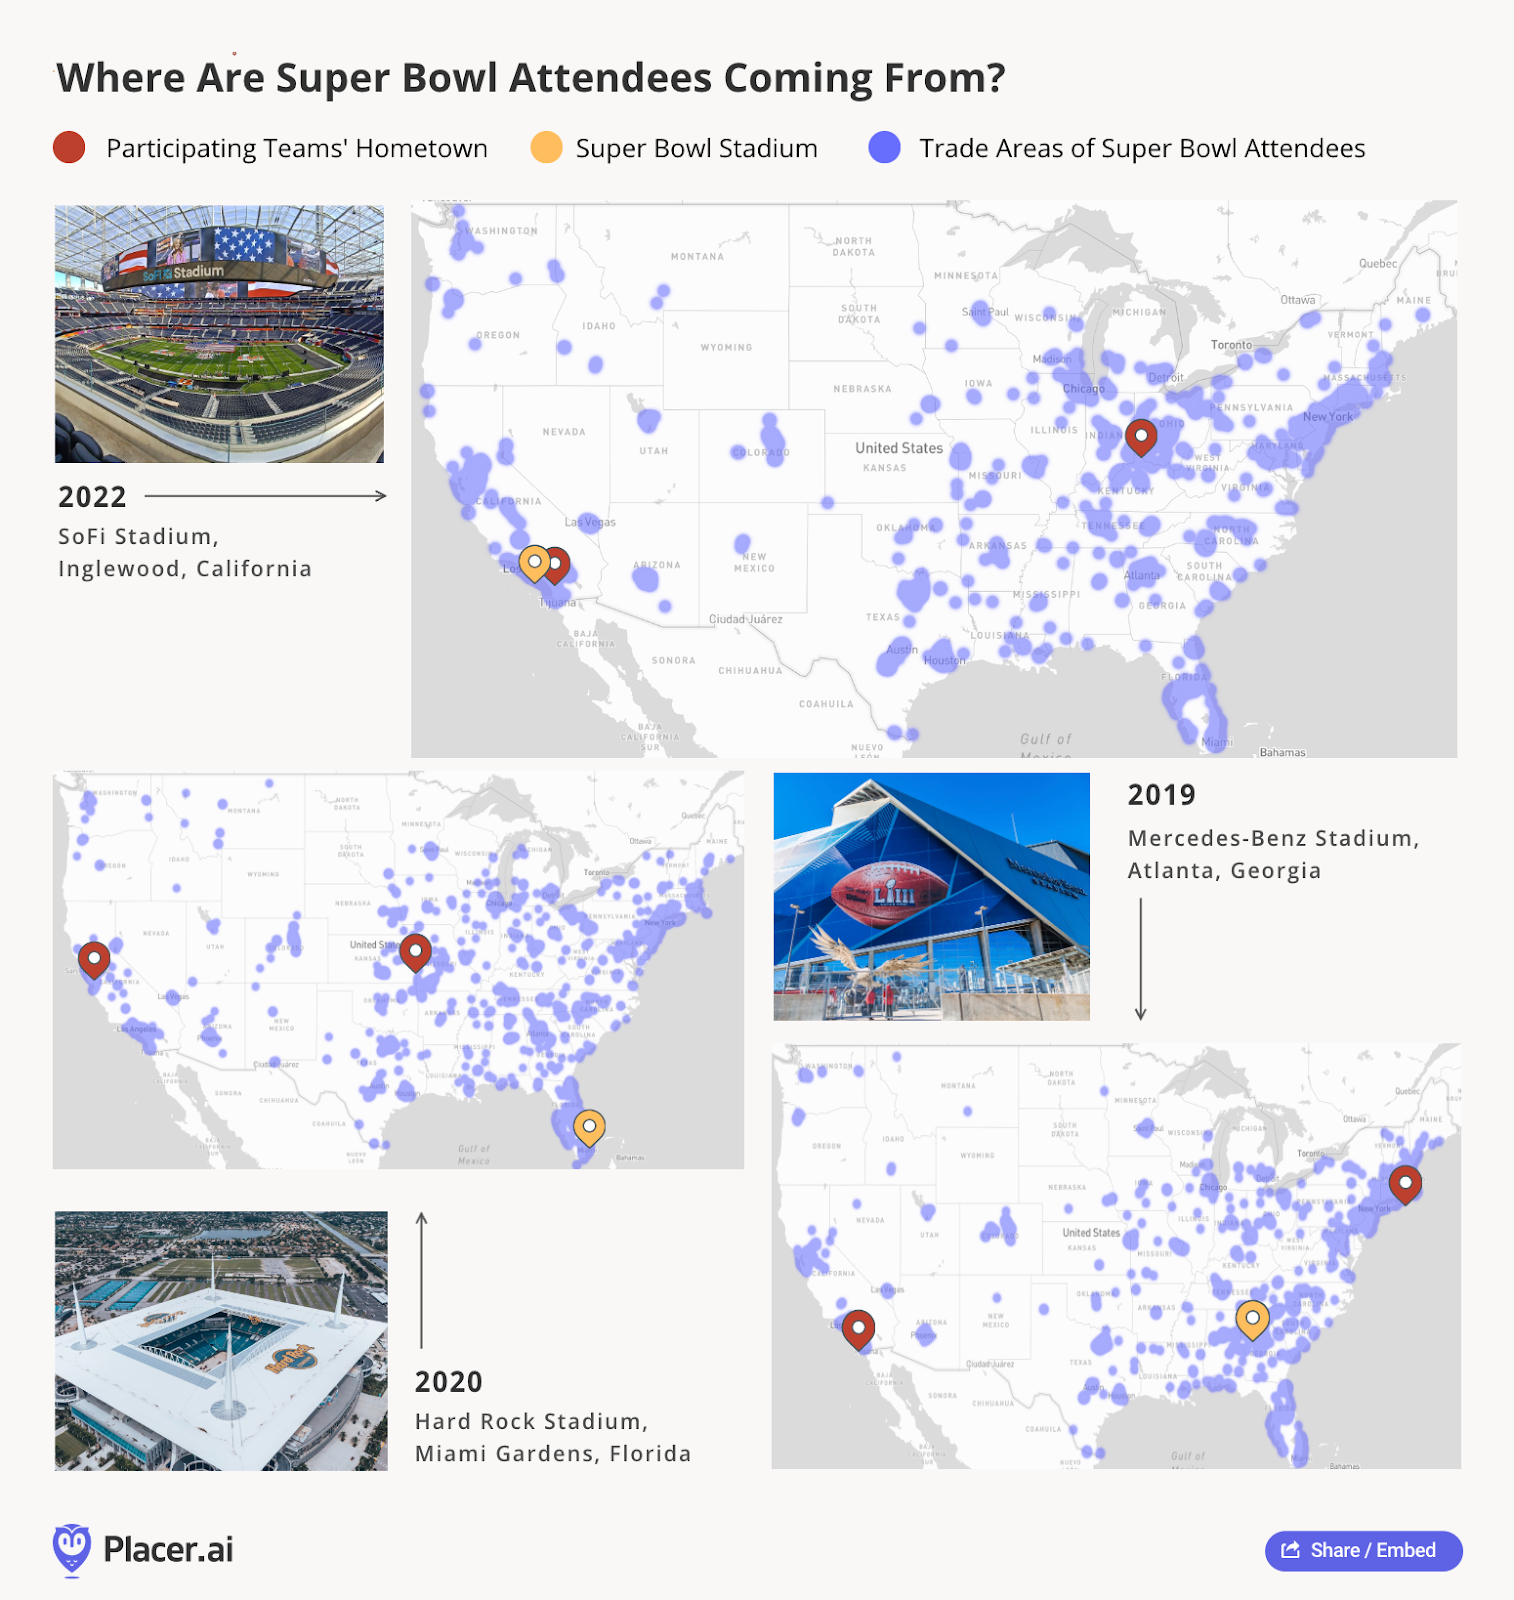
As the biggest game of the year, the Super Bowl usually brings a tourism boom to the host city. The heat map below depicts the origins of travelers to the past three Super Bowls (excluding Super Bowl LV in 2021 which was held under COVID restrictions). Year after year, the distribution of Super Bowl attendees is relatively similar to the country’s population distribution – which means, perhaps unsurprisingly, that the most densely populated regions are well-represented at the game.
But the data also reveals that many Super Bowl attendees travel from the regions where the competing teams are based, which indicates that die-hard fans are willing to make the trip to see their local team potentially win a championship. The map also shows that visitors from the Super Bowl’s host city and surrounding areas are heavily represented at the game, regardless of whether or not a local team is playing. It’s likely that a significant number of football fans who live nearby take advantage of the rare opportunity to see a Super Bowl close to home.
Super Bowl LVI in 2022, for example, was played at SoFi Stadium in Los Angeles, CA between the Cincinnati Bengals and the Los Angeles Rams. The event was heavily visited by fans from Southern California as the game was not only being played by the LA Rams, but also at their home stadium in Inglewood, CA. A greater contingent than previous years was also in attendance from Cincinnati, OH and its surrounding areas.
A Family Affair
Many fans travel to the Super Bowl from the same regions every year, with the host city and the contending teams’ hometowns also providing significant factions of attendees. But analyzing Super Bowl crowds throughout the years also reveals an important demographic shift taking place among those traveling to the Super Bowl – the growing number of family-oriented visitors.
Since 2019, the True Trade Areas of the Super Bowl stadiums include increasingly greater shares of larger families. Last year’s Super Bowl LVI had an in-person audience that reflected a trade area in which 17.9% of residents came from families of five or more, up from 11.9% at the Super Bowl three years prior. Conversely, Super Bowl attendees in 2022 reflected a trade area in which 37.7% of residents were part of two-person households, a decrease from 47.8% in 2019.
The increase in attendees from areas with larger families could reflect the NFL’s initiatives to make football a more family-friendly sport, including rule and equipment changes aimed at increasing player safety and supporting youth football clubs. The trend towards an increase in attendees from larger families may also inform decisions about products to promote as well as amenities that will contribute to a family-friendly experience on game day.
Brands invest heavily in ads that air during the Super Bowl. But with the right insights, stadium advertising platforms have tremendous potential to reach target audiences in-person at the big game. While a large audience is part of the equation, in order to achieve maximum impact, an in-depth understanding of visitors is critical.
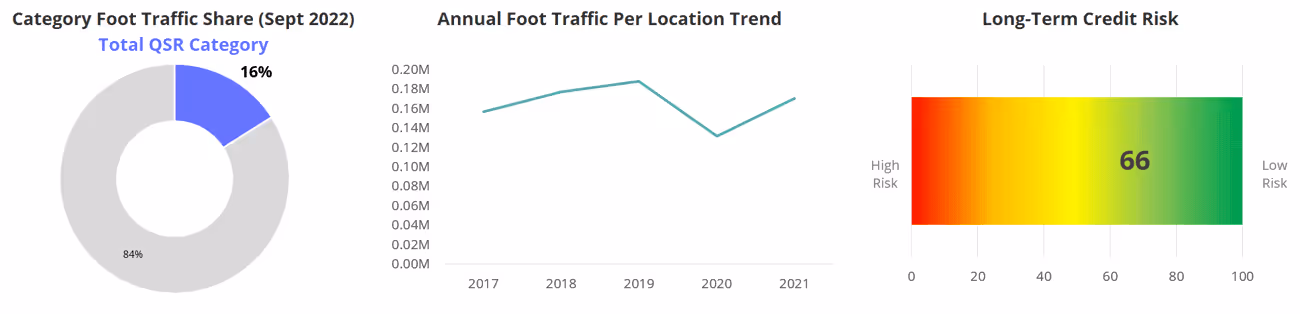
While focus and streamlined operations are key to restaurant growth strategies, we also continue to see evidence of the impact of innovation and nostalgia in driving visits. McDonald’s has had success with its past celebrity meal collaborations with Travis Scott and J Balvin, with our data indicating a mid-to-high teens lift in visits compared to the weeks prior to the promotion. However, McDonald’s "Adult Happy Meal" collaboration with streetwear brand Cactus Plant Flea Market might be its most successful collaboration today, with data suggesting more than a 30% increase in in-store visitation trends compared to the weeks leading up to the promotion (below). We’ve discussed the impact of limited-time offers (LTO) in the QSR space earlier this year, but McDonald’s has set a new bar for the industry (beating out Taco Bell’s Mexican Pizza launch in May).
Although QSR chains saw more resilient visitation trends than other restaurant categories for much of 2022, the gap between the QSR, fast casual, and full-service restaurant chains had narrowed in September as lower-income consumers continue to face inflationary headwinds from menu price hikes across the QSR space while higher-end consumers continue to dine out. Nevertheless, the impact of McDonald’s adult happy meal promotion is evident in not only the massive spike in visitation trends for the full QSR sector last week (below). While not everyone may love these promotions, they can be an extremely effective way to drive visitation growth.
Noam Ben Zvi, co-founder and CEO, explains how Placer will use the Series C funds to ramp up the velocity of development.
Noam Ben-Zvi
Jan 25, 2022
9 minutes
We, the founding team, always loved data - ideating around it, engineering with it, understanding the world better with it.
But what captivated us most was imagining data products that can be used by tens of thousands of businesses across the world.
Among all the ideas and visions we bounced around before starting the company, one stood out for its simplicity and potential impact - building a ‘Physical Market Intelligence Platform’ to provide everyone in the offline world (a.k.a the ‘real world’) with aggregate insights for decision-making. Or in layman’s terms, “a dashboard to get instant insights for any place to understand its audience, surroundings, and competition”.
In 2016, the Placer founding team gathered in a basement and spent a weekend sketching out a plan to turn this idea into a massive world-class data company.
Why did we get so excited?
We loved using insight tools like SimilarWeb and App Annie that were made for the digital world.
A massive market - 80-90% of spend is offline and is not going anywhere, anytime soon. We did not believe in the ‘retail apocalypse’ narrative.
An industry ‘flying blind’ - this immense offline world has suffered from a lack of information critical to its decision-making.
Data is especially critical for the physical world. The famous Facebook motto “move fast and break things” (which we practice at Placer) does not work well in the physical world. Brick & mortar decisions are costly and irreversible. It also takes a LONG time to understand you’ve made a mistake.
Market Research is aggregated data - no need for any personal identifiable information (PII). This means we could build a privacy-first company, without PII data challenges.
It’s a hard problem - which presents the opportunity to build something special. And in hindsight it’s been 10x harder than we thought!
Whiteboarding without customers or tech debt is fun!!!
The more paper we stuck to that basement wall, the bigger the vision became! Everything is possible with the stroke of a pen…
But very quickly, we hit some glaring challenges:
The platform had to be about answering key business questions. But to generate the BEST reports that do so, there are 100s of relevant datasets that we MUST aggregate.
The retail ecosystem is DIVERSE - retailers, CRE, CPG, travel, hotels, billboards are all unique worlds in and of themselves. Can we build a platform that reflects this?
And…growing up in a “digital bubble” - the founding team knew VERY LITTLE about the retail world, its major players and how they work.
The best way to approach a big challenge is breaking it down into smaller ones. So we worked hard to define Phase 1 - focusing on building a product that (1) was centered around the mobile location analytics dataset and (2) generated reports tailored for CRE and retail.
5 years and 5 funding rounds later, we’re FINALLY feeling “pretty good” about Phase 1: we launched a world-class mobile analytics product that’s used by over 1,000 customers, and thousands more are using our free products.
But it’s also been “frustrating” - we were always strapped for cash and resources. We’re yet to integrate most of the datasets we need; key reports for certain verticals remain in the product pipeline; and in terms of usability and workflow features, we still have a lot to do in order to create a truly comprehensive platform (vs “read only” status insights tool).
That’s why the $100M Series C funding we just announced is so momentous for me and the rest of the Placer team. It finally removes the shackles and equips us with the tools and materials we need for Phase 2 - rapidly building the full Placer.ai Market Intelligence Platform.
So let’s dive into what that means…
How does it work?
A Physical Market Intelligence Platform is a big data puzzle. Piecing it together - in a nutshell - consists of four phases:
The Ingredients - identifying and assembling the data.
Ingestion - processing and aggregating that information.
Delivery - making it presentable and accessible.
Customizations - every vertical is seemingly interested in very similar data, but with a different lens. This requires nuanced packaging around information density, terminology, order of reports, and 3rd party data-sets.
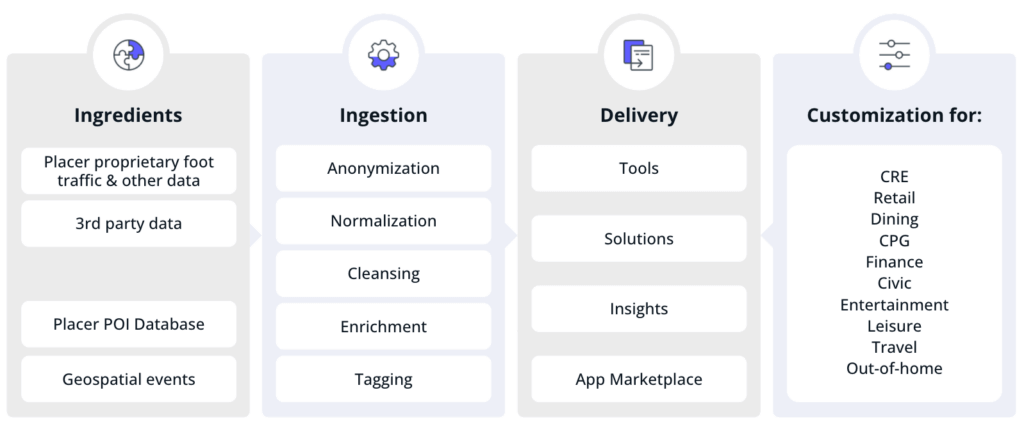
The Placer.ai Market Intelligence Platform
Ingredients
A vast amount of interconnected data is required to create a truly accurate and complete picture of what’s going on at a location. This data falls into two broad categories:
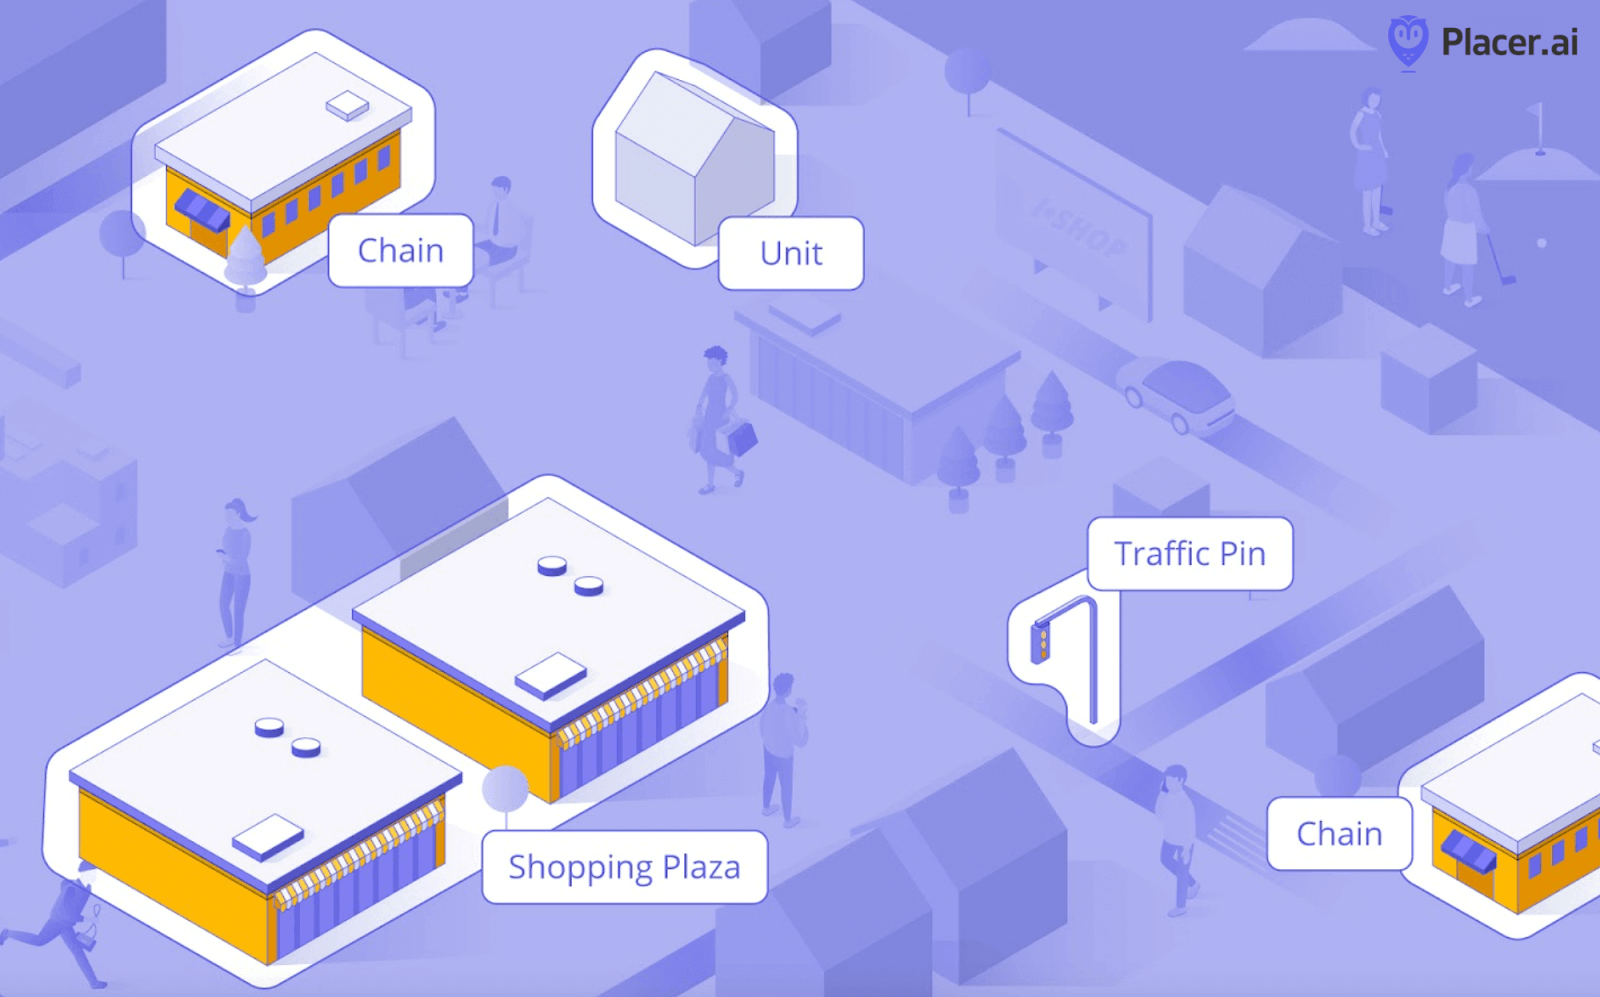
Point of interest (POI) data offering information on places such as a grocery store, retail centers and wider areas.
Geospatial data such as impactful events in the area, traffic data and future development projects.
Now consider all things you see going on in the world and imagine how POI and geospatial data can capture and quantify them…
Here’s a snippet:
We track dozens of data categories and thousands of datasets and vendors in order to identify new data that can help answer our customers’ questions.
Our product team draws on our customers’ feedback and wider market research to identify and triage the datasets we need to answer the questions.
Our BD team lines up commercial partnerships with the data providers.
Our data analysts and scientists carry out a lengthy quality assessment process, which includes testing the data’s relevance, accuracy, data trust compliance, coverage, compatibility, recency, accessibility and alternatives.
This is 50% of our work and is a huge data challenge - but also great fun!
Among the real world visibility datasets
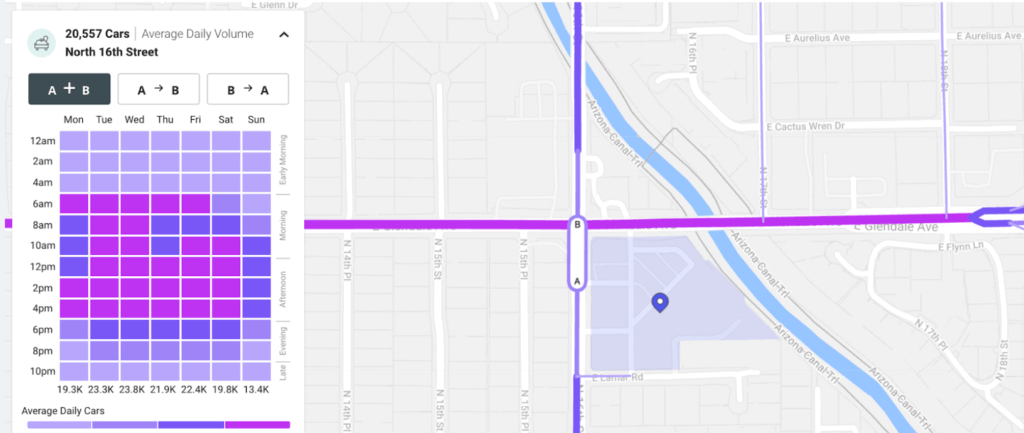
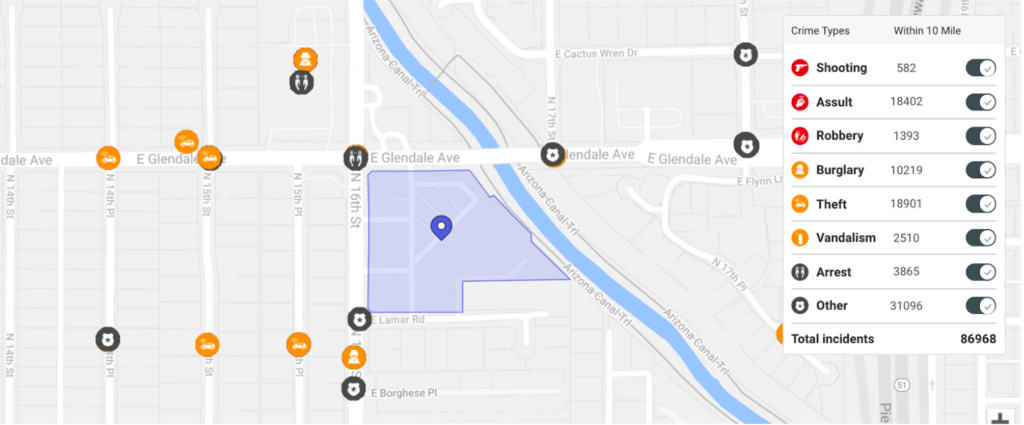
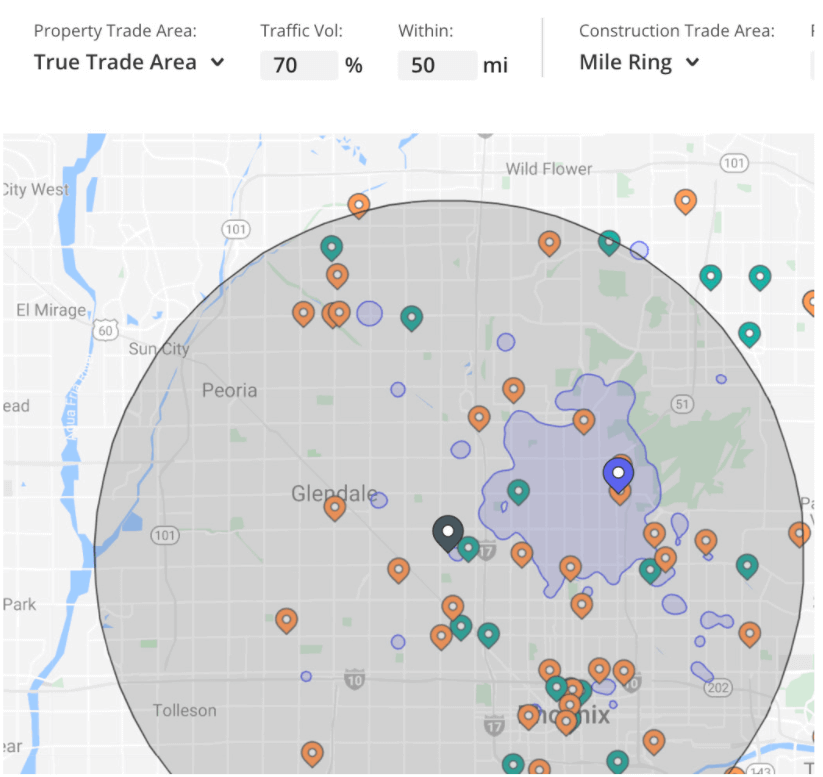
Through partnerships and our App Marketplace, we’ve recently integrated online reviews, credit card data, demographics, vehicle traffic volume, crime figures and planned construction into our platform. And we have lots more datasets in our pipeline: retail sales, property sales, financial data, leasing comparisons and climate data to name just a few.
Vehicle Traffic Volume
Crime
Planned Construction
Ingestion
If the data are the ingredients, then ingestion is the cooking. This includes complex data science processes:
Anonymization - eliminating personal identifiable information
Normalization - adapting the data’s various fields to fit Placer’s data model
Cleansing - ensuring that the data is as accurate and complete as possible
Enrichment - adding existing data layers to the ingested data, or extrapolating information from it
Tagging - associating the data with relevant POIs, industry categories, and so on to create meaningful insights.
Tagging data to POIs is a massive task. Placer’s POI database contains millions of entities: a commercial real estate asset in a customer’s portfolio; stores of a retailer’s chain or that hold a CPG brand’s products; a billboard used for out-of-home advertising; a downtown area being regenerated by a municipality or business improvement district. We geofence each one so data can be tagged to it.
But a much greater complexity than the volume of data-POI matching is the fact that our data structure is mutable - it changes. Stores, restaurants, strip malls and other POIs open, close, merge and move. Our physical environment is constantly changing. One of our platform’s standout attributes is that it always reflects historical change.
In practice, this means that, for each POI change, we not only adjust our data tagging but also re-tag 5 years of historical data to ensure any historical comparisons are “like with like”. This is a huge investment of resources on the part of our data science, devops and engineering teams - exponentially increasing our data management burden.
Delivery
To complete the cooking metaphor, after selecting ingredients (datasets) and cooking them (data ingestion), we then lay out a buffet-style feast of solutions for our users:
Basic Reports and Insights
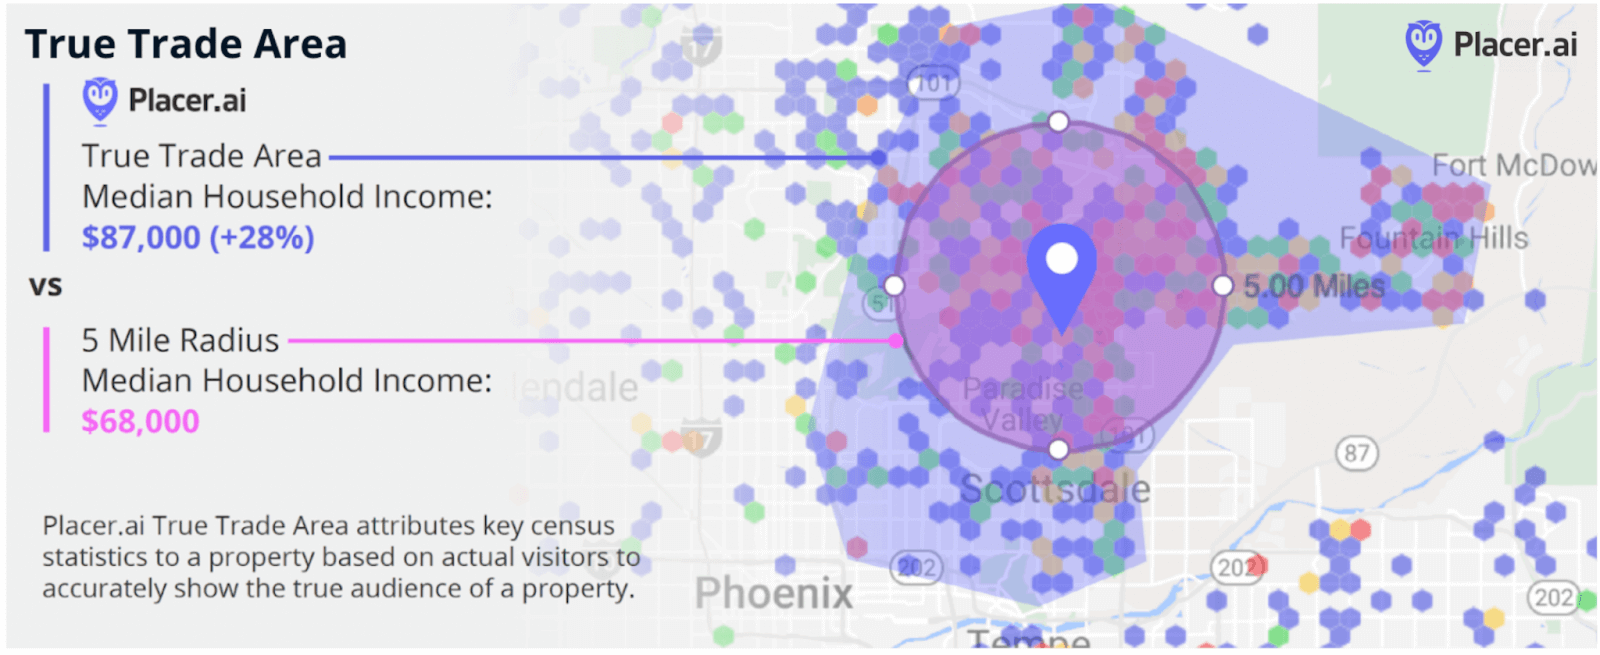
The most basic level of the platform is converting the data into real-world constructs that can be understood by industry professionals: tables, charts, maps and other graphics displaying cross shopping, trade areas (below), cannibalization, risk analysis, visit frequency and so on.
Solutions
A key tenet of the Market Intelligence Platform is the approach that insights like those are often not the answer to the questions that our customers are looking for. Rather, they are just part of the explanation behind the answer. That means providing a comprehensive suite of Solutions SUPPORTED by insights, not just a library of uncontextualized insights.
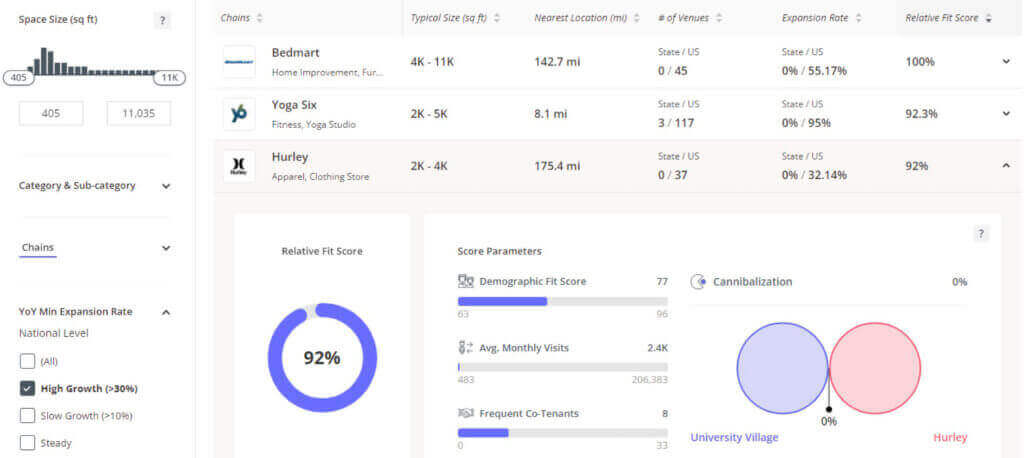
An excellent example of this is Void Analysis. A key question for retail real estate is “who is my ideal tenant?” While our platform offered important insights (such as retailers’ average monthly foot traffic and cannibalization) for reaching an answer, landlords were doing a lot of legwork. The Void Analysis tool we released late last year enables CRE professionals to instantly analyze thousands of potential tenants through automatically generated reports that include ranking according to our unique Relative Fit Score. This significantly improves the speed and scope of a search for new tenants.
Void Analysis - Who is the best fit for my vacancy?
We are now working on the many additional solutions like Void Analysis in our development pipeline - sales forecasting, site selection for retail chains, market selection, market change reports, product optimization for CPG to name a few.
Placer REST API
To be truly useful, solutions must also be delivered in a way that fits various users’ workflows. A dashboard is a good start, but a full platform must offer a range of access points. This means data feeds, REST APIs, and other methods of programmatic access.
We’ll also add to that a rich layer of data exploration tools such as GIS, templates, graph builders, pivot table functionality and advanced entity search. This will provide users with maximum flexibility in how they explore and visualize our data.
The lion’s share of the work is still ahead of us here - more widgets, third party integrations, report generators, scheduled intelligence reports and alerts, and much more.
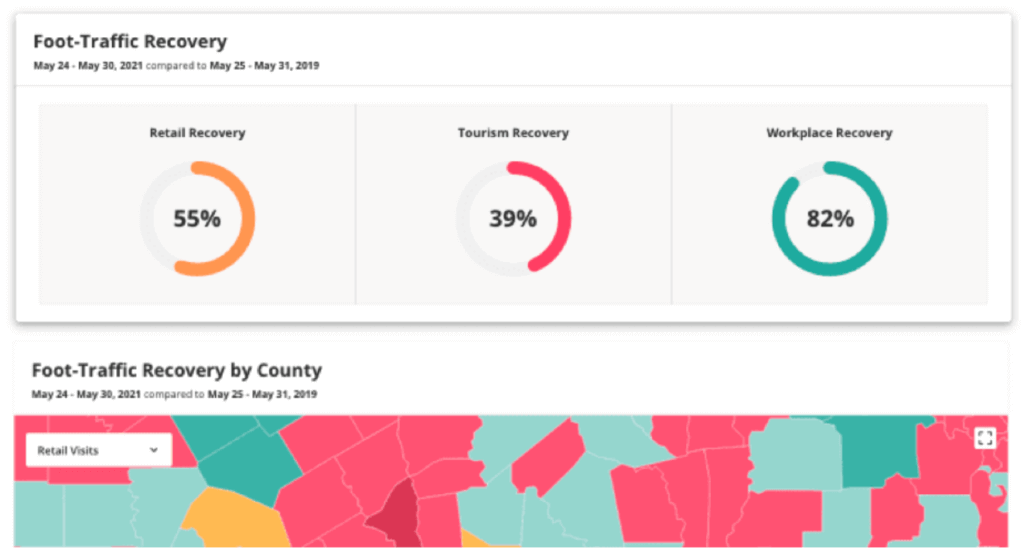
COVID-19 Economic Recovery Dashboard
The platform’s user interface must be fully customized to fit the needs of its different user types across verticals AND within companies (business users, data scientists, data analysts, third party users). An example of how we’ve begun to do this is a portfolio overview section for CRE analysts to rapidly scan properties’ performance metrics. Another is our COVID-19 Recovery Dashboard, particularly used by civic organizations to assess the impact of the pandemic on local economic areas.
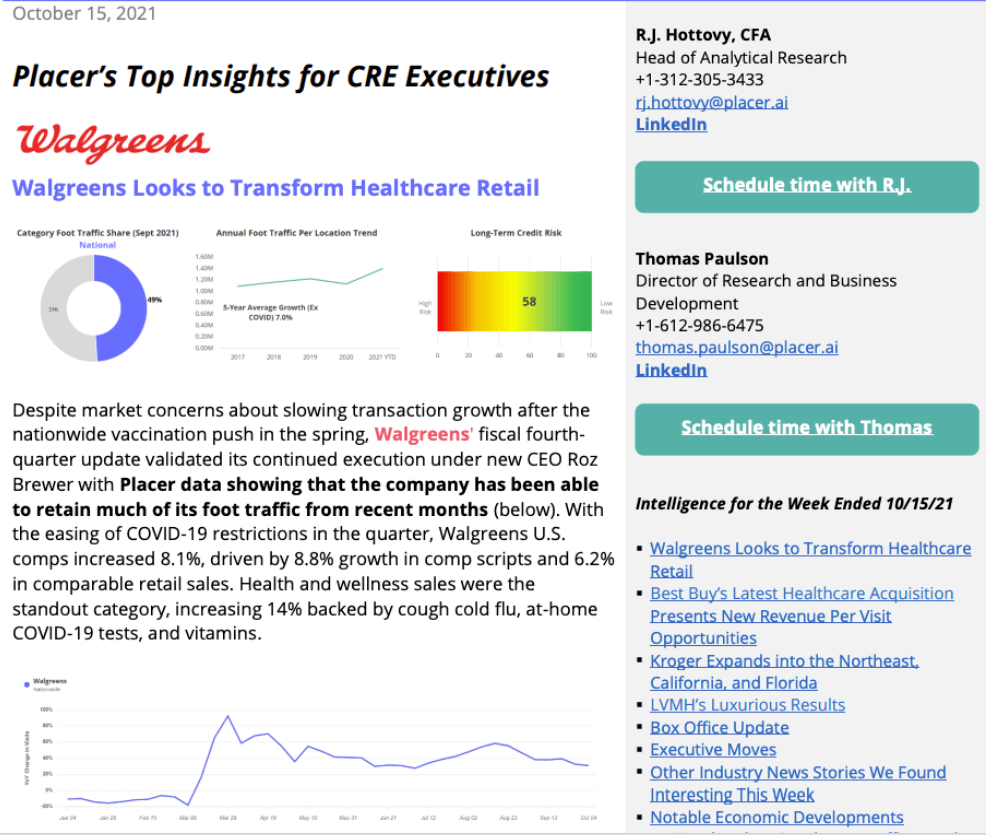
The Anchor: Placer's CRE Executive Intelligence Report
As we presented “just data”, we quickly realized some customers were looking for humans to add a “research layer” and context around the data. So an analytical research team has become part of the product. They capture and present key market intelligence, respond to the latest industry trends and customer interests. “The Anchor”, a weekly CRE executive intelligence report launched last September, has now become an inbox staple for many of our customers.
Let’s build it!
To our current understanding, we’re just “5%” of the way to our Market Intelligence Platform vision. The remaining 95% will be built by scaling POI coverage, datasets, answering more questions and developing the other core components of the platform.
So our focus now is on ramping up the velocity of this development. And to do that, we need even more of the world’s best talent across the company.
So, during 2022, we will use our new capital to double the size of our engineering team and significantly expand the data at our disposal. In parallel, we will also channel more resources to supporting our customers and contributing to industry understanding through our analytical research department and educational content.
Placer.ai is committed to transforming the way real-world businesses make decisions. And we don’t want to waste any time going about it.
Discover the 2025 grocery sector trends driving growth across value, fresh, traditional, and ethnic formats. Learn how shifting consumer behavior, bifurcated spending, and short-trip missions are reshaping retail competition.
Placer Research
September 22, 2025
Key Takeaways
1) Broad-based growth: All four grocery formats grew year-over-year in Q2 2025, with traditional grocers posting their first rebound since early 2024.
2) Value grocers slow: After leading during the 2022–24 trade-down wave, value grocer growth has decelerated as that shift matures.
3) Fresh formats surge: Now the fastest-growing segment, fueled by affluent shoppers seeking health, wellness, and convenience.
4) Bifurcation widens: Growth concentrated at both the low-income (value) and high-income (fresh) ends, highlighting polarized spending.
5) Shopping missions diverge: Short trips are rising, supporting fresh formats, while traditional grocers retain loyal stock-up customers and value chains capture fill-in trips through private labels.
6) Traditional grocers adapt: H-E-B and Harris Teeter outperformed by tailoring strategies to their core geographies and demographics.Bifurcation of Consumer Spending Help Fresh Format Lead Grocery Growth
Growth Across Grocery Formats
Grocery traffic across all four major categories – value grocers, fresh format, traditional grocery, ethnic grocers – was up year over year in Q2 2025 as shoppers continue to engage with a wide range of grocery formats. Traditional grocery posted its first YoY traffic increase since Q1 2024, while ethnic grocers maintained their steady pattern of modest but consistent gains.
Value Grocers Growth Slows as Trade-Down Effect Matures
Value grocers, which dominated growth through most of 2024 as shoppers prioritized affordability, continued to expand but have now ceded leadership to fresh-format grocers. Rising food costs between 2022 and 2024 drove many consumers to chains like Aldi and Lidl, but much of this “trade-down” movement has already occurred. Although price sensitivity still shapes consumer choices – keeping the value segment on an upward trajectory – its growth momentum has slowed, making it less of a driver for the overall sector.
Affluent Shoppers Drive Major Gains for Fresh-Format Grocers
Fresh-format grocers have now taken the lead, posting the strongest YoY traffic gains of any category in 2025. This segment, anchored by players like Sprouts, appeals to the highest-income households of the four categories, signaling a growing influence of affluent shoppers on the competitive grocery landscape. Despite accounting for just 7.0% of total grocery visits in H1 2025, the segment’s rapid gains point to a broader shift: premium brands emphasizing health and wellness are emerging as the primary engine of growth in the grocery sector.
Bifurcation of Spending Reshaping Grocery
The fact that value grocers and fresh-format grocers – segments with the lowest and highest median household incomes among their customer bases – are the two categories driving the most growth underscores how the bifurcation of consumer spending is playing out in the grocery space as well. On one end, price-sensitive shoppers continue to seek out affordable options, while on the other, affluent consumers are fueling demand for premium, health-oriented formats. This dual-track growth pattern highlights how widening economic divides are reshaping competitive dynamics in grocery retail.
Bottom Line:
1) Broad-based growth: All four grocery categories posted YoY traffic gains in Q2 2025.
2) Traditional grocery rebound: First YoY increase since Q1 2024.
3) Ethnic grocers: Continued steady but modest upward trend.
4) Value grocers: Still growing, but slowing after most trade-down activity already occurred (2022–24).
5) Fresh formats: Now the fastest-growing segment, driven by affluent shoppers and interest in health & wellness.
6) Market shift: Premium, health-oriented brands are becoming the new growth driver in grocery.
7) Bifurcation of spending: Growth at both value and fresh-format grocers highlights a polarization in consumer spending patterns that is reshaping grocery competition.
Consumers Turn to Different Grocery Formats for Different Needs
The Rise of Short Trips
Over the past two years, short grocery trips (under 10 minutes) have grown far more quickly than longer visits. While they still make up less than one-quarter of all U.S. grocery trips, their steady expansion suggests this behavioral shift is here to stay and that its full impact on the industry has yet to be realized.
Fresh Formats Capture Quick Missions
One format particularly aligned with this trend is the fresh-format grocer, where average dwell times are shorter than in other categories. Yet despite benefiting from the rise of convenience-driven shopping, fresh formats attract the smallest share of loyal visitors (4+ times per month). This indicates they are rarely used for a primary weekly shop. Instead, they capture supplemental trips from consumers looking for specific needs – unique items, high-quality produce, or a prepared meal – who also value the ability to get in and out quickly.
Traditional Grocers Built on Loyalty
In contrast, leading traditional grocers like H-E-B and Kroger thrive on a classic supermarket model built around frequent, comprehensive shopping trips. With the highest share of loyal visitors (38.5% and 27.6% respectively), they command a reliable customer base coming for full grocery runs and taking time to fill their carts.
Value Grocers as “Fill-In” Players
Value grocers follow a different, but equally effective playbook. Positioned as primary “fill-in” stores, they sit between traditional and fresh formats in both dwell time and visit frequency. Many rely on limited assortments and a heavy emphasis on private-label goods, encouraging shoppers to build larger baskets around basics and store brands. Still, the data suggests consumers reserve their main grocery hauls for traditional supermarkets with broader selections, while using value grocers to stretch budgets and stock up on essentials.
Bottom Line:
1) Short trips surge: Under-10-minute visits have grown fastest, signaling a lasting behavioral shift.
2) Fresh formats thrive on convenience: Small footprints, prepared foods, and specialty items align with quick missions.
3) Traditional grocers retain loyalty: Traditional grocers such as H-E-B and Kroger attract frequent, comprehensive stock-up trips.
4) Value grocers fill the middle ground: Limited assortments and private label drive larger baskets, but main hauls remain with traditional supermarkets.
5) Fresh formats as supplements: Fresh format grocers such as The Fresh Market capture quick, specialized trips rather than weekly shops.
The Right Strategy Can Drive Growth For Traditional Grocers
Traditional Grocers Can Still Win
While broad market trends favor value and fresh-format grocers, certain traditional grocers are proving that a tailored strategy is a powerful tool for success. In the first half of 2025, H-E-B and Harris Teeter significantly outperformed their category's modest 0.6% average year-over-year visit growth, posting impressive gains of 5.6% and 2.8%, respectively. Their success demonstrates that even in a polarizing environment, there is ample room for traditional formats to thrive by deeply understanding and catering to a specific target audience.
Different Paths, Same Focus
These two brands achieve their success with distinctly different, yet equally focused, demographic strategies. H-E-B, a Texas powerhouse, leans heavily into major metropolitan areas like Austin and San Antonio. This urban focus is clear, with 32.6% of its visitors coming from urban centers and their peripheries, far above the category average. Conversely, Harris Teeter has cultivated a strong following in suburban and satellite cities in the South Atlantic region, drawing a massive 78.3% of its traffic from these areas. This deliberate targeting shows that knowing your customer's geography and lifestyle remains a winning formula for growth.
Bottom Line:
1) Traditional grocers can still be competitive: H-E-B (+5.6% YoY) and Harris Teeter (+2.8% YoY) outpaced the category average of +0.6% in H1 2025.
2) H-E-B’s strategy: Strong urban focus, with 32.6% of traffic from major metro areas like Austin and San Antonio.
3) Harris Teeter’s strategy: Suburban and satellite city focus, with 78.3% of traffic from South Atlantic suburbs.
This Placer Snapshot examines the evolution of key industries impacting commercial real estate. We explore the shifting dynamics of office visits, the recovery of shopping centers, and population growth patterns across the United States in 2025.
Find out how the Dollar General, Dollar Tree, and Costco's hyper growth have changed the retail landscape and see how Walmart and Target can stay competitive in today's value-driven market.
August 21, 2025
Key Takeaways:
1. The hypergrowth of Costco, Dollar Tree, and Dollar General between 2019 and 2025 has fundamentally changed the brick-and-mortar retail landscape.
2. Overall visits to Target and Walmart have remained essentially stable even as traffic to the new retail giants skyrocketed – so the increased competition is not necessarily coming at legacy giants' expense. Instead, each retail giant is filling a different need, and success now requires excelling at specific shopping missions rather than broad market dominance.
3. Cross-shopping has become the new normal, with Walmart and Target maintaining their popularity even as their relative visit shares decline, creating opportunities for complementary rather than purely competitive strategies.
4. Dollar stores are rapidly graduating from "fill-in" destinations to primary shopping locations, signaling a fundamental shift in how Americans approach everyday retail.
5. Walmart still enjoys the highest visit frequency, but the other four chains – and especially Dollar General – are gaining ground in this realm.
6. Geographic and demographic specialization is becoming the key differentiator, as each chain carves out distinct niches rather than competing head-to-head across all markets and customer segments.
Shifting Retail Dynamics
Evolving shopper priorities, economic pressures, and new competitors are reshaping how and where Americans buy everyday goods. And as value-focused players gain ground, legacy retail powerhouses are adapting their strategies in a bid to maintain their visit share. In this new consumer reality, shoppers no longer stick to one lane, creating a complex ecosystem where loyalty, geography, and cross-visitation patterns – not just market share – define who is truly winning.
This report explores the latest retail traffic data for Walmart, Target, Costco, Dollar Tree, and Dollar General to decode what consumers want from retail giants in 2025. By analyzing visit patterns, loyalty trends, and cross-shopping shifts, we reveal how fast-growing chains are winning over consumers and uncover the strategies helping legacy players stay competitive in today's value-driven retail landscape.
The New Competitive Landscape
Dollar General, Dollar Tree, and Costco's Hypergrowth Since 2019
In 2019, Walmart and Target were the two major behemoths in the brick-and-mortar retail space. And while traffic to these chains remains close to 2019 levels, overall visits to Dollar General, Dollar Tree, and Costco have increased 36.6% to 45.9% in the past six years. Much of the growth was driven by aggressivestore expansions, but average visits per location stayed constant (in the case of Dollar Tree) or grew as well (in the case of Dollar General and Costco). This means that these chains are successfully filling new stores with visitors – consumers who in the past may have gone to Walmart or Target for at least some of the items now purchased at wholesale clubs and dollar stores.
This substantial increase in visits to Costco, Dollar General, and Dollar Tree has altered the competitive landscape in which Walmart and Target operate. In 2019, 55.9% of combined visits to the five retailers went to Walmart. Now, Walmart’s relative visit share is less than 50%. Target received the second-highest share of visits to the five retailers in 2019, with 15.9% of combined traffic to the chains. But Between January and July 2025, Dollar General received more visits than Target – even though the discount store had received just 12.1% of combined visits in 2019.
Some of the growth of the new retail giants could be attributed to well-timed expansion. But the success of these chains is also due to the extreme value orientation of U.S. consumers in recent years. Dollar General, Dollar Tree, and Costco each offer a unique value proposition, giving today's increasingly budget-conscious shoppers more options.
The Role of Each Retail Giant in the Wider Retail Ecosystem
Walmart’s strategy of "everyday low prices" and its strongholds in rural and semi-rural areas reflect its emphasis on serving broad, value-focused households – often catering to essential, non-discretionary shopping.
Dollar General serves an even larger share of rural and semi-rural shoppers than Walmart, following its strategy of bringing a curated selection of everyday basics to underserved communities. The retailer's packaging is typically smaller than Walmart's, which allows Dollar General to price each item very affordably – and its geographic concentration in rural and semi-rural areas also highlights its direct competition to Walmart.
By contrast, Target and Costco both compete for consumer attention in suburban and small city settings, where shopper profiles tilt more toward families seeking one-stop-shopping and broader discretionary offerings. But Costco's audience skews slightly more affluent – the retailer attracts consumers who can afford the membership fees and bulk purchasing requirements – and its visit growth may be partially driven by higher income Target shoppers now shopping at Costco.
Dollar Tree, meanwhile, showcases a uniquely balanced real estate strategy. The chain's primary strength lies in suburban and small cities but it maintains a solid footing in both rural and urban areas. The chain also offers a unique value proposition, with a smaller store format and a fixed $1.25 price point on most items. So while the retailer isn't consistently cheaper than Walmart or Dollar General across all products, its convenience and predictability are helping it cement its role as a go-to chain for quick shopping trips or small quantities of discretionary items. And its versatile, three-pronged geographic footprint allows it to compete across diverse markets: Dollar Tree can serve as a convenient, quick-trip alternative to big-box retailers in the suburbs while also providing essential value in both rural and dense urban communities.
As each chain carves out distinct geographic and demographic niches, success increasingly depends on being the best option for particular shopping missions (bulk buying, quick trips, essential needs) rather than trying to be everything to everyone.
Cross-Shopping on the Rise Despite Visit Share Shuffle
Still, despite – or perhaps due to – the increased competition, shoppers are increasingly spreading their visits across multiple retailers: Cross-shopping between major chains rose significantly between 2019 and 2025. And Walmart remains the most popular brick-and-mortar retailer, consistently ranking as the most popular cross-shopping destination for visitors of every other chain, followed by Target.
This creates an interesting paradox when viewed alongside the overall visit share shift. Even as Walmart and Target's total share of visits has declined, their importance as a secondary stop has actually grown. This suggests that the legacy retail giants' dip in market share isn't due to shoppers abandoning them. Instead, consumers are expanding their shopping routines by visiting other growing chains in addition to their regular trips to Walmart and Target, effectively diluting the giants' share of a larger, more fragmented retail landscape.
Cross-visitation to Costco from Walmart, Target, and Dollar Tree also grew between 2019 and 2025, suggesting that Costco is attracting a more varied audience to its stores.
But the most significant jumps in cross-visitation went to Dollar Tree and Dollar General, with cross-visitation to these chains from Target, Walmart, and Costco doubling or tripling over the past six years. This suggests that these brands are rapidly graduating from “fill-in” fare to primary shopping destinations for millions of households.
The dramatic rise in cross-visitation to dollar stores signals an opportunity for all retailers to identify and capitalize on specific shopping missions while building complementary partnerships rather than viewing every chain as direct competition.
Competition For Visit Frequency in a Fragmented Retail Landscape
Walmart’s status as the go-to destination for essential, non-discretionary spending is clearly reflected in its exceptional loyalty rates – nearly half its visitors return at least three times per month on average -between January to July 2025, a figure virtually unchanged since 2019. This steady high-frequency visitation underscores how necessity-driven shopping anchors customer routines and keeps Walmart atop the retail loyalty ranks.
But the data also reveals that other retail giants – and Dollar General in particular – are steadily gaining ground. Dollar General's increased visit frequency is largely fueled by its strategic emphasis on adding fresh produce and other grocery items, making it a viable everyday stop for more households and positioning it to compete more directly with Walmart.
Target also demonstrates a notable uptick in loyal visitors, with its share of frequent shoppers visiting at least three times a month rising from 20.1% to 23.6% between 2019 and 2025. This growth may suggest that its strategic initiatives – like the popular Drive Up service, same-day delivery options, and an appealing mix of essentials and exclusive brands – are successfully converting some casual shoppers into repeat customers.
Costco stands out for a different reason: while overall visits increased, loyalty rates remained essentially unchanged. This speaks to Costco’s unique position as a membership-based outlet for targeted bulk and premium-value purchases, where the shopping behavior of new visitors tends to follow the same patterns as those of its already-loyal core. As a result, trip frequency – rooted largely in planned stock-ups – remains remarkably consistent even as the warehouse giant grows foot traffic overall.
Dollar Tree currently has the smallest share of repeat visitors but is improving this metric. As it successfully encourages more frequent trips and narrows the loyalty gap with its larger rivals, it's poised to become an increasing source of competition for both Target and Costco.
The increase in repeat visits and cross-shopping across the five retail giants showcases consumers' current appetite for value-oriented mass merchants and discount chains. And although the retail giants landscape may be more fragmented, the data also reveals that the pie itself has grown significantly – so the increased competition does not necessarily need to come at the expense of legacy retail giants.
The Path Forward
The retail landscape of 2025 demands a fundamental shift from zero-sum competition to strategic complementarity, where success lies in owning specific shopping missions rather than fighting for total market dominance. Retailers that forego attempting to compete on every front and instead clearly communicate their mission-specific value propositions – whether that's emergency runs, bulk essentials, or family shopping experiences – may come out on top.


.svg)


.png)