

.svg)


Thank you! Your submission has been received!
Oops! Something went wrong while submitting the form.
0
0
0
0
----------
0
0
Articles
Article
CVS and Walgreens in 2025Find out how CVS and Walgreens are adapting to increased competition - and what lies ahead for the two drugstore chains.
Bracha Arnold
Mar 26, 2025
4 minutes

Article
Target’s Bet on Babies Find out how Target's new baby and toddler products might resonate with its shoppers.
Shira Petrack
Mar 25, 2025
1 minute
Article
Trader Joe’s and Aldi’s Continued SuccessFind out what lies behind Trader Joe's and Aldi's continued grocery success.
Bracha Arnold
Mar 25, 2025
4 minutes

Article
Retailers Betting on High Income HouseholdsFind out how high-income households are driving retail in a challenging economic environment.
Elizabeth Lafontaine
Mar 24, 2025
5 minutes

Article
Brooks Brothers Rightsizing SuccessFind out how Brooks Brothers has faced economic challenges head-on to come out the other side.
Bracha Arnold
Mar 21, 2025
2 minutes
Article
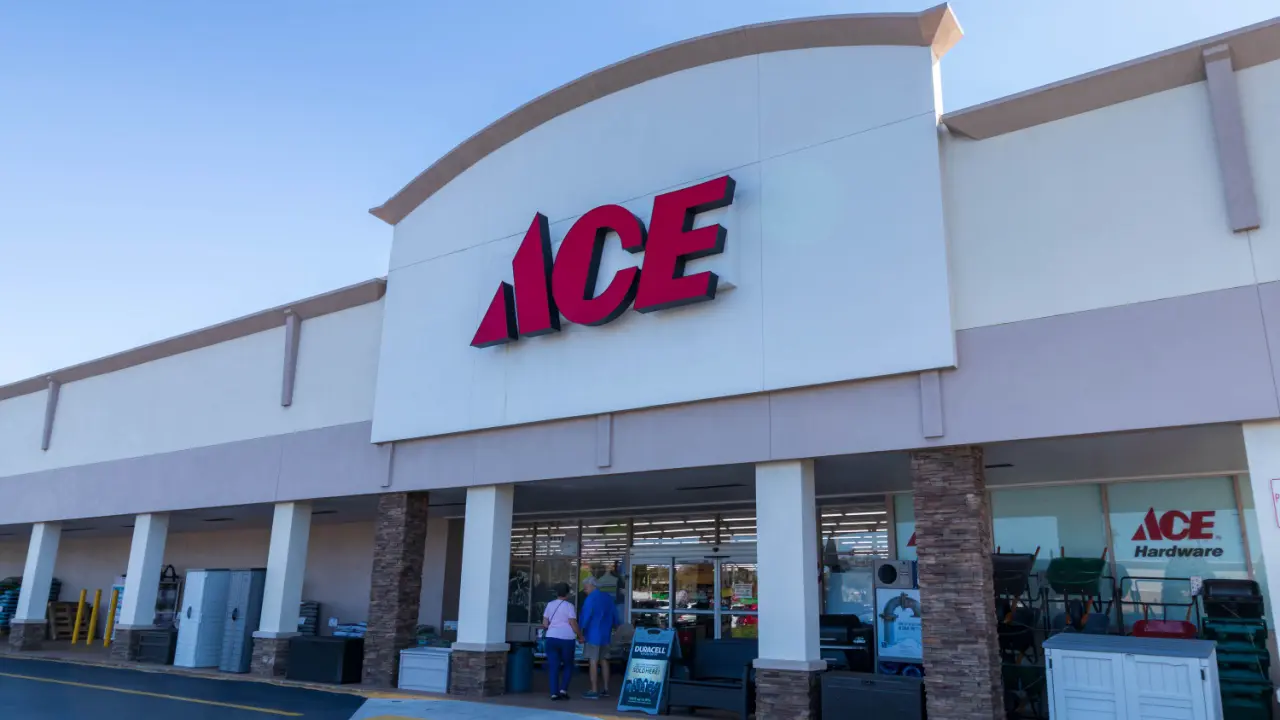
The Rise of Smaller-Format Home Improvement Retailers: How Ace Hardware and Harbor Freight Are Outpacing Big-Box ChainsFind out how Ace Hardware and Harbor Freight Tools are outperforming the industry.
R.J. Hottovy
Mar 20, 2025
1 minute
Reports
INSIDER
Q4 2023 Quarterly IndexFind out how the Fitness, Beauty & Self Care, Discount & Dollar Stores, Superstores, Grocery Stores, and Dining categories fared during last year’s all-important holiday shopping season.
February 15, 2024
6 minutes
INSIDER
10 Top Brands to Watch in 2024This report analyzes the latest location intelligence data to identify ten brands poised to succeed in 2024.
February 8, 2024

INSIDER
The Retail Opportunity of StadiumsDive into the location intelligence to understand the significant retail and dining opportunities in and around major stadiums – both during games and in the off-season.
January 11, 2024
7 minutes
Loading results...
We couldn't find anything matching your search.
Browse one of our topic pages to help find what you're looking for.
For more in-depth analyses on a variety of subjects, explore Reports.
For more in-depth analyses on a variety of subjects, explore Reports.

INSIDER
Stay Anchored: Subscribe to Insider & Unlock more Foot Traffic Insights
Gain insider insights with our in-depth analytics crafted by industry experts
— giving you the knowledge and edge to stay ahead.

