

.svg)


Thank you! Your submission has been received!
Oops! Something went wrong while submitting the form.
0
0
0
0
----------
0
0
Articles

Article
The Dining Habits of College StudentsFind out where college students like to eat out, and how brands can best cater to their preferences.
Lila Margalit
Apr 2, 2025
4 minutes
Article
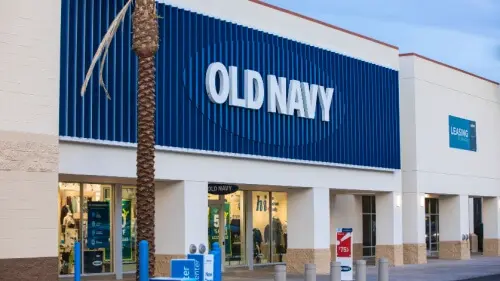
Old Navy's Foray Into OccasionwearFind out how Old Navy's newly introduced occasionwear has impacted visits at its stores.
Shira Petrack
Apr 1, 2025
1 minute
Article
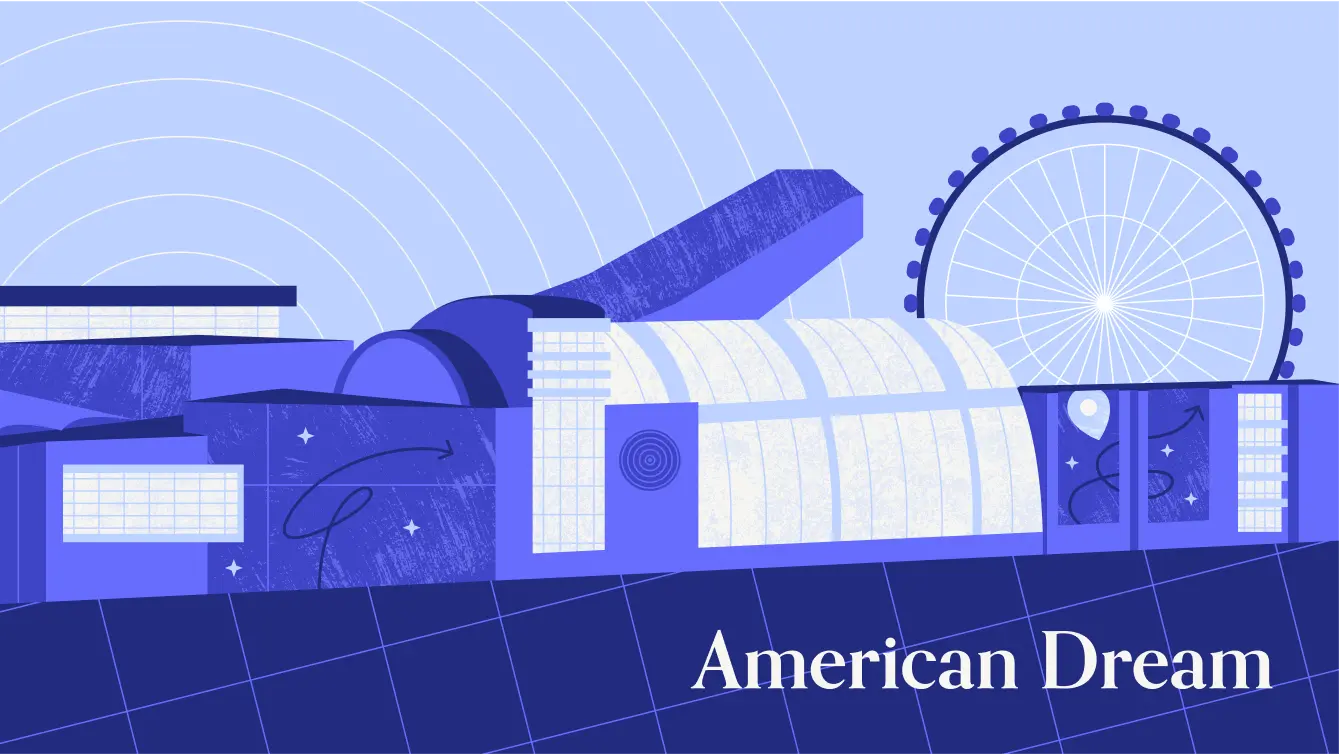
JonasCon Brings Even More Experiential to American Dream Find out how foot traffic to the American Dream mall was impacted by the recent JonasCon hosted there, and what its success means for the future of malls.
Shira Petrack
Apr 1, 2025
4 minutes

Article
What Happened to Family Dollar? Find out what lies behind Dollar Tree's recent decision to sell Family Dollar.
Shira Petrack
Mar 31, 2025
5 minutes
Article
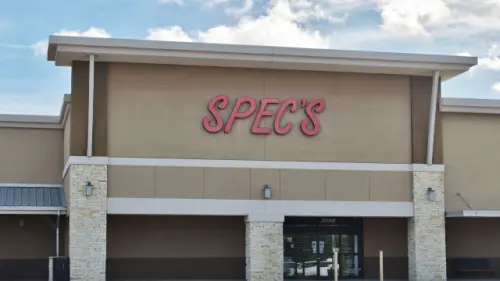
The Impending Transformation of Bev-Alc RetailFind out how the BevAlc segment is performing amid potential industry headwinds.
Elizabeth Lafontaine
Mar 28, 2025
5 minutes

Article
The Changing Apparel Landscape in 2025The apparel space has faced considerable headwinds in recent years – from changing consumer preferences to cutbacks in discretionary spending. We dove into the data for various apparel categories to explore emerging industry trends and see what foot traffic patterns can tell us about the state of apparel in 2025.
Ezra Carmel
Mar 27, 2025
4 minutes
Reports
INSIDER
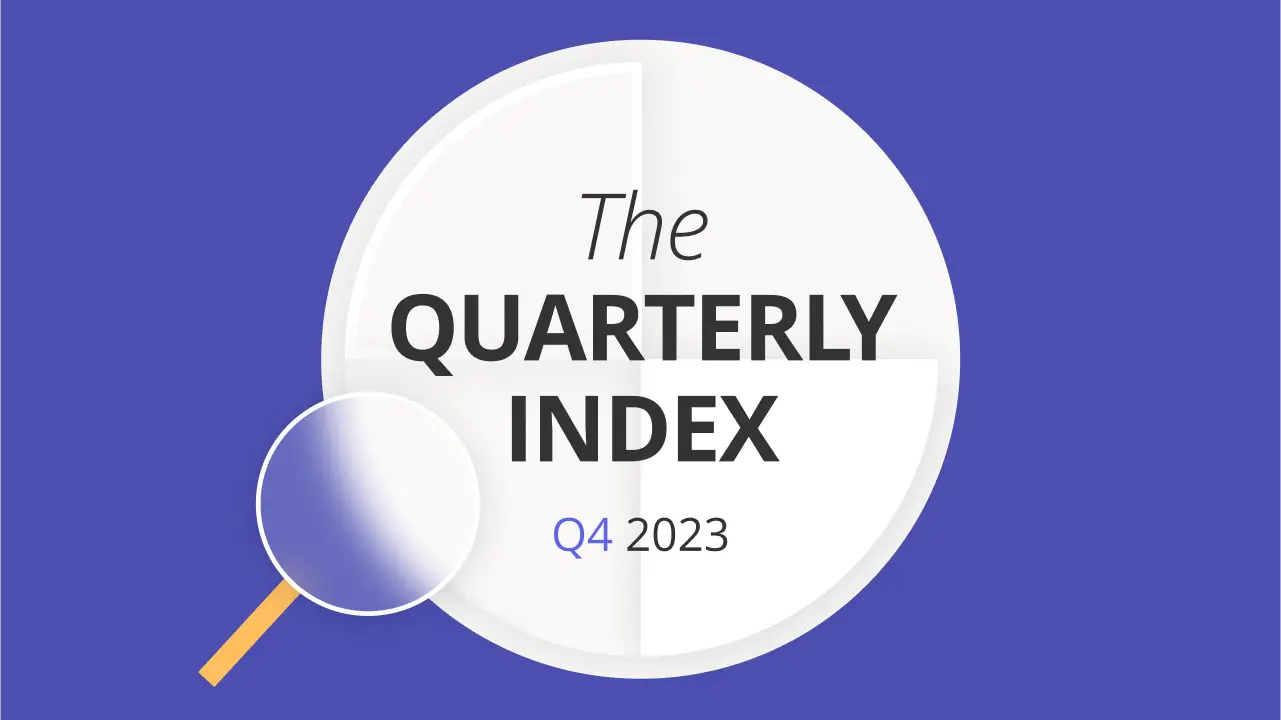
Q4 2023 Quarterly IndexFind out how the Fitness, Beauty & Self Care, Discount & Dollar Stores, Superstores, Grocery Stores, and Dining categories fared during last year’s all-important holiday shopping season.
February 15, 2024
6 minutes
INSIDER
10 Top Brands to Watch in 2024This report analyzes the latest location intelligence data to identify ten brands poised to succeed in 2024.
February 8, 2024

INSIDER
The Retail Opportunity of StadiumsDive into the location intelligence to understand the significant retail and dining opportunities in and around major stadiums – both during games and in the off-season.
January 11, 2024
7 minutes
Loading results...
We couldn't find anything matching your search.
Browse one of our topic pages to help find what you're looking for.
For more in-depth analyses on a variety of subjects, explore Reports.
For more in-depth analyses on a variety of subjects, explore Reports.

INSIDER
Stay Anchored: Subscribe to Insider & Unlock more Foot Traffic Insights
Gain insider insights with our in-depth analytics crafted by industry experts
— giving you the knowledge and edge to stay ahead.

