

.svg)


Thank you! Your submission has been received!
Oops! Something went wrong while submitting the form.
0
0
0
0
----------
0
0
Articles
.avif)
.avif)
Article
The Devil Wears Prada 2 Helps Stabilize Theater TrafficApril 2026 theater traffic lagged tough YoY comps, though The Devil Wears Prada 2 helped stabilize visits ahead of expected blockbuster-driven spikes.
Shira Petrack
May 11, 2026
1 minute
%20(1).avif)
Article
Placer.ai April 2026 Mall Index: Back to Growth April 2026 mall data shows rising foot traffic and shorter visit durations, highlighting an increase in mission-driven trips alongside strong demand for experiential shopping.
Shira Petrack
May 8, 2026
2 minutes
.avif)
Article
Home Improvement's Long Winter May Be ThawingAfter several quarters of visit declines, Home Depot and Lowe's are both posting positive foot traffic growth heading into spring 2026. Placer.ai's latest data explores what's driving the recovery.
Lila Margalit
May 7, 2026
3 minutes
Article
In-Person Entertainment Audiences in Dallas and LA – Market Trends and Venue-Level NuanceA data-driven look at Dallas and Los Angeles reveals audience segments across stadiums, arenas, and experiential entertainment formats.
Ezra Carmel
May 6, 2026
4 minutes
Article
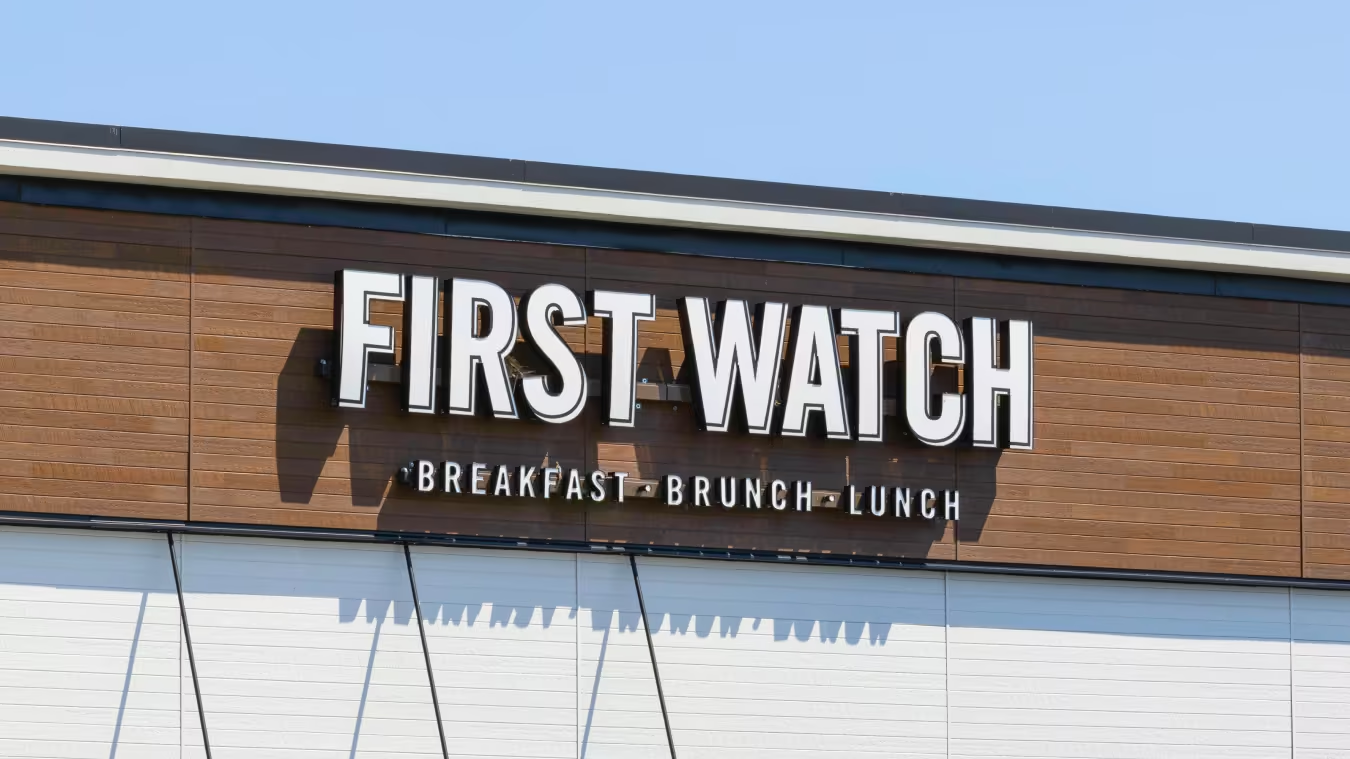
The Reinvention of the Breakfast-First Restaurant CategoryFirst Watch is pulling ahead in the breakfast category with strong visit growth, scalable expansion, and a premium customer base – outpacing legacy diners and redefining daytime dining.
R.J. Hottovy
May 5, 2026
4 minutes
Reports
INSIDER
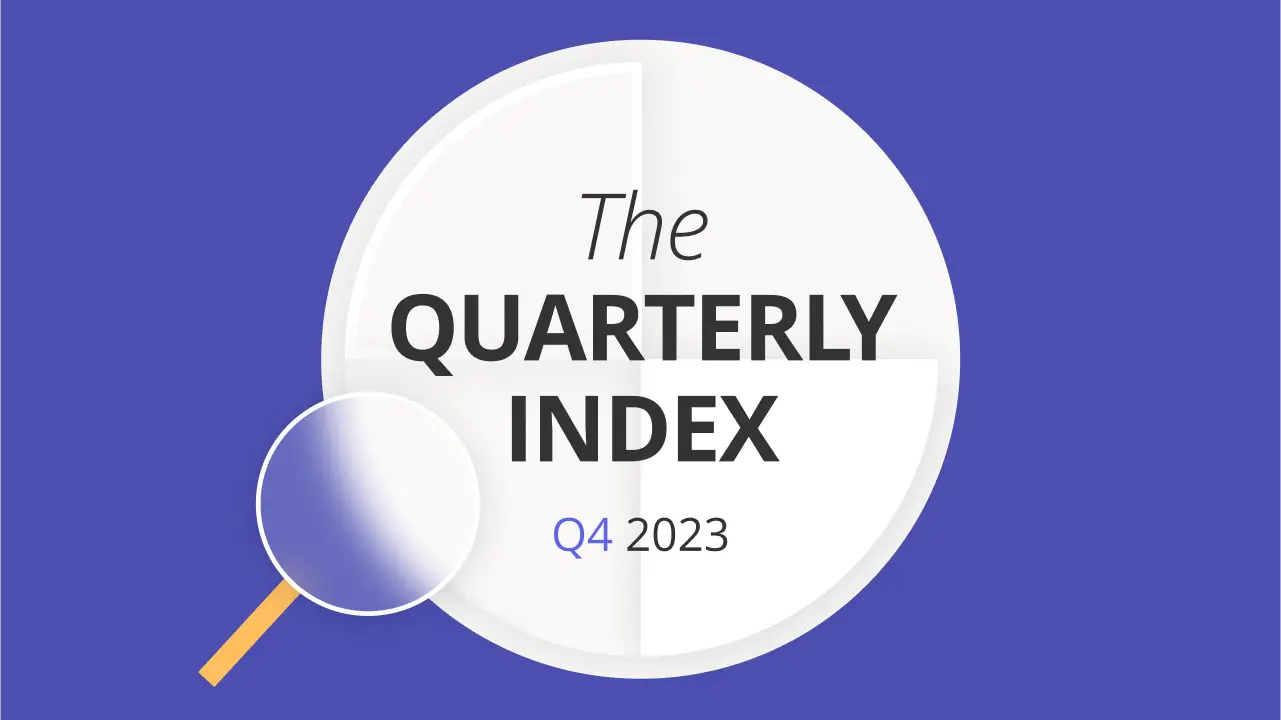
Q4 2023 Quarterly IndexFind out how the Fitness, Beauty & Self Care, Discount & Dollar Stores, Superstores, Grocery Stores, and Dining categories fared during last year’s all-important holiday shopping season.
February 15, 2024
6 minutes
INSIDER
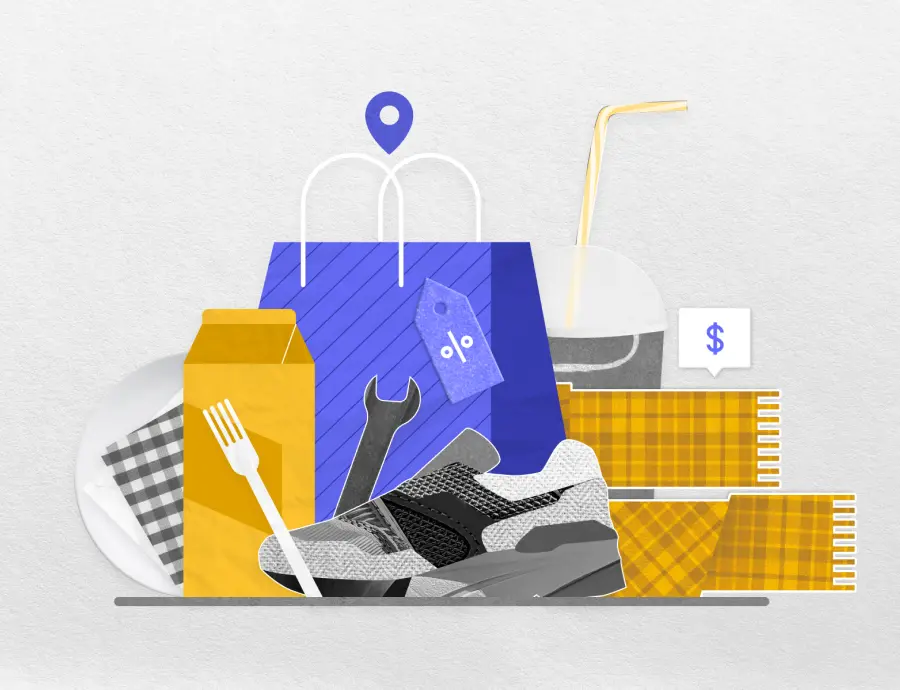
10 Top Brands to Watch in 2024This report analyzes the latest location intelligence data to identify ten brands poised to succeed in 2024.
February 8, 2024
INSIDER
The Retail Opportunity of StadiumsDive into the location intelligence to understand the significant retail and dining opportunities in and around major stadiums – both during games and in the off-season.
January 11, 2024
7 minutes
Loading results...
We couldn't find anything matching your search.
Browse one of our topic pages to help find what you're looking for.
For more in-depth analyses on a variety of subjects, explore Reports.
For more in-depth analyses on a variety of subjects, explore Reports.

INSIDER
Stay Anchored: Subscribe to Insider & Unlock more Foot Traffic Insights
Gain insider insights with our in-depth analytics crafted by industry experts
— giving you the knowledge and edge to stay ahead.

