Understanding Today’s Shopper
Consumer preferences have shifted over the past five years. COVID-19 and inflation impacted shopping habits and behaviors across the retail space – and while some of the changes were short-lived, others appear to have more staying power. Now, with memories of the lockdowns fading, and as the inflation that plagued much of 2022 and 2023 wanes (hopefully), we analyzed location intelligence data to understand what the retail and dining landscape looks like today.
This report leverages historical and current foot traffic data and trade area analysis to better understand the current retail and dining landscape and reveal consumer trends likely to shape 2024 and beyond. Which segments have benefited most from the shifts of the past five years? How are legacy brands staying on top of current shopping and dining trends? Where are people shopping and dining in 2024? And what characterizes the modern consumer?
Slow And Steady Wins: The Changes That Are Here To Stay
Behavioral Shifts Or New Trends?
One of the major retail stories of the past five years has been the rise of Discount & Dollar Stores. Category leaders such as Dollar General and Dollar Tree expanded significantly prior to the pandemic, which helped these essential retailers attract large numbers of customers during the initial months of lockdowns.
During this period, many Discount & Dollar Stores invested in more than just their store count – several leading chains also expanded their grocery selection, allowing these companies to compete more directly for Grocery and Superstore shoppers. As Discount & Dollar Stores continued growing their store fleets – and as the pandemic gave way to inflation concerns – shoppers looking for more affordable consumables options gravitated to this segment.
Location intelligence shows that the rapidly opening stores and stocking them with fresh groceries is working – since 2019, Discount & Dollar Stores have slowly but steadily grown their visit share relative to the Grocery and Superstore sectors.
In 2019, Discount & Dollar retailers captured 15.1% of the visit share between the three categories analyzed. This number grew by a full percentage point between 2019 and 2020 and the trend has continued, with the category enjoying 16.6% of the relative visit share in 2023. Meanwhile, Superstores’ relative visit share decreased during the same period, dropping from 41.7% in 2019 to 40.0% in 2023, while the relative visit share of Grocery Stores remained mostly stable.
Still, consumers are not giving up their regular Grocery or Superstore run quite yet – over 80% of combined visits to Grocery Stores, Superstore, and Discount & Dollar Store sectors still go to Grocery Stores and Superstores. But the data does indicate that some shoppers are likely choosing to shop for groceries and other consumables at Discount & Dollar Stores. And CPG companies and category managers looking to reach customers where they shop may want to consider adding Discount & Dollar Stores to their distribution channels.
The key question that remains is how much of the gained visit share can the Discount & Dollar leaders maintain as the economic environment improves. This metric will be the strongest sign of whether the short term gains made within a favorable context drove long term value.
Superstore Segment Shifts
Superstores’ visit share may be shrinking somewhat in the face of Discount & Dollar Stores’ growth. But diving into the Superstore leaders reveals that these macro-shifts are having a different impact on the various sub-categories within the wider Superstore segment.
Walmart remains the undisputed Superstore leader thanks to its 61.8% share of overall visits to Walmart, Target, Costco, Sam’s Club, and BJ’s in 2023. But 61.8% is still lower than the 66.3% relative visits share that the Superstore behemoth enjoyed in 2019. Meanwhile, Target grew its relative visit share from 17.3% in 2019 to 19.3% in 2023, while the combined visit share of the three membership club brands increased from 16.5% in 2019 to 18.9% in the same period.
Some of the shift in visit share can be attributed to Walmart closing several locations while Target, Costco Sam's Club, and BJ's expanded their fleet – but other factors are likely at play.
Costco and Target attract the most affluent clientele of the five chains analyzed, which could explain why these chains have seen significant growth at a time when many consumers are operating with tighter budgets. The success of these companies also suggests that there are enough consumers willing to spend beyond the basics – as shown with Target’s Stanley Cup success (more on that below) – to support a varied product selection that includes higher-priced options. It also speaks to a high upside on a per customer basis for chains that have proven effective at providing higher-end products alongside those with a value orientation. This speaks to a unique capacity to effectively address “the middle” – an audience that is defined neither solely by value-seeking nor by high-end product proclivities.
Sam's Club and BJ’s also give shoppers an opportunity to save by buying in bulk and cutting down on shopping trips – and related gas expenses – which may also have contributed to their success. The increase in the relative visit share of wholesale clubs indicates that today’s consumer might react positively to more options for bulk purchases in non-warehouse club chains as well.
The Evolution of Food Away From Home
Retail is not the only sector that has seen slow and steady shifts in recent years – the dining space was also significantly impacted by pandemic restrictions of 2020-2021 and the inflation of 2022-2023. Location intelligence reveals shifts in both the types of establishments favored by consumers and in the in-store behaviors of dining consumers.
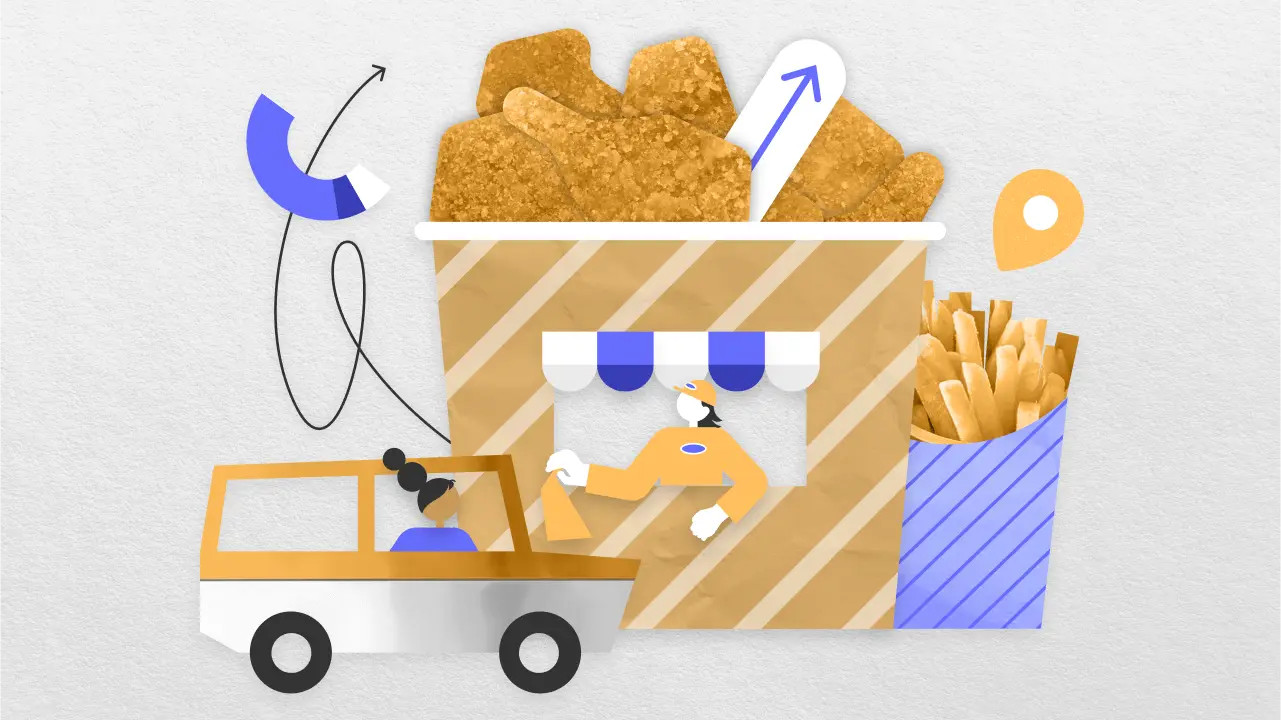
C-Stores Gaining in the Battle of the Stomach
Convenience stores’ dining options have evolved in recent years, with today’s consumers heading to Wawa for a freshly made specialty hoagie or to Buc-ee’s to enjoy the chain’s variety of specialty snacks.
Analyzing the visit distribution among C-Stores and other discretionary dining categories (Fast Food and QSR, Restaurants, and Breakfast & Coffee, not including Grocery and Superstores) showcases the growing role of C-Stores in the dining space. Between 2019 and 2023, C-stores' visit share relative to the other discretionary dining categories jumped from 24.2% to 27.1%. The relative visit share of Breakfast, Coffee, Bakeries & Dessert Shops also grew slightly during the period. Meanwhile, Restaurants’ relative visit share dropped from 13.8% to 11.7% and Fast Food & QSR’s dipped from 51.8% to 50.6%.
Several factors are likely driving this evolution. Most Restaurants shuttered temporarily at the height of the pandemic while C-Stores remained open – and consumers likely took the opportunity to get acquainted with C-Stores’ food-away-from-home options. And many C-Stores expanded their footprint in recent years, while some dining chains downsized, which likely also contributed to the changes in relative visit share between the segments.
But the continued growth of C-Stores between 2021 and 2022, and again between 2022 and 2023, indicates that many diners are now embracing C-Store food out of choice and not just due to necessity. The rise of the Breakfast, Coffee, Bakeries & Dessert Shops category alongside C-Stores in the past five years may also highlight the current appetite for affordable grab-and-go food options. And with C-Store operators embracing the shifts brought on by the pandemic and actively expanding their food options, diners are increasingly likely to consider C-Stores for their portable meals and packaged snacks.
Food Preferences of C-Stores Visitors
C-Store visitors are increasingly receptive to trying new products at their local c-store. So how can C-Store operators and CPG companies determine which products will best appeal to customers? Analyzing the trade areas of seven major chains – 7-Eleven, Wawa, Casey’s, QuikTrip, Cumberland Farms, Plaid Pantry, and Buc-ee’s – using the Spatial.ai: FollowGraph dataset reveals significant variance in food preferences between the chains’ visitor bases.
For instance, Plaid Pantry visitors were 55% more likely than the nationwide average to fall into the “Asian Food Enthusiasts” segment in 2023, in contrast with Casey’s visitors who are 7% less likely to belong to this psychographic. Residents of the trade areas of QuikTrip and Buc-ee’s rank highest for "Fried Chicken Lovers," while Cumberland Farms and Plaid Pantry visitors register the least interest. C-Store operators, QSR franchisees, packaged food manufacturers, and other stakeholders can leverage these insights to optimize food offerings, identify promising partnership opportunities, and find new venues for product testing.
Shifts In Restaurant Visitor Behavior
While C-Stores stores may be the exciting story of the day, Full-Service Restaurants continue to play a major role in the wider dining landscape. And despite the ongoing economic headwinds, several dining brands and categories are seeing growth – although location intelligence suggests that in-restaurant behavior may be changing as well.
For example, the hourly visits distribution for leading steakhouse chains has shifted over the past five years: Between 2019 and 2023, Texas Roadhouse, LongHorn Steakhouse, and Outback Steakhouse all saw a jump in the share of visits occurring between 2:00 PM and 6:00 PM – not typical steak eating hours.
Outback and Texas Roadhouse offer early bird dinner specials while LongHorn has a happy hour, so some diners may be choosing to visit these restaurant chains earlier in the evening in order to stretch their eating out budget. Other consumers who are still working from home most of the week may also be eating on a more flexible schedule, and these diners may be having more late lunches in 2023 when compared to 2019. Restaurant operators, drink providers, and menu developers may want to adapt their offerings to this emerging mid-afternoon rush.
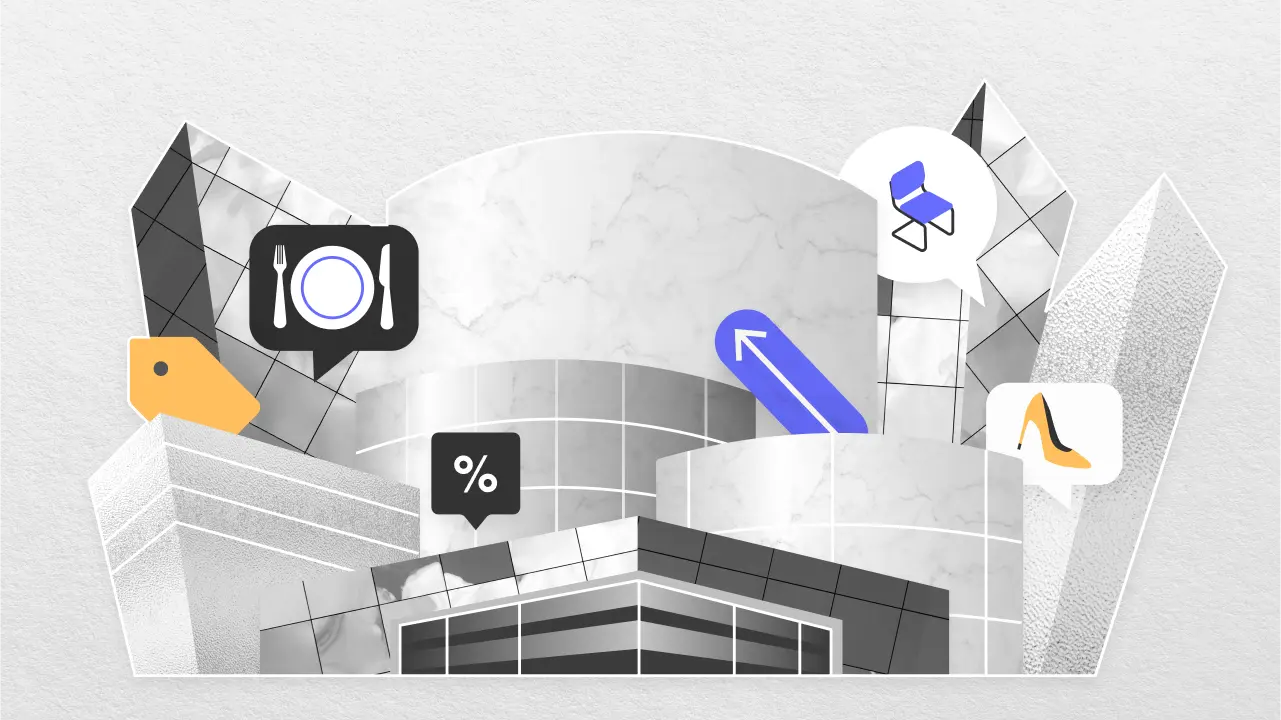
2024’s Retail Kick-Off and Today’s Consumer
The data examined above shows changes within key retail and dining segments over the past five years. So what do these shifts reveal about today’s consumer? What are shoppers and diners looking for in 2024?
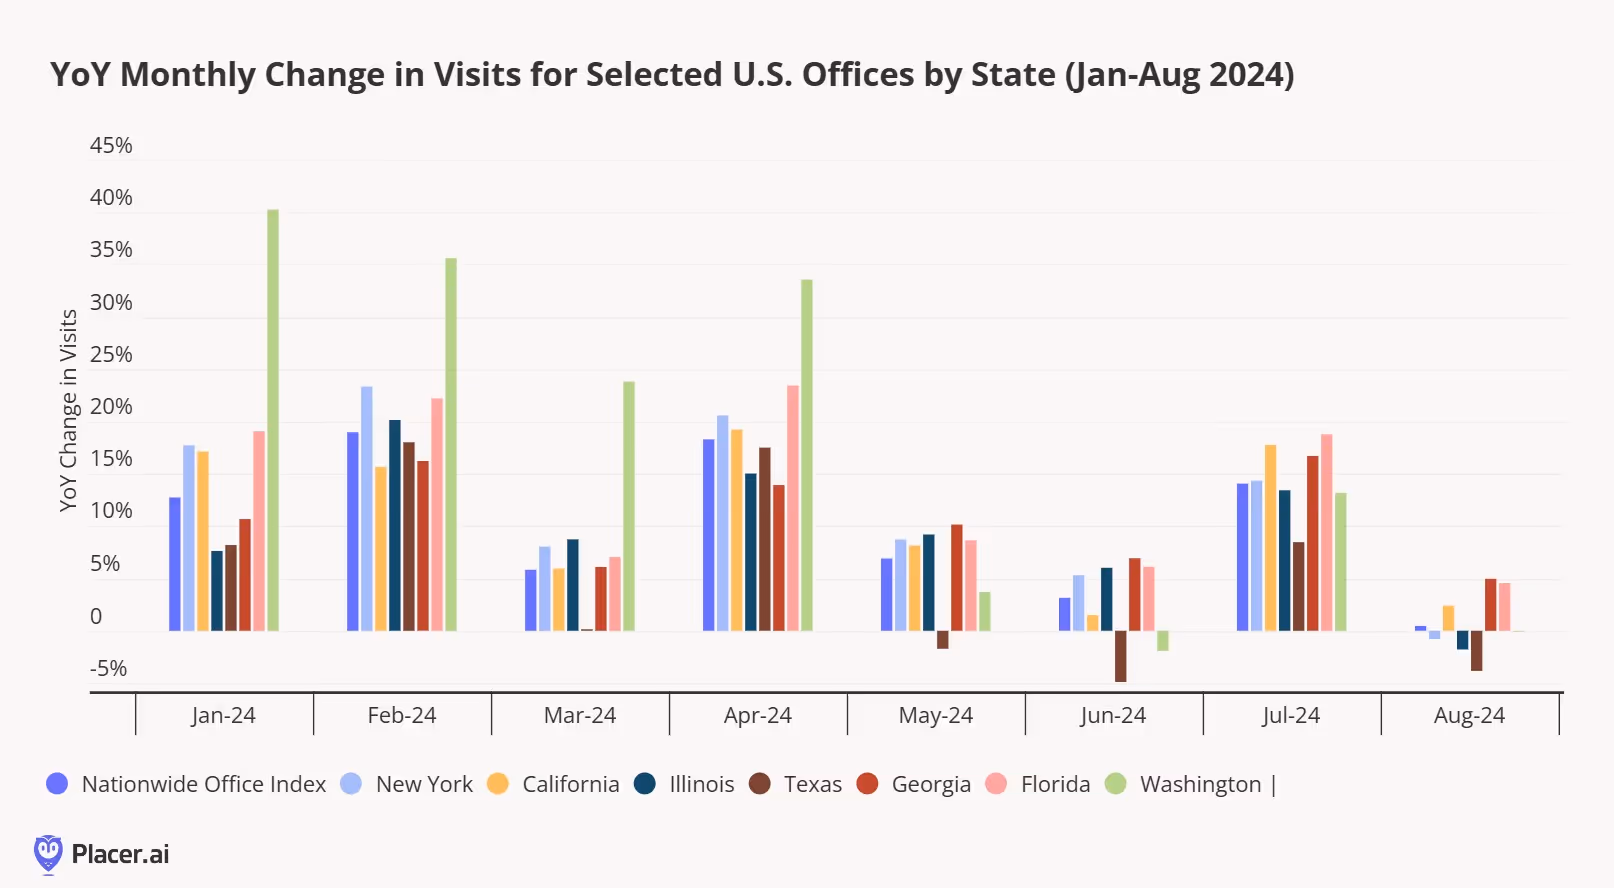
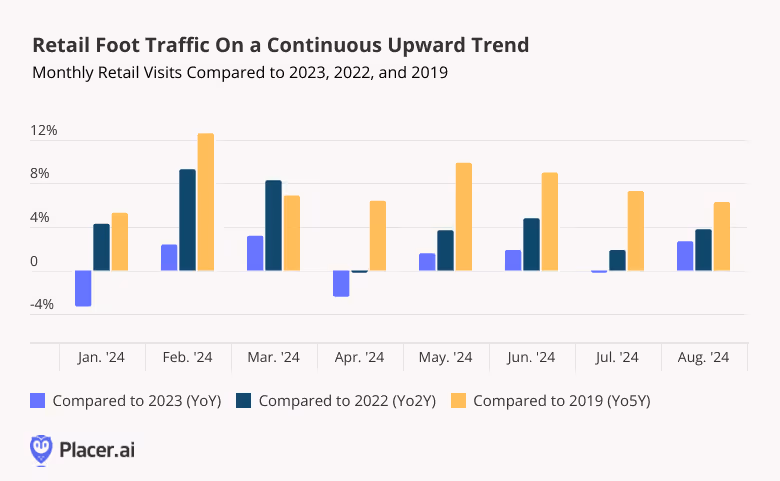
YoY Visits Already Up Across Categories
The beginning of 2024 was marked by an Arctic blast and plunging temperatures. Consumers, unsurprisingly, hunkered down at home – and foot traffic to many retail categories took a dip. But the declines were short-lived, and by the fourth week of January 2024 foot traffic had rebounded across major categories.
Still, zooming into weekly visit performance for key retail and dining categories for the first eight weeks of the year reveals that the cold did not impact all segments equally – and the subsequent resurgence boosted some sectors more than others.
Discount & Dollar Stores had the strongest start to 2024, with YoY visits up almost every week since the start of the year, and the category showing even more substantial growth once the cold spell subsided. The Grocery category also succeeded in exceeding 2023 weekly visit levels almost every week, although its visit increases were more subdued than those in the Discount & Dollar Store segment.
Superstore and C-Store experienced relatively muted YoY declines in early January and saw significant weekly visit growth as Q1 progressed, with C-Stores outperforming Superstores by late January 2024. And Dining – which suffered a particularly heavy blow in early 2024 – also rebounded with gusto, offering another strong indicator of the resilience of today’s consumer.
Quick-Service Restaurants: Weathering The Storm
Like in the wider Dining industry, weekly YoY visits to the QSR segment quickly rebounded following the unusual cold of the first three weeks of January 2024. And three chains from across the QSR spectrum – legacy chain Wingstop, rapidly expanding Raising Cane’s, and regional cult favorite Whataburger – are seeing particularly strong foot traffic performances.
Diving deeper into the location intelligence reveals that the three chains’ success may be due in part to their visitor base composition: The trade areas of all three brands included a larger share of four-person households compared to the nationwide average of 24.6%.
Wingstop, Raising Cane’s, and Whataburger’s menus all include larger orders to create shareable meals. And larger households seem to be particularly receptive to dining options that allow them to save money, which could explain the significant share of 4+ person households that visit these chains.
The success of these diverse QSR chains also indicates that, although larger households may have more expenses – and might therefore be more impacted by inflation – they can also drive visits to brands that cater to their needs. So dining operators and food manufacturers looking to attract family demographics may consider offering larger meal combos or larger packaging to help larger households splurge on affordable luxuries without breaking the bank.
Presenting the Winner of the 2024 Stanley Cup… Target
Perhaps the most significant sign that today’s consumers are still willing to spend money on non-essentials is the recent success of the Starbucks X Stanley “Pink Cup”. The cup has caused such a sensation that re-sellers ask for up to six times the original $50 price – and for those unwilling to shell out the big bucks on the cup, enterprising cup owners offer photo shoots with the product for $5.
The Starbucks X Stanley “Pink Cup” was released on January 3rd, 2024 and could only be bought at Starbucks kiosks located inside a Target. Viral videos of the release circulated on social media, showing eager crowds lining up early in the morning for the chance to be first to grab their cup. Location intelligence reveals that these early morning visits were significant enough to change Target’s typical hourly visit pattern.
Foot traffic between 7:00 AM and 9:00 AM on January 3rd, 2024 accounted for 4.4% of daily visits, compared to 2.6% of daily visits occurring during that time slot on a typical Wednesday in January or February. And demand for the pink Stanley cup drove a spike in daily visits as well – overall daily visits to Target on January 3rd were 18.7% higher than the average Wednesday visits in January and February 2024.
The visit trends to Target on Pink Cup Day are particularly impressive given the freezing weather in some regions of the country and because consumers were coming off the holiday shopping season. And the success of the cup shows that 2024’s shopper is willing to show up – especially for a viral product. Creating buzzy marketing campaigns, then, may be the key to driving retail success.
A Strong Start
The retail changes of the past few years have left their mark on how people shop, eat, and spend. And keeping ahead of these changes allows companies and product managers to ensure they can tailor their offerings – whether product selection or marketing campaigns – to the right audience.


.svg)