It’s hard to imagine, but we’ve eclipsed the five year anniversary of the onset of the pandemic lockdowns across the U.S., when the retail industry was transformed overnight. By April 2020, thousands of stores had closed and uncertainty loomed. At the time, it felt like the potential end of physical retail that the industry had been ruminating over for years.
The Resilience of Physical Retail
Five years later, the industry looks mostly like it did at the beginning of 2020. Online shopping did not kill physical retail, and although e-commerce adoption has substantially increased since pre-pandemic – fueled by the spike in new online shoppers in 2020 – the vast majority of retail transactions (over 80%) still occur in brick-and-mortar locations.
At the same time, while the retail industry looks similar to itself structurally, there have been numerous changes at the category level. Many large ticket purchases like consumer electronics and home furnishings that experienced a pull forward in demand during the pandemic waned over the past few years. Visits to apparel retailers and department stores looked, for a while, like they would never recover. And as people emerged from their homes or found their way to TikTok, beauty became the in-demand category that spread like wildfire. Grocery shopping went from a mundane chore to a form of consumer escapism in 2020; in many ways, that behavior has stuck for shoppers as they now frequent more grocery chains in their journey.
We’ve also observed some fundamental changes across U.S. consumers; more workers still work from home than before the pandemic, although return to office numbers keep rising. And many city dwellers who migrated during the peak pandemic period still remain in more suburban and rural areas.
So what have the past five years taught us about U.S. shoppers? First, we’ve learned that consumers are much more resilient than we give them credit for as they demonstrated a remarkable ability to both adapt to unprecedented circumstances and return to their former shopping habits once the situation normalized. Second, consumers are very cyclical in their behaviors and interests – five years after the pandemic’s start, many of the categories that suffered are coming back into their own. And, as consumers face different types of economic uncertainty, we should be optimistic that they can weather different types of storms. But perhaps the key lesson from the past five years has been that brick-and-mortar stores serve a distinct purpose to both retailers and shoppers – and that physical commerce is definitively here to stay.
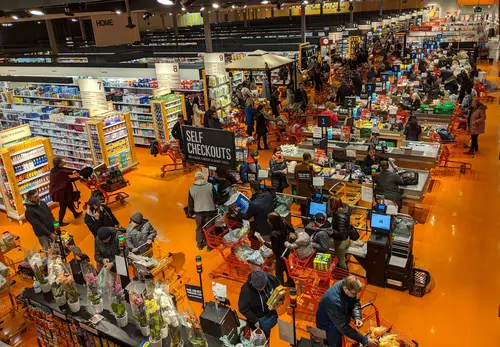
Visits to Brick & Mortar Surpass Pre-Pandemic Levels While Dwell Time Decreases
Looking at the Placer 100 Retail and Dining Index reveals that visits to retail and dining locations not only rebounded from the pandemic, but have surpassed pre-pandemic levels. There are a few underlying causes that could have contributed to these changes: store and unit openings, a higher frequency in visits to certain categories, and increased consumer demand.
At the same time, dwell times across the macro retail industry have shifted since the pandemic as consumers are generally spending less time in stores than they did in 2019. There could be a few reasons contributing to this decrease: a higher adoption of e-commerce as a research tool before visiting a store, a higher utilization of BOPIS and curbside offerings, or more frequent visits leading to shorter individual trips but longer overall time in store. Last year (2024) also saw a higher share of weekday visits compared to the pre-pandemic period, where more consumers shopped on the weekend.
From a consumer perspective, as we wrote about recently, higher income households are more important to the retail industry than prior to the pandemic – even though they account for fewer visits overall. Meanwhile, lower income households are visiting retailers more frequently, especially in essential categories, as they look to combat inflationary pressures that exploded since the pandemic.
Essential Retailers Cemented Their Importance
What did the pandemic reveal about essential retail categories? For many consumers, these segments got them through the peak pandemic time period as discretionary retail locations remained closed. Grocery stores, pharmacies, and superstores provided a sense of normalcy for shoppers as visiting a store became much more than a weekly errand. Today’s shoppers mirror many of those behaviors; they visit these types of retailers more frequently and don’t balk at making an extra trip for that “must-have” item from a specific chain.
Value Retailers Came Out On Top
Looking at the relative share of visits by category shows that dollar and discount stores gained the most visit share compared to the pre-pandemic trends. These chains have invested heavily in fresh food items and assortment expansion to become more of a destination for shoppers, especially those who are more price sensitive. So while visitation growth to dollar store chains did stagnate in 2024, even as retailers continued to expand store fleets, the leading players in this category have already entrenched themselves deeper into consumers' shopping journey compared to the pre-pandemic period.
Similarly, value based grocers and warehouse clubs have become more frequent stops in consumer daily routines, even if their share of visitation hasn’t risen dramatically. These chains have benefitted from changes in consumer behavior over the past five years: Warehouse clubs were well positioned for consumers who migrated from urban to suburban environments, and value grocery stores such as Aldi and Trader Joe’s became a safe haven for consumers trying to combat inflationary pressures as the country emerged from the pandemic.
Drugstores – a COVID-era Winner – Face Challenges
The one sector that hasn’t fared as well? The drugstore channel. The increase in visitation during the vaccine roll out period didn’t result in long term sustained traffic, and drugstores with their expansive store fleet have struggled to find their true value proposition as competition from wellness chains (such as GNC & Vitamin Shoppe), beauty retailers, and superstores grew. Drug-based retailers are still working to right size business today, as further constrained shoppers look elsewhere.
Adapting to Evolving Consumer Needs in Essential Retail
Essential retail players have had to contend with ever-evolving consumer needs in the post-pandemic period and continue to play a key role in the return for normalcy. Some sectors have fared better than others, but those that have emerged as winners looked to stay in lock step with their consumers on their journey. Retailers realized that they didn’t have to be the best at everything – experience, convenience, value, and assortment – but they needed to lean into their speciality to be successful.
Post-Pandemic Hurdles for Discretionary Retail
On the other end of the retail spectrum, discretionary categories have faced headwinds as consumers exited the peak pandemic period. The peak pandemic years (2020 and 2021) were banner years for retail segments that cater to shoppers’ “wants”. But as the need to self-soothe with goods waned and inflationary pressures rose, consumers walked away from many of the retailers who had benefited from their behavioral changes. (The declines in foot traffic in these categories likely also reflected some of the shift to online channels, as most of these retailers were forced to shut their doors during the early days of COVID.)
It’s been a long road to recovery for discretionary businesses, but we began to see some renewed signs of life over the past year. These retailers must remain vigilant in their quest for relevance with shoppers; high levels of uncertainty, debts, and increasing focus on value all still present headwinds for the retail industry – particularly those who focus on satisfying desires instead of needs.
Beauty Visits Normalize Following Post-Pandemic Surge
In reviewing the visitation growth since 2022, discretionary retail could be broken into two performance categories: beauty and everything else. As we’ve written previously, the beauty industry was able to ride the wave of post-lockdown consumer behaviors, including the need to replace outdated products that hadn’t been worn while spending more time at home. At the same time, consumers also became more enamored with mass beauty brands, or those sold at drugstores or mass merchants at lower price points. The success of these brands and retailers that harnessed the power of consumer choice, like Ulta Beauty, intersected with a strong consumer desire for value. And although 2024 was a year of reckoning for the beauty industry as the consumer shifts towards other priorities, the category’s strong success during the early post-pandemic period cannot be overstated.
Post-Pandemic Adjustment for Home Goods and Apparel
The performance of other discretionary segments has been more mixed. Categories that saw meteoric growth during the pandemic lockdowns – such as home furnishings, home improvement and consumer electronics – failed to sustain momentum. Apparel trends, like the rise of athleisure, had helped drive continued demand to retail chains and department stores even without the need for traditional clothing, and as life got back to normal and these trends faded, retailers saw year-over-year declines in visitation.
But the 2024 data began the slow rebound of some of these categories, particularly in home and apparel. Home furnishings, home improvement, and consumer electronics may continue to see a rebound in 2025 as we enter a new replacement cycle and those who purchased these categories during the pandemic look to refresh their homes and upgrade their technology. Apparel’s rebound can be attributed to a resurgence of national brands as increased use of semaglutide medications and an interest in healthy living drive shoppers to revamp their wardrobes.
The one area of discretionary retail that outperformed its competitors and continues to shine? The off-price channel has had an extraordinary few years of visitation growth since the onset of the pandemic. Off-price retailers have enticed consumers with the perfect blend of value orientation, in-store experience, and immediacy that drive repeat visitation and keep shoppers engaged. The success of off-price retail also underscores the continued importance of physical retailers, despite the initial changes in behavior during the pandemic. This sector of discretionary retail is probably best positioned to handle the potential economic uncertainty of 2025 and beyond.
Overall, the discretionary side of the retail industry has begun to recover from its challenging few years of visitation, but 2025 does pose uncertainty that could impact consumers’ disposable income levels. Retailers that cater to consumers’ “wants” must work even harder to stay on their customers’ radar and entice shoppers to come into physical retail locations instead of shopping online or via social media platforms. As mentioned earlier, high income shoppers are going to become even more valuable to this sector of retail as it tries to maintain momentum.
Consumer Resilience and Future Retail Opportunities
The retail industry has undergone a tremendous transformation over the past five years. But while so much has evolved, there is still a lot of opportunity for the industry to be more agile in its ability to satisfy consumer demands. Despite the early days of store closures during the pandemic, physical retail not only bounced back, but has flourished. Retailers continue to focus on upgrading store fleets and opening new stores. Stores have moved away from being experiential to trying to just provide a good shopper experience. Retail’s reality is that consumers still face many challenges ahead, especially economic uncertainty. But, the pandemic highlighted the resilience of both retailers and shoppers to support one another, which will hopefully continue into the future of retail.


.svg)