Are full-service restaurants making a comeback? And what is the state of retail in early 2024? We dove into the data to find out.
Ezra Carmel
Jun 12, 2024
3 minutes
After a frigid start to the year, how have retail and dining foot traffic fared in the subsequent months? We dove into the data to find out.
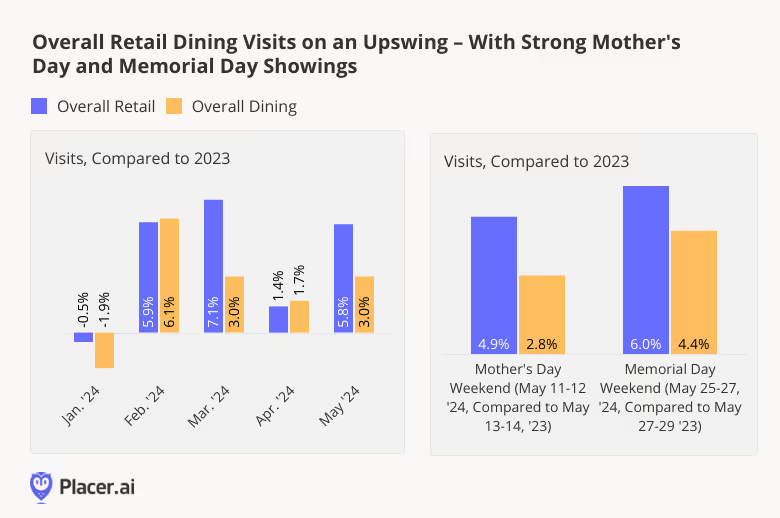
Overall Retail and Dining Traffic: YoY Increases
Last year was all about experiences. But in 2024, consumer demand is once again striking a balance between “fun and stuff.” Though both retail and dining foot traffic were weighed down by January 2024’s extreme temperatures, the two categories bounced back in February, going on to see consistently positive YoY foot traffic growth through May.
May 2024’s strong showing was likely driven in part by impressive visit boosts on two important calendar highlights: Mother’s Day weekend and Memorial Day weekend. On both of these occasions, retail and dining foot traffic outperformed 2023 levels, a further sign of consumer resilience this year.
Darlings of Dining: Fast Casual, QSR and Full Service Growth
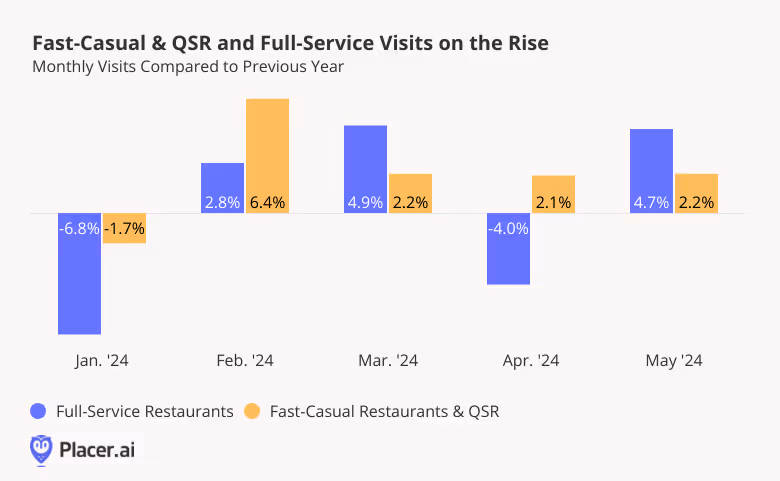
And drilling down deeper into data shows that some of this dining growth is being driven by full-service restaurants – another sign that the segment may be experiencing a comeback.
And location analytics points to a much more level playing field this year, with FSR YoY visit growth outperforming fast-casual & QSR in both March and in May. May’s visit boost in particular was likely aided by holiday visits – on both Mother’s Day and Memorial Day, full-service restaurants drew outsize crowds eager to enjoy nice meals out with friends and family.
Mapping Fast Casual & QSR and Full Service Trends
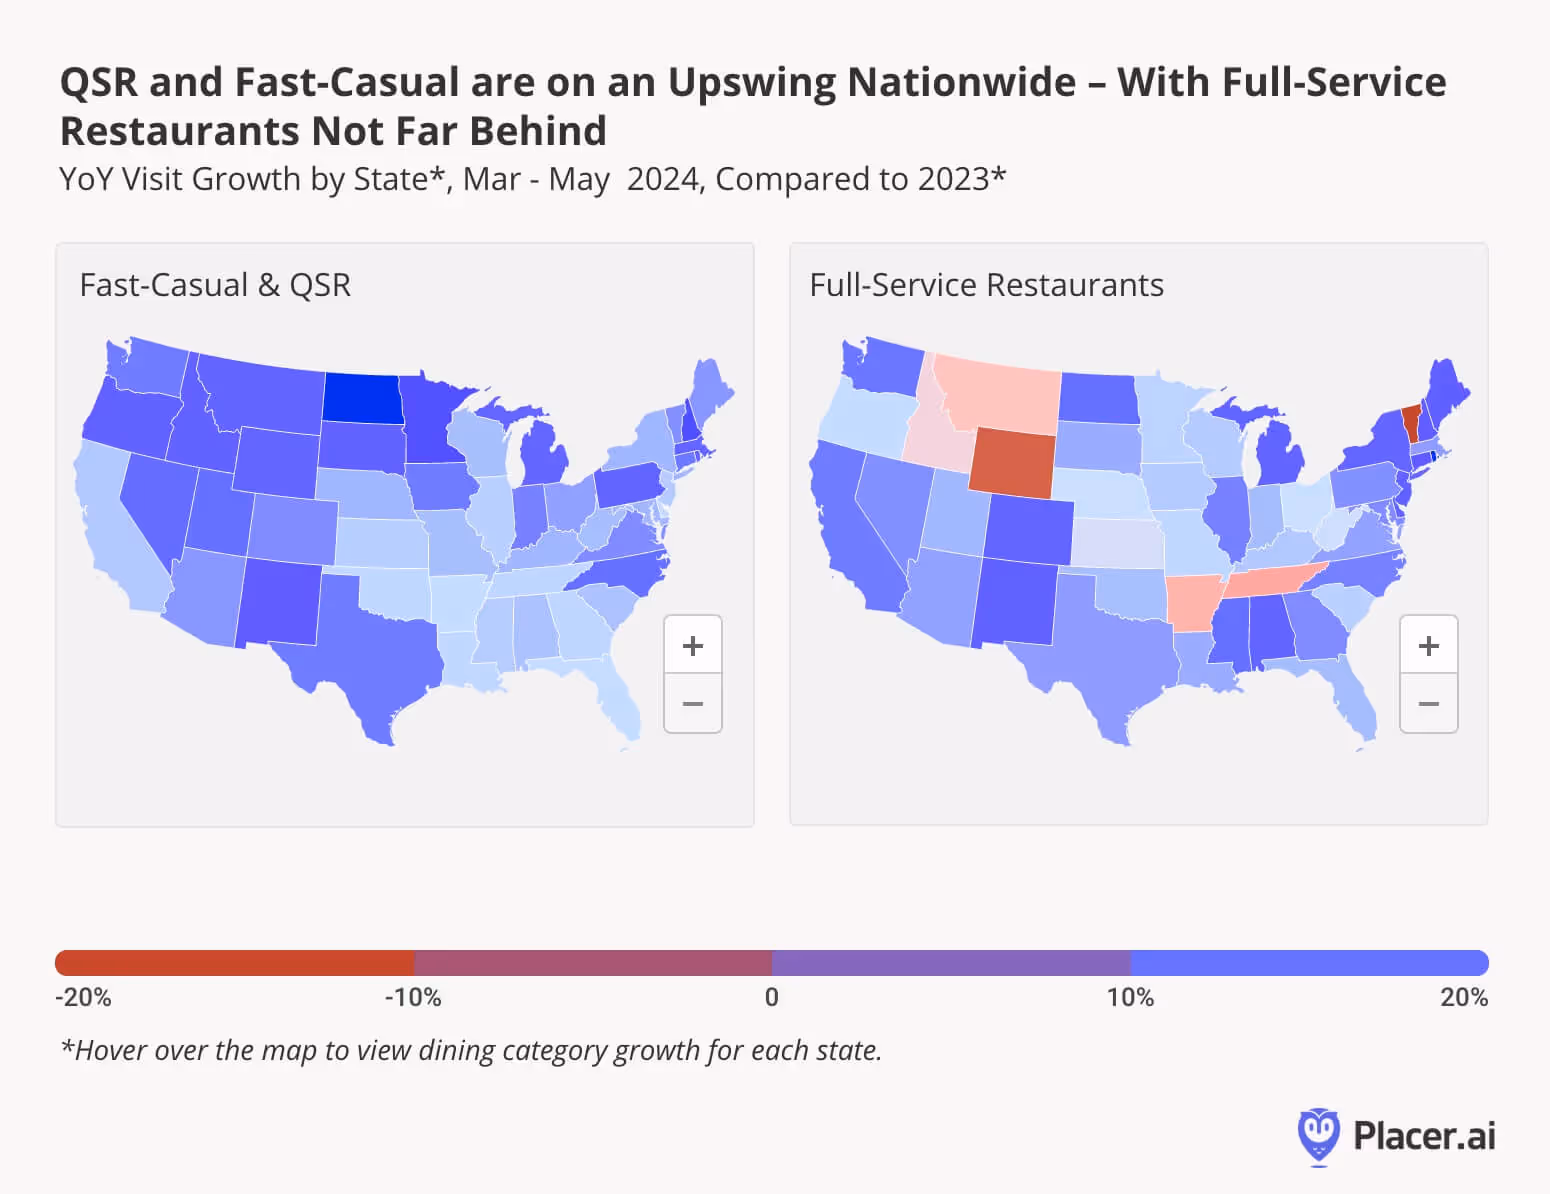
A look at statewide visit data for both fast-casual & QSR and for full-service chains during the past three months – comparing March to May 2024 to the equivalent period of last year – shows both segments doing remarkably well throughout most of the U.S.
In the fast-casual & QSR space, all 50 states enjoyed positive YoY visit growth over the past three months – led by North Dakota (6.8%), New Hampshire (5.3%), Minnesota (5.1%), New Mexico (4.3%), and Rhode Island (4.2%). And in FSR, 42 states enjoyed positive growth – with some of the same states, including Rhode Island, New Hampshire, and New Mexico, claiming top spots.
Looking Ahead
Will full service continue its turnaround in the second half of 2024 and can fast-casual & QSR maintain its strength? How will overall retail traffic fare during the summer months and critical back-to-school season?
Hilton Hotels & Resorts and InterContinental Hotels Group (IHG) introduced their midscale hotels - TRU and avid - several years ago. We take a closer look at the visitation trends to these affordable hotels and dive into the demographics to see who is staying at them.
Bracha Arnold
Jun 11, 2024
3 minutes
Hilton Hotels & Resorts and InterContinental Hotels Group (IHG) are two of the biggest names in lodging. The two companies operate a wide range of hotel brands, ranging from luxury chains to budget options. And falling in the middle of this range are two midscale hotel chains: TRU by Hilton and avid Hotels, operated by IHG.
What can foot traffic and demographic data reveal about the preferences of visitors to these chains? We took a closer look.
Visit Growth Year Over Year
TRU by Hilton and avid Hotels both opened their first locations in 2017, with the goal of offering travelers modern and comfortable accommodations while eschewing the amenities typically associated with more luxurious hotel categories. By streamlining services, these hotels can appeal to a diverse range of travelers while maintaining a lower price point.
The two hotel chains have expanded since their openings, with TRU operating 279 locations and avid operating 70 nationwide as of May 2024. And this expansion seems to be paying off for both brands, helping drive YoY monthly visit increases. Since June 2023, visits to the two chains have been consistently elevated YoY, save for a few minor visit lags at TRU.
Hilton and IHG both hope to continueexpanding their midscale hotel concepts, with projects in the pipeline for 2024 and beyond. And diving into the demographics can help the hotels identify their strengths and plan out marketing strategies more effectively.
Appealing Across The Board
Analyzing the psychographic makeup of TRU and avid’s trade areas by layering Spatial.ai’s PersonaLive dataset onto the two chains’ captured markets reveals that despite their budget offerings, both hotels appeal to economically diverse audiences.
Between June 2023 and May 2024, TRU and avid both attracted visitors from areas with higher-than-average shares of both “Ultra Wealthy Families” and “Blue Collar Suburbs.” The chains’ ability to appeal to both groups shows that their no-frills offerings are appreciated not just by the most price-conscious customers, but also by those with more room in their budgets to splurge.
Singles or Families?
Still, TRU drew a greater share of visitors over the analyzed period from areas over-indexed for “Ultra Wealthy Families'' – while avid drew slightly more customers from areas over-indexed for “Blue Collar Suburbs.” And diving deeper into the demographic and psychographic characteristics of TRU’s and avid’s captured markets shows that though both chains have broad appeal, there are some differences between their customer bases.
The median household income (HHI) of TRU’s captured market stood at $79.4K during the analyzed period – above the nationwide median – while that of avid remained slightly below it. And while avid’s captured market included a higher-than-average share of “Young Urban Singles” (also from Spatial.ai’s PersonaLive dataset), TRU was more likely to attract “Suburban Boomers.” So while TRU draws a wealthier and more settled clientele, avid tends to attract younger, less established guests.
These differences serve as a reminder of the differences that exist even within similar accommodation categories, and may help the two chains when deciding how to market to their respective customer bases.
Final Thoughts
Both TRU and avid seem similar enough on paper – two midscale hotel chains, geared towards a traveler that prioritizes value and convenience. And while both chains attract a wide range of households to their venues, TRU tends to see a more affluent, established visitor, while avid seems to attract more guests who are starting out in life.
For more data-driven travel & leisure insights, visit Placer.ai.
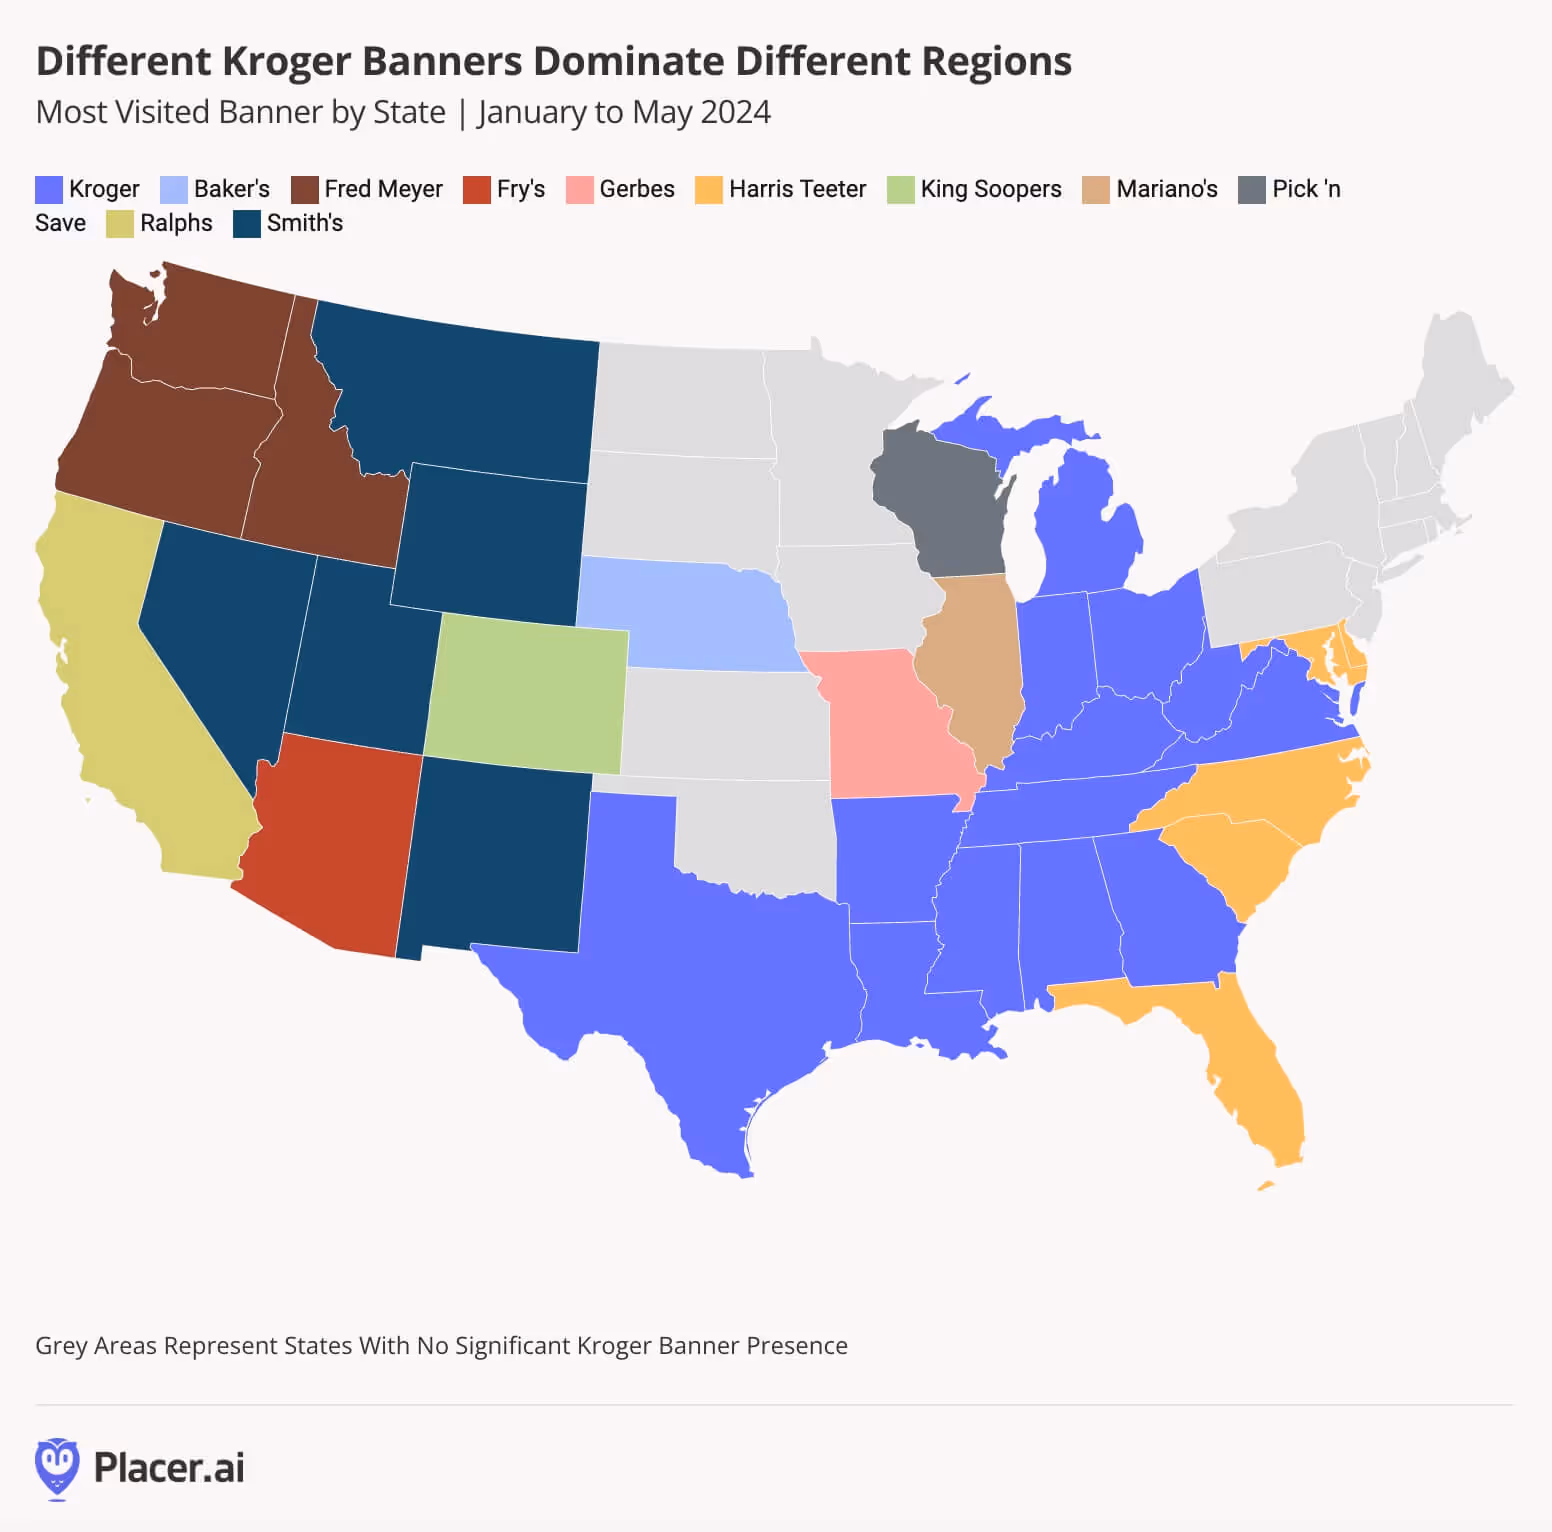
The Kroger Co, is a leading player in the grocery store space, operating its eponymous brand as well as a variety of regional banners. We dove into the data to see how key Kroger chains are faring in 2024 – and to explore the different audiences served by the company’s varied portfolio.
Samuel Roche
Jun 10, 2024
3 minutes
With sales exceeding $148 billion in 2023, The Kroger Co. is a leading player in the grocery store space. In addition to its flagship eponymous brand, the company owns a variety of regional banners, including (among others) Fred Meyer, Harris Teeter, Ralphs, Smith’s Food and Drug, Fry’s Food Stores, King Soopers, and Food 4 Less.
We dove into the data to see how key Kroger chains are faring in 2024 – and to explore the different audiences served by the company’s varied portfolio.
Setting the Stage: A Portfolio Breakdown
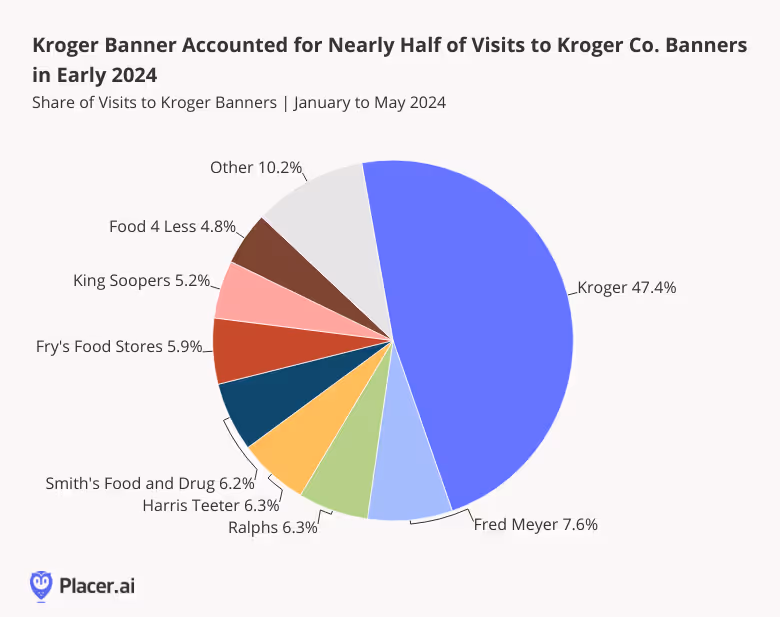
With some 1255 locations across 19 states, Kroger is The Kroger Co.’s largest grocery banner by far. And between January and May 2024, visits to the chain accounted for 47.6% of overall foot traffic to the company’s grocery portfolio. The remaining 52.4% of visits went to The Kroger Co.’s smaller banners – with Fred Meyer, Ralphs, and Harris Teeter leading the charge.
A Regional Deep Dive
And drilling down deeper into the regional distribution of the company’s various grocery banners shows that each chain serves a different area of the country.
Kroger’s eponymous banner holds sway throughout much of the Midwest and South – while Harris Teeter serves shoppers in Maryland, Florida, and the Carolinas. Meanwhile, Fred Meyer, Smith’s, Ralphs, Fry’s, and King Soopers dominate the Western United States. And throughout some parts of the Midwest, Kroger draws consumers with a variety of smaller banners.
Like that of Albertsons, Kroger Co.’s strategy of acquiring and maintaining regional brands has allowed the company to expand its footprint across the country – while catering to the needs and preferences of local shoppers. Indeed, Kroger’s footprint now extends across three of the four U.S. regions – the West, South, and Midwest – with only the Northeast lacking a Kroger Co. presence.
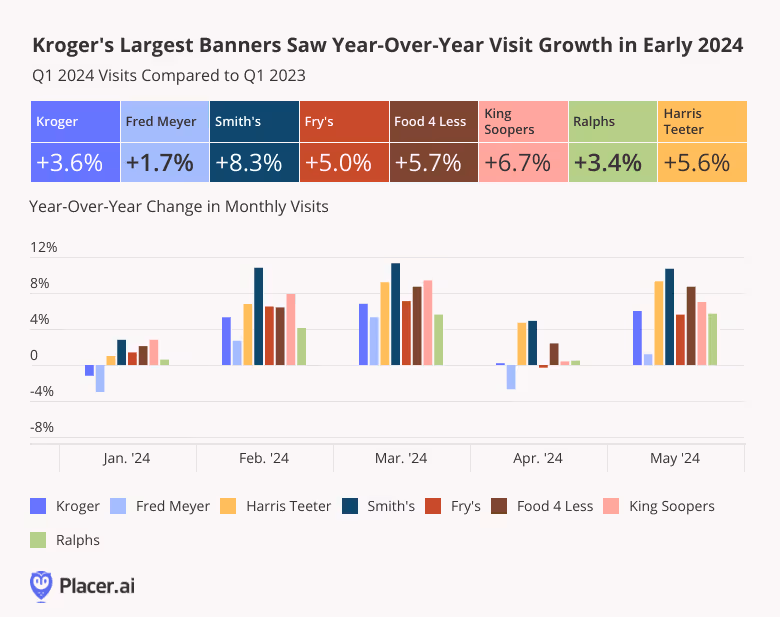
Visits on the Rise
A look at recent visitation trends for Kroger Co.’s largest banners – i.e. those with at least 100 locations – shows that all experienced positive YoY visit growth in Q1 2024. The most impressive foot traffic bumps were seen by Mountain region banners Smith’s and King Soopers, followed by value-oriented Food 4 Less, and the South Atlantic-focused Harris Teeter.
On a monthly basis, too, The Kroger Co.’s major Banners saw nearly uniform YoY visit growth between January and May 2024.
Reaching Different Audiences
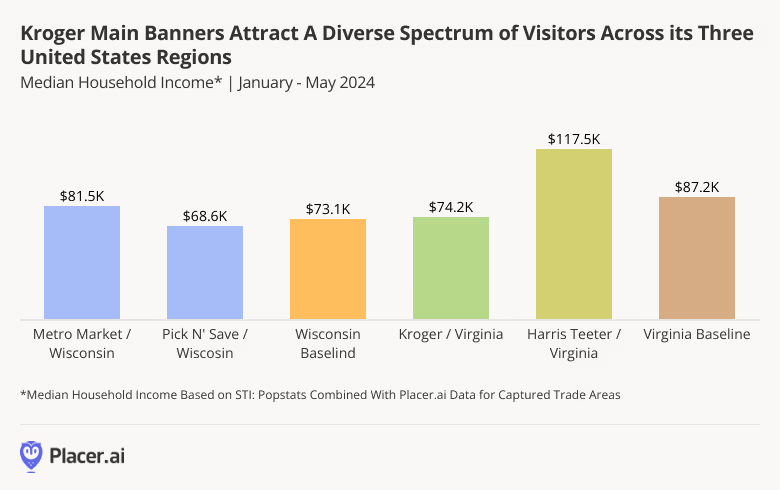
Analyzing demographic differences among the trade areas of Kroger’s different chains shows how the company leverages its portfolio of banners to serve distinct customer bases.
Virginia, for example, is served by two Kroger Co. banners – Kroger and Harris Teeter. And while the former draws shoppers from areas with a median HHI below the statewide baseline of $87.2K, the latter – with somewhat more upscale, pricier offerings – attracts a much more affluent audience. Similar differences can be observed in Wisconsin – where Pick ‘n Save and Metro Market serve different demographics.
By offering a diverse spectrum of shopping experiences, The Kroger Co. strategically positions itself to maximize market penetration and appeal to a broad range of consumers.
Looking Ahead
The Kroger Co. entered 2024 with a bang. With its extensive reach and adaptive approach, can the grocery leader maintain its positive momentum throughout the rest of the year?
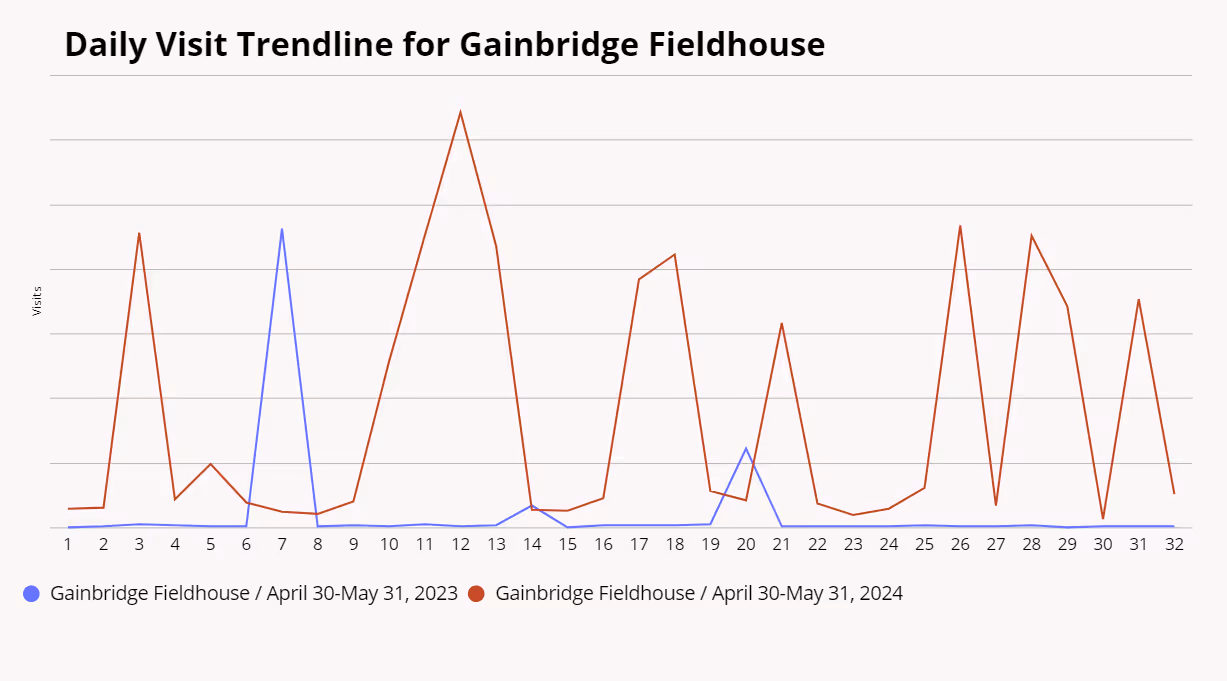
Post-March Madness, many of the NCAA women’s basketball players went on to the WNBA. Caitlin Clark to the Indiana Fever, Cameron Brink to the LA Sparks, and Angel Reese to the Chicago Sky were some of the most hotly anticipated draft picks. The newfound appetite for the WNBA is real. Take Gainbridge Fieldhouse in Indianapolis as an example. Just comparing the time period of April 30-May 31, 2023 vs April 30-May 31, 2024, there is a stark contrast in the number of attendees to home games. In just five games, attendance to this year’s Fever games has already surpassed that of the entire 2023 season.
The trade area draw is also something to note as the area from which 70% of visits originated practically doubled from May 2023 (blue) to May 2024 (red), showing the magnetic effect a star player can have.
This heightened interest is great news for concepts like The Sports Bra, a bar and restaurant based in Portland, Oregon. It’s 100% dedicated to women’s sports so you can be sure to catch your favorite female player on the screen. Since opening in the spring of 2022, it’s had steady business, and odds are with all the women’s sports to watch, there should be a busy summer ahead.
In addition, might the added exposure bring new fans to brands such as Wilson Sporting Goods, which signed Caitlin Clark? This familiar brand opened its first West Coast brick and mortar store on Santa Monica’s Third Street Promenade just about a year ago. Meanwhile, Angel Reese has signed on some big brands such as Reebok, Raising Cane’s and AirBnB. Former Stanford Cardinal and now LA Sparks superstar Cameron Brink is one of the faces of New Balance, and has starred in an ad with Shohei Otani and Coco Gauff.
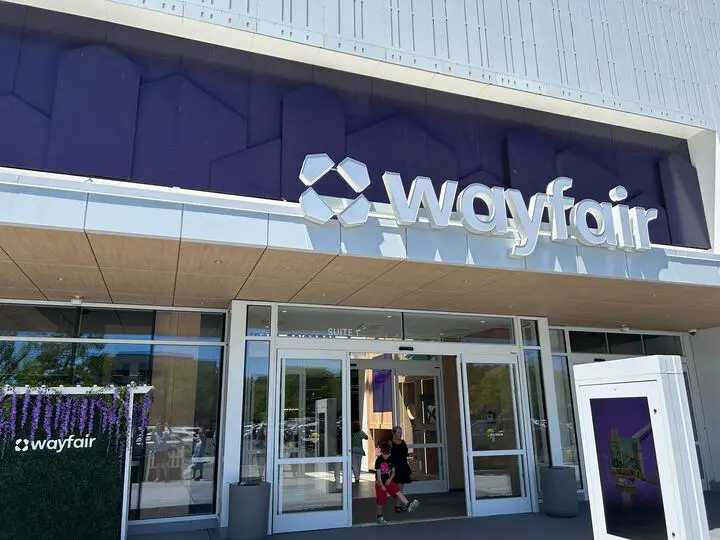
Over Memorial Day Weekend, Wayfair opened its highly anticipated addition to the world of physical retail, something we've been waiting for since the company's large-format store plan first came into view in early 2022. Technically, Wayfair’s new mega-store, sized at 150,000 square feet in Wilmette, Illinois, isn’t its first foray into brick-and-mortar, but it is certainly its splashiest. In an era when many home furnishing retailers are goingsmall, early indications from Placer show that betting big has yielded success in attracting visitors, but questions about the longevity of success and health of the broader home industry remain.
This week, we had a chance to visit the store ourselves, and it's immediately evident how much attention was put into the store. Most visitors enter through the "Market Square", which feature unique housewares, locally-relevant products, and seasonal merchandise. Above the Market Square is a large video board that showcases certain products and other digital media assets which help set the tone for the shopping experience.
Photo Credit: R.J. Hottovy
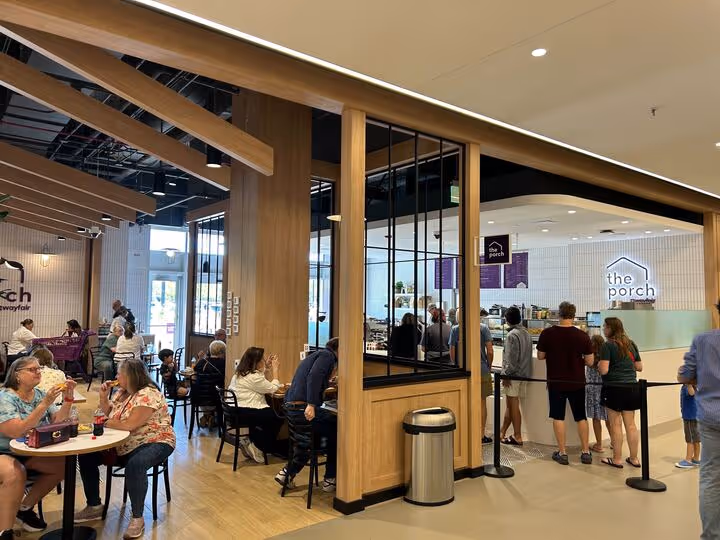
According to the retailer, its first namesake location brings a new shopping experience to consumers and features its first food service offering, The Porch (below).
Photo Credit: R.J. Hottovy
The store also features an expanded selection and one-on-one personal design services, which can be seen in store layout below. The new location clearly took learnings from other Wayfair-owned brands like Joss & Main or All Modern, each of which have also opened physical stores.
Source: Wayfair
The Wilmette large format store opened on May 23, just in time for Memorial Day Weekend foot traffic, and the location greatly benefitted from the timing. According to Placer’s early reads from May 18-June 1, 2024, Wayfair’s visits accounted for almost half of the visits to Edens Plaza (below), the shopping center in which it’s located. Beyond that, during its opening weekend from May 23-27, it drove 60% of visits to the plaza. The shopping center is located right off the Edens expressway, and the store is visible from the road, which helping to draw the attention of travelers.
Wayfair’s debut is a clear victory for the shopping center, with the store’s first few weeks helping to attract new visitors to the center. Comparing the two week period before the store opening to the two weeks of its opening using Spatial.ai’s PersonaLive segments, the percentage of visits coming from trade areas from Ultra Wealthy Families--the typical center visitors--actually decreased from 45% to 32%. However, there was a large increase in the percentage of visits by Educated Urbanites and Young Professionals. Buzzworthy openings help to revitalize shopping centers and Wayfair’s initial success will hopefully provide some meaningful shifts in visitors beyond the first few weeks.
Home furnishing retailers, in particular, have made experiences and expanded service offerings a cornerstone of their strategies to foster a captive consumer audience and increase dwell time, and hopefully conversion. Looking at local home furnishing experiential retail locations in the Metro Chicago area, Wayfair’s opening splash is even more apparent with its two story, expansive footprint. Compared to the closest IKEA store (Schaumburg), Wayfair Wilmette's visits were 12% higher during its initial two-week period and saw 19% more visits than IKEA during the highest traffic day of opening weekend. The trade area of the two retailers, even in the first two weeks, starts to tell the story of the visiting consumer; Wayfair drove more visits despite having a smaller trade area than IKEA and more overlapping territory, and primarily pulled its visitors from the northern Chicago suburbs.
Wayfair’s early indicators of traffic highlight a combination of the right concept, the right consumer, and the right location. It will be fascinating to watch the long-term visit trends for Wayfair, especially compared to other large-scale regional furniture retailers. Despite many home furnishing retailers looking to smaller formats for growth, if Wayfair’s location sustains its traffic growth, larger-format stores may become an attractive solution for shopping centers to revitalize themselves.
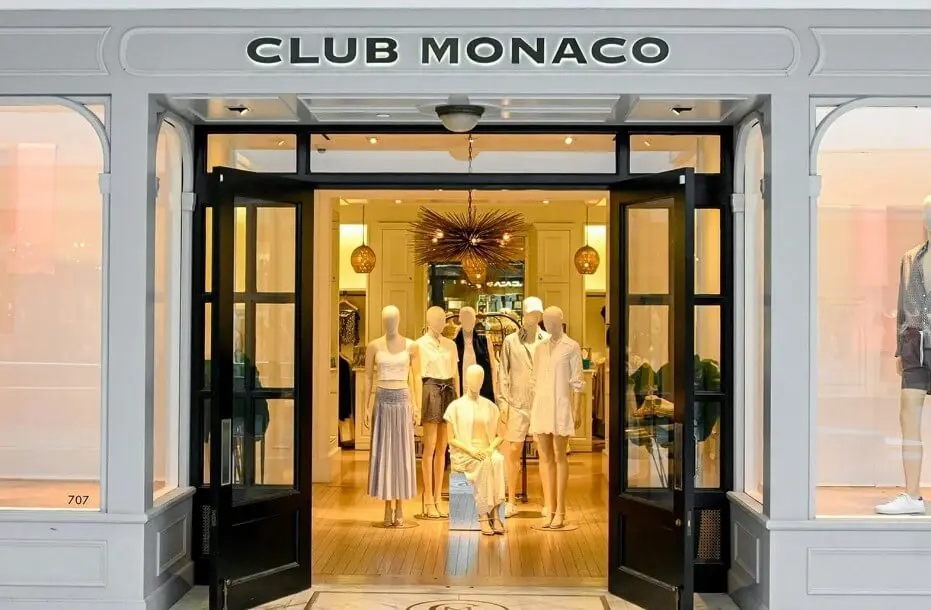
Mixing high-low fashion means pairing expensive designer items with more budget-friendly ones, think H&M jeans with a tweed Chanel jacket. This concept has been around for a while, and though one may originally have had to frequent different stores to attain this, with the way investment firms are snapping up different brands, shopping “High-Low” may become a more commonplace occurrence. Regent acquired Escada in 2019 and Club Monaco in 2021. While one might not normally think of those brands in the same sentence, if you’re walking on Beverly Drive and enticed by the Club Monaco outfits, walk in a bit deeper and before you know it, you will be encountering designer pantsuits and evening gowns by Escada.
Photo Credit: Caroline Wu
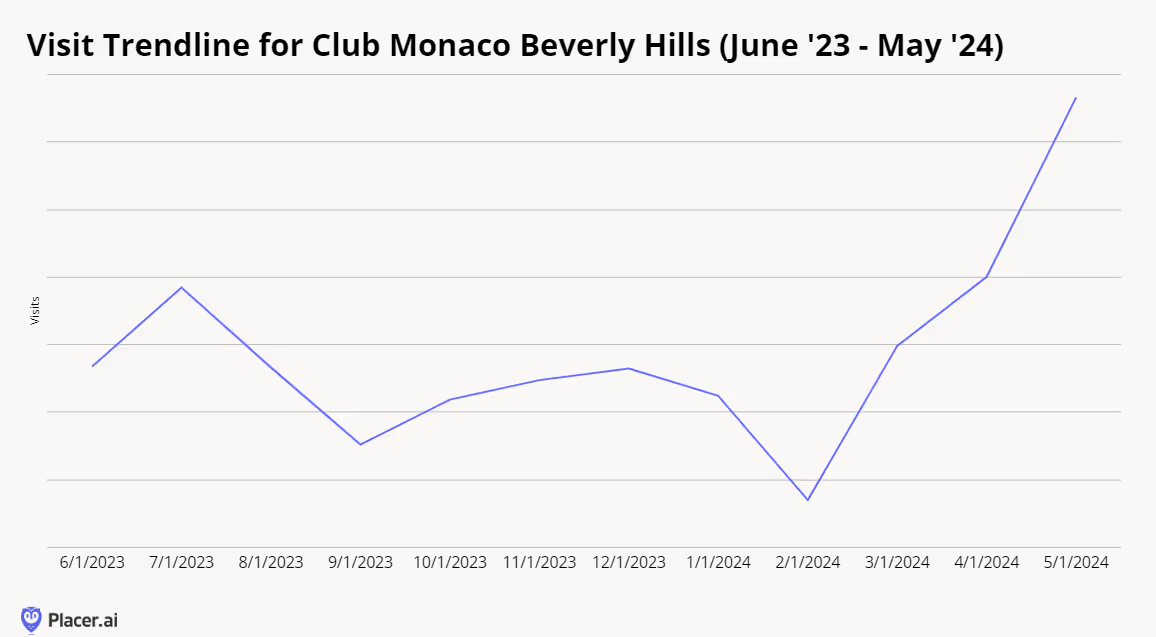
Since the space is all one, it’s hard to decipher who’s going in for Club Monaco versus for Escada. Technically, Escada has its own entrance on Brighton Way. Either way, overall traffic for this space is up in the last few months, so perhaps this is simply the evolution of real estate as owners become creative with how they use their spaces and the brands within. As for us shoppers, we love to be surprised and delighted, so for sure finding an unexpected brand as you meander around is always welcome.
How shifting consumer priorities are reshaping value perceptions across QSR, fast casual, and casual chains.
July 9, 2026
The New Definition of Value
As consumer sentiment hovers near historic lows and the cost of goods remains elevated, value has become a defining theme across the dining industry. Yet within the sector's diverse restaurant categories – and for individual brands – the question is no longer whether consumers are seeking value, but what value actually means. A closer look at chains across the industry suggests that, amid ongoing economic pressure, perceptions of value are evolving. For some consumers, value may be tied to affordability and promotions; for others, it may come from quality, convenience, or experience. The result is a market with multiple paths to winning consumer traffic.
Dining Traffic Remains Unstable in 2026
After an uneven but largely resilient 2025, dining traffic in 2026 tipped into a sustained decline.
Monthly visits to the overall dining industry have trailed year-ago levels throughout 2026, with February standing as the lone exception. That month saw a 3.7% year-over-year (YoY) increase in visits, driven in part by comparisons to the period of initial tariff announcements in early 2025. But broader trends remained challenged, and May's 2.5% YoY decline marked the steepest monthly drop of the past twelve months as rising gas prices and weakening consumer sentiment appear to have added pressure to an industry already navigating a difficult environment.
Breaking Down the Industry
These headwinds, though, have not landed evenly. Across the dining sector, some segments have faced more intense pressure than others, with much of the divide coming down to how consumers are perceiving value against experience.
QSR’s Value Proposition Under Pressure From Grocery Stores & Superstores
Over the past several years, inflation and rising menu prices have gradually weakened a cost-based value proposition that has long been central to the QSR segment. More recently, elevated gas prices have added another deterrent, making a trip through the drive-thru a less compelling choice for some consumers.
Strong performance at grocery stores and superstores suggests that competition for share-of-stomach is increasingly extending beyond traditional restaurant rivals. With expanding selections of ready-to-eat and pre-prepared meals, these channels are offering consumers a combination of value, convenience, and quality that can increasingly match limited-service dining options. At the same time, ongoing pressure on household budgets appears to be driving more consumers toward lower-cost meals made at home, creating additional headwinds for the QSR segment.
Fine Dining and the Fast Casual Middle Hold Firm
Yet for many consumers, there is still a time and place for dining out, and in the face of mounting economic pressure, several dining formats have found foot traffic success. Fine dining has posted traffic growth in nearly every month of 2026, with March standing as the lone exception. That decline was likely influenced by a calendar shift, as March 2026 contained one fewer Saturday than March 2025 – a meaningful headwind for full-service restaurants given the outsized role weekends play in driving visits. The segment's sustained growth points to the resilience of higher-income consumers and the enduring appeal of premium, occasion-driven dining experiences.
Fast casual and casual dining have also proven relatively resilient. The fast casual category saw positive YoY foot traffic in every month of 2026 so far, while casual dining's performance has rebounded since the March calendar shift that likely weighed on YoY traffic. A second calendar shift in May 2026 led to an extra Saturday in the month, which likely helped the segment's overall trend. These trends suggest that both fast casual and casual dining occupy an increasingly attractive middle ground where value is defined as a combination of affordability and experience. At the same time, years of menu price hikes at QSR chains have altered the cost equation in fast casual and casual dining's favor, narrowing the price gap between fast food and more elevated dining formats. As that gap has narrowed, consumers may be placing greater emphasis on experience and quality when deciding where to dine.
Inside the Playbooks of Fast Casual Standouts
The balance between price and elevated experience has made fast casual a favorite for value in the dining industry in 2026. A closer look at two of the segment's largest players, CAVA, a relatively young concept, and Chipotle, a legacy chain navigating operational challenges, shows how brands can deliver on that value proposition in different ways and win in today’s dining landscape.
Chipotle Creates Value With LTO Experiences and Loyalty Perks
Chipotle's traffic trends in 2026 have improved compared to 2025, with the brand offering a clear example of how fast casual brands can create value by pairing menu innovation with loyalty perks.
Chipotle outpaced the broader fast casual category in YoY visits nearly every week of 2026 so far. And the graph below shows that the chain's strongest traffic gains tended to coincide with major menu launches and loyalty initiatives – a key component of its ongoing "Recipe for Growth" strategy.
The return of fan-favorite Chicken al Pastor in the week of February 9, 2026 helped drive a 16.6% YoY increase in visits. Two months later, the launch of "Rewards on Repeat" – a refreshed loyalty program offering freebies upon sign-up – generated the period's largest weekly traffic gain, with visits rising 18.2% YoY. And the introduction of Honey Chicken on April 28 provided another boost, as the chain continued to rotate limited-time protein offerings and give customers reasons to return.
These performance peaks suggest that Chipotle has been particularly effective at pairing menu novelty with loyalty perks to reinforce a value proposition anchored by quality and experience.
Chipotle's "Recipe for Growth" Drives Traffic With Loyalty and LTO Launches
Year-over-Year Change in Weekly Visits, Chipotle vs. Fast Casual, Jan.–Jun. 2026
ChipotleFast Casual
Dashed lines mark key Chipotle promotional launch dates. Week-of dates shown; launches may have occurred mid-week.
Share
Embed:
CAVA Expansion and Differentiated Dining Experience
If Chipotle illustrates the power of menu innovation and loyalty-driven engagement, CAVA highlights a different approach to creating value – one rooted in variety, customization, and a consistently differentiated dining experience.
CAVA's overall visits climbed well above 20% YoY in every month of 2026, a pace largely driven by aggressive unit expansion. Meanwhile, same-store visits, which measure traffic at locations open for at least twelve months, sustained positive YoY growth – evidence of genuine demand at existing restaurants alongside a rapidly growing footprint.
While Chipotle leans on limited-time offers, CAVA's growth rests on a consistent, customizable experience. A deep roster of proteins paired with a wide range of bases, dips, and toppings, gives the chain built-in variety that helps keep the concept feeling fresh. In addition, CAVA's Mediterranean-inspired menu offers flavors and combinations that are less easily replicated at home, helping the brand maintain a differentiated experiential value proposition and drive growth.
O Though Chipotle and CAVA are at different points in their evolution and have taken different paths to growth, both highlight the enduring appeal of fast casual's balance of value and quality. In a dining environment where consumers are increasingly weighing cost against experience, the segment's ability to deliver on both has helped make it one of the industry's strongest-performing formats.
Casual Chains Thrive On Everyday Value
Fast casual isn't the only dining segment benefiting from consumers' evolving perception of value. In 2026, several casual dining chains have found success by pairing accessible price points with the elevated experience of a sit-down meal.
Brands such as BJ's Restaurant & Brewhouse, Chili's Grill & Bar, Bonefish Grill, Cicis, and The Cheesecake Factory all posted positive YoY visit growth in multiple months this year, demonstrating that even in a challenging economic environment, diners are motivated when they feel they are getting more in return. These results are particularly notable given the impact of calendar shifts, which weighed on March 2026 comparisons – and provided a tailwind to May performance.
Unlike many fast casual chains, these brands have not relied heavily on a steady stream of limited-time offers to drive traffic. While menu innovation remains part of the playbook, promotions often serve as ticket builders or engagement tools rather than primary traffic catalysts. Instead, these successful casual dining chains have focused on creating everyday value that diners can depend on, narrowing the price gap between limited-service restaurants and full-service dining.
The result is a value equation that encompasses table service, a more relaxed dining environment, and a place to socialize or celebrate an occasion. In an environment where consumers are increasingly weighing cost against overall experience, that combination appears to be helping several casual dining chains maintain positive traffic momentum.
The State of Dining in 2026
Although dining traffic has softened in 2026, the industry's performance suggests that consumers have not stopped spending on restaurants altogether. Instead, they have become more selective about where they dine and what they expect in return.
Across segments, the strongest performers have found different ways to deliver value. For some brands, that means menu innovation, loyalty engagement, and differentiated experiences. For others, it means dependable affordability paired with the service and atmosphere of a sit-down meal. As economic pressures continue to shape consumer behavior, the data suggests that value is no longer defined by price alone, but by the balance of cost, convenience, quality, and experience.
Find out where Americans are moving in 2026, why they're relocating, and how developers, investors, and retailers can stay ahead of the trends.
June 18, 2026
The Geography of Domestic Migration
During the pandemic and its aftermath, Americans were on the move. Millions left expensive coastal markets for lower-cost destinations across the Sun Belt, while boomtowns such as Bozeman, Boise, and Austin struggled to keep pace with the influx of new residents.
That wave of relocation has since cooled, as return-to-office mandates, higher mortgage rates, and a shrinking affordability gap between coastal cities and many COVID-era hotspots have dampened the incentive to move. But even in a slower market, domestic migration remains one of the most powerful forces shaping local economies, housing markets, and consumer demand.
This report leverages AI-powered location analytics to examine the relocation patterns reshaping the United States in 2026 – where Americans are moving, the demographic and economic forces driving those decisions, and how retailers, investors, developers, and policymakers can respond to the opportunities and challenges created by these shifts.
Which major metros are attracting the most new residents? Which pandemic-era standouts have seen growth stall or reverse? And what factors best predict a large metro area's domestic migration growth potential in 2026?
Interstate Flows: Which States Gained and Lost Residents?
South Carolina and Delaware Set the Pace
The latest statewide migration data shows that the slower relocation pace observed in 2024 persisted into 2025. No state recorded net inflows or outflows exceeding 0.7% of its starting population. And while several smaller states continued to attract new residents at meaningful rates, none of the nation's six most populous states saw net in-migration exceed 0.2%.
Among those smaller states, South Carolina and Delaware led the nation with net in-migration equal to 0.7% of their populations, followed by Idaho (0.6%), Maine (0.5%), Tennessee (0.4%), and North Carolina (0.3%). For most of these states, migration accelerated relative to 2024, though Delaware's inflow rate moderated slightly and North Carolina held steady.
Despite their differences, these states tend to offer a similar mix of lifestyle amenities, relatively low congestion, and opportunities for growth. Many also benefit from business-friendly climates, favorable taxpolicies, or housing costs that remain attractive relative to the higher-cost markets from which they draw new residents.
Vermont Trails Behind
At the other end of the spectrum was Vermont, which saw the nation’s largest net outflow as share of population in 2025, losing 0.4% of its population to domestic relocation. The decline deepens a reversal that first emerged in 2024, when the state swung to a net loss of 0.2%, after attracting inflows of 0.8% and 0.5% in 2022 and 2023, respectively.
Vermont's reversal likely reflects a combination of factors, including return-to-office mandates and the waning appeal of remote work. Housing undersupply in the state may have alsocontributed, illustrating how important infrastructure investments are to sustaining migration gains over time.
South Carolina, Delaware, and Idaho Lead the Nation in Domestic Migration Growth in 2025
Net Domestic Migration as a Share of Each State's Starting Population, 2025
Net Migration by State
−0.4%0.0%0.7%
Top Migration Magnets
2024
2025
*Analysis for each year is from Jan. – Dec.
Share
Embed:
Florida Sees Accelerated Inflow as Legacy Exodus States Slow Losses
Among the nation's six most populous states, Florida was the only one to see accelerating net in-migration in 2025, attracting new residents equal to 0.2% of its starting population, up from 0.1% the year before. Texas, by contrast, slowed from 0.1% net in-migration in 2024 to essentially flat in 2025, highlighting the cooling of what was once one of the country's strongest pandemic-era migration magnets.
Meanwhile, the legacy "exodus" states continue to lose residents, but at a slower pace than in previous years. Illinois and California have seen their migration deficits steadily narrow, with further improvement in 2025. Between 2022 and 2025, Illinois moved from -0.8% → -0.2% → -0.2% → -0.1%, while California moved from -0.9% → -0.4% → -0.3% → -0.2%. And though New York has held steady at -0.2% over the past two years, this marks a significant moderation from 2022, when the state experienced net outmigration equal to 1.1% of its population.
Major Insights:
Smaller states dominated migration gains in 2025, led by South Carolina, Delaware, Idaho, Maine, Tennessee, and North Carolina.
Vermont posted the nation's largest outflow after attracting strong inflows just a few years earlier.
Florida was the only top-population state to see meaningful net in-migration in 2025.
Texas' migration boom continued to cool, with net in-migration falling to flat in 2025.
Outmigration from New York, Illinois, and California is slowing, but these states are still losing residents overall.
Zooming In: Net Migration Across Metro Boundaries
Statewide trends reveal important shifts, but a closer look at the nation's ten largest metropolitan areas suggests that broader interstate averages increasingly mask diverging local realities. Several metros are attracting residents through interstate domestic migration even when their states as a whole are experiencing little or no net migration growth.
Phoenix (+0.3%), for example, stood out as the nation's top-performing large metro in 2025, despite Arizona's absence from the list of leading migration destinations – with the majority of its inflow coming from out of state.
Dallas (+0.2%) ranked second, continuing its rebound from -0.1% in 2023 even as Texas' statewide migration gains cooled. Like Phoenix, Dallas drew a majority of its new residents from outside the state, underscoring its growing appeal as a national migration destination. Houston, meanwhile, moved in the opposite direction, falling from 0.1% net in-migration in 2023 to -0.1% in 2025. While it is too early to call this a sustained reversal, the divergence between the two metros may reflect Dallas's growing pull as a corporate magnet alongside rising housing costs and weather-related challenges in Houston.
Metro-level data also suggests that the pandemic-era "big-city exodus" narrative is continuing to fade. Los Angeles improved from -0.8% in 2023 to -0.3% in 2025, while New York held steady at -0.3% after improving in 2024. Even Miami (-0.6%), which ranked last among major metros despite Florida's continued statewide gains, saw its outflows moderate from 2023 levels. And while Illinois continued to post net outmigration, Chicago (0.0%) reached migration neutrality in 2025 after recording losses in both 2023 and 2024.
Major Insights:
Phoenix was the nation's top large-metro migration destination in 2025.
Dallas gained momentum while Houston lost ground, highlighting growing divergence within Texas.
Miami continued to post the largest outflows among major metros despite Florida's broader migration success.
The LosAngeles, Chicago, and the New York metro areas all saw migration losses ease.
Florida Dominates Large Metros
Despite Miami's struggles – and Florida’s relatively modest 0.2% inflow – a look beyond the top 10 large metros reveals that the Sunshine State is home to six of the nation's eight fastest-growing large metros nationwide.
Those top-performing metros, defined as CBSAs with 500K+ residents that added at least 0.8% of their population through net domestic migration over the past year, share a similar profile: lower housing costs, retiree appeal, suburban density, and an easy drive to a larger economic hub.
Much of the growth of these Florida metro areas, however, is being fueled from within Florida itself. While major out-of-state metros such as New York (6.1%) and Chicago (2.0%) remained important sources of new residents, nearly half of the net migration into Florida's top destination metros came from elsewhere in the state. In 2025, Miami (22.5%), Orlando (13.0%), Tampa (5.8%), and Naples (4.2%) together accounted for 45.5% of the net positive migration feeding these fast-growing markets.
Major Insights:
Mid-sized Florida metros dominate the national migration leaderboard.
Florida's migration pipeline is overwhelmingly driven by in-state movement.
The Affordability Factor
The migration flows feeding the nation’s fastest-growing large metros suggest that affordability remains a powerful driver of domestic relocation.
In 2025, seven of the eight top destination metros analyzed above had lower typical home values than their largest feeder markets. Lakeland–Winter Haven, FL, for example, had a typical home value of $313.4K in December 2024, compared with $404.9K in Orlando and $380.2K in Tampa – its two largest sources of net migration. Even North Port–Bradenton–Sarasota, FL – the most expensive Florida metro in this group – drew its largest share of net migration from the New York metro area, where home values are substantially higher.
The lone exception was Charleston–North Charleston, SC, whose largest source of net migration was Baltimore – a market with lower typical home values than the destination. Even in Charleston, however, affordability appears to have played a role. New York, a significantly more expensive market, ranked a close second in 2025, accounting for 6.5% of net positive migration into Charleston, just behind Baltimore’s 6.8%.
While housing costs are only one factor influencing migration decisions, the data suggests that households continue to gravitate toward markets where homeownership is comparatively more attainable than in the places they leave behind.
Most Top Migration Destinations Pull Residents From More Expensive Housing Markets
Typical Home Values* in Top Feeder Markets to Destination Hubs, 2025
Destination HubTop Feeder Market
*Typical home value based on Zillow Research’s Zillow Home Value Index (ZHVI) for Dec. 2024, immediately preceding the analyzed migration period (Jan.–Dec. 2025).
Share
Embed:
Major Insights:
Most high-growth metros attract residents from more expensive housing markets.
Relative affordability continues to be a primary driver of domestic migration.
Demographics Over Dollars
But as important as affordability is in explaining today’s domestic migration patterns, age appears to be an even stronger determinant of where people choose to relocate.
Among mid-sized and large metros (250K+ residents) experiencing significant population shifts – defined as gaining or losing at least 1.0% of their starting population through domestic migration over the past two years – households are increasingly moving toward older, more established communities.
The data reveals a clear negative relationship between migration performance and age differential – a metric calculated by subtracting the median age of the destination market from the weighted median age of its feeder markets. Negative values indicate movement toward older communities, while positive values indicate movement toward younger ones. In other words, the metros attracting the strongest migration inflows tend to be older than the markets sending them residents.
The data also shows a clear positive relationship between migration performance and retiree concentration. Metros with larger shares of residents aged 65 and older generally saw stronger migration gains over the past two years, while younger metros tended to attract fewer newcomers. This suggests that retiree-driven relocation has become an increasingly important driver of migration. At the same time, the influx of younger residents points to the broader appeal of these communities, which offer a mix of affordability, amenities, and lifestyle advantages.
Relocators are Gravitating Towards Older, More Established Communities – With Retirees Helping Fuel the Trend
Net Migration as Share of Starting Population, 2024–2025*
Net Migration vs. Weighted Age Differential
Net Migration vs. Share of Residents 65+
*Analysis includes metro areas with 250K+ residents and domestic migration gains or losses of at least 1.0% during the study period. Weighted Age Differential compares the destination market’s median age with the weighted median age of origin markets, with positive values indicating migration toward younger markets and negative values indicating migration toward older markets. Age data: Census ACS 2020–2024.
Share
Embed:
Major Insights:
People are moving to older, more established communities.
Markets with larger 65+ populations are attracting more domestic relocators.
The New Migration Map: Strategic Implications
The pandemic-era urban exodus is giving way to a more nuanced migration landscape. Large urban markets are stabilizing, while growth is increasingly concentrated in smaller states, secondary metros, and intra-state corridors. Affordability remains a powerful pull, but retirees, lifestyle considerations, and local market dynamics are also playing an increasingly important role in where Americans choose to live.
To capitalize on these shifts in 2026, civic leaders, commercial real estate (CRE) investors, retailers, and developers should:
Monitor smaller states gaining migration momentum. Among the nation's most populous states, only Florida saw (modest) net in-migration in 2025. By contrast, smaller states like South Carolina, Delaware, Idaho, Maine, Tennessee, and North Carolina continued to attract substantial inflow. Investors, retailers, and developers that monitor these patterns may be better positioned to identify emerging growth opportunities.
Invest ahead of growth. Vermont's reversal shows how important it is for housing supply and infrastructure to keep pace with demand. High-growth communities will also need the retail, healthcare, transportation, and service capacity required to support expanding populations.
Look beyond state-level narratives that can obscure local opportunities. Florida led the nation in fast-growing large metros even as Miami lost residents, while Texas saw Dallas gain momentum as Houston fell behind. Likewise, although Arizona was not a top destination state, Phoenix remained the nation's leading major metro for migration gains.
Treat states as migration ecosystems. In Florida, for example, domestic migration is increasingly redistributed across a network of interconnected metros – as costs rise in one market, residents shift to nearby alternatives. Tracking these spillover effects can help identify tomorrow's growth markets before they show up in the rankings.
Don't write off major urban markets. While New York, Los Angeles, and Miami continue to experience net outflows – and Chicago has yet to return to positive territory – migration losses have moderated substantially from their pandemic-era peaks. As these markets stabilize, investments in livability, affordability, and quality of life could help strengthen their long-term competitiveness and economic vitality.
Protect affordability as a competitive advantage. Across the nation's fastest-growing metros, migration flows continue to move from more expensive housing markets to less expensive ones. As demand rises, preserving attainable housing will be critical to maintaining the cost advantages that attract new residents and businesses.
Prepare for a retiree-driven demographic realignment. Older Americans are playing an outsized role in shaping domestic migration patterns, but the communities attracting them are increasingly appealing to a broader range of households as well. As these markets grow, demand is likely to increase for healthcare, recreation, hospitality, and housing, creating opportunities across a wide range of sectors.
Explore key signals guiding data-driven site selection from brands actively expanding their brick-and-mortar footprints.
May 21, 2026
Predicting The Next Best Location
Across segments, retail and dining expansions converge on a common set of priorities, including identifying markets with strong demand, ensuring alignment with target audiences, and leveraging local consumer behavior to drive synergy. Using AI-powered location intelligence, we analyzed five expanding brands and segments to uncover the core principles driving successful site selection.
1. Identifying Sustainable Growth in an Increasingly Saturated Market
Nationwide visits to coffee chains are up in 2026, with established brands and newcomers alike seeing their traffic increase as consumer headwinds lead some to shift their discretionary spend towards more affordable indulgences. But past visit growth does not necessarily indicate future opportunity – it may instead signal market saturation. Relying solely on overall visit trends to guide expansion could lead chains into highly competitive markets where existing supply already meets demand.
For example, analyzing traffic trends in 10 major metro areas where coffee visits increased year-over-year (YoY) in Q1 2026 reveals significant gaps between overall traffic trends and per-location demand. In some CBSAs, overall traffic growth significantly outpaced per-location traffic trends – suggesting that supply is already meeting (or exceeding) demand and limiting room for new coffee locations despite overall category growth. But in other metro areas, where overall visit growth appears smaller, per-location traffic is actually booming – indicating that the underlying demand is resilient enough to support additional coffee concepts.
These patterns highlight the importance of looking beyond topline growth to identify where true whitespace still exists.
Strategic Takeaways:
Relying solely on aggregate category performance can obscure regional white space. A market-level view may reveal opportunities for stronger returns in areas where consumer demand is gaining momentum.
Combining overall visit and visits per location data offers a more complete view of where demand is both strong and sustainable.
2. Ensuring Demographic Alignment on the Hyperlocal Level
Effective site selection matches both regional and local demographics to a brand’s target customer, supporting performance and reinforcing positioning. But even in well-aligned metros, results depend on site-level precision – locations where the trade area visitor profile most closely reflects the brand’s core audience are best positioned to drive incremental upside.
An analysis of Alo locations in the DC area suggests that the company is adopting this strategy. Within the already high-income metro area of Washington-Arlington-Alexandria, individual Alo Yoga stores are placed in centers that draw even more affluent visitors – maximizing the revenue potential of each location.
In fact, Alo's newest stores in the metro area – One Loudoun and Bethesda Row – drive traffic from households with higher median incomes than even the established area locations. This signals a clear focus on premium retail corridors and affluent consumer segments, which reinforces the brand’s positioning while capturing higher-spending customers at the site level.
Strategic Takeaways:
Beyond traffic potential, effective site selection requires a clear understanding of both regional and hyperlocal demographics, as well as the brand’s target audience.
As brands expand, aligning locations with core customer bases can drive success while reinforcing brand positioning.
3. Finding Retail Nodes With Complementary Visitation Patterns
Beyond driving traffic potential and demographic alignment, site selection should also ensure that a brand’s identity and operating model are well matched to the visitation patterns of prospective locations. Barnes & Noble offers a clear example. The company’s ongoing resurgence has relied in part on repositioning itself as a local cultural and social hub, with a stronger emphasis on local curation and community-driven events.
And analyzing Barnes & Noble’s 2026 openings shows a clear tilt toward centers with a higher share of local traffic than the chain average – supporting its shift away from a purely transactional retail model toward a more community-centric experience built around local curation, events, and repeat visitation. By prioritizing locally driven centers, the company’s site selection strategy not only captures relevant traffic but also reinforces its broader repositioning as a neighborhood-oriented brand.
Strategic Takeaways:
Site selection strategy should look to align a brand’s identity and operating model with real-world visitation patterns at prospective locations.
For brands leaning into local curation, choosing centers with predominantly nearby visitors may be the key to performance and preserving brand identity.
4. Understanding the Benefits of Competitor Proximity
Effective site selection recognizes that proximity to competitors can function as a demand driver, amplifying traffic rather than diluting it.
In practice, this often takes the form of clustering – deliberately locating near similar or complementary concepts to capture shared demand. Shake Shack provides a clear example. Analyzing the chain's store fleet shows that many locations sit near other QSR and fast-casual concepts, creating opportunities to capture dining-based traffic. At the same time, strong cross-visitation patterns indicate that these co-located brands share a common customer base, positioning the brand closer to consumers who are already likely to visit. And, at least for Shake Shack, this strategy appears to be working – traffic to the chain increased 19.9% YoY in Q1 2026.
Strategic Takeaways:
As in retail, co-tenancy in the restaurant space can be mutually beneficial – establishing a center as a dining destination, driving incremental traffic, and increasing a brand’s opportunities to win share-of-stomach.
Incorporating cross-visitation analysis into site selection helps pinpoint locations where target customers are already visiting nearby brands. Centers that already attract a brand’s overlapping customer base provide a stronger foundation for incremental growth.
5. Balancing Growth and Cannibalization Risk
Incorporating trade area analysis into site selection can also help determine whether a new location will generate new traffic or risk cannibalizing existing demand. Aldi, a rapidly expanding grocery chain, offers a relevant example.
The company opened a fourth Las Vegas store on S Decatur Blvd in October 2025, positioned between existing locations on W Craig Rd and S Rainbow Blvd, approximately eight miles from each. And analyzing the core trade area of each of the four Las Vegas locations indicated limited visitor cannibalization over the last six months, despite the stores’ close proximity. Only 6.2% and 7.6% of the S Decatur Blvd store’s trade area overlapped with the W Craig Rd and S Rainbow Blvd stores’ trade areas, respectively.
These findings show that there is no one-size-fits-all approach to store spacing – it varies by brand, category, and market. Analyzing a company’s existing store network alongside competitor density and overall demand can help determine how closely locations can be placed without hurting performance. In many cases – especially in high-frequency categories like grocery – markets can support stores that are closer together than expected.
Strategic Takeaways:
Site selection strategy needs to take into account local demand and visitation behavior typical of the category as a whole and of existing locations in particular.
Trade area analysis can reveal where a market allows for network densification without significant risk of visit cannibalization.


.svg)


.avif)


