


What is Real Estate Market Analysis?
Real estate market analysis is the process of collecting and analyzing all the relevant information needed to make informed decisions about the acquisition, sale, rental, or development of physical property. The goal is to understand how a property compares to its competitive set, how local dynamics shape performance, and where opportunities or risks may emerge.
In residential real estate, agents frequently rely on comparative market analysis (CMA) – an approach that evaluates a home’s attributes against similar properties in the area – to estimate fair market value. Buyers and sellers use CMA to calibrate expectations: setting an asking price, determining how aggressively to bid, or gauging how a neighborhood’s dynamics might influence a transaction.
Commercial real estate (CRE) requires a broader and more complex analytical lens. Investors, developers, and brokers assess market conditions to refine investment strategies, evaluate deal terms, and identify the most productive uses for land. A CRE market analysis incorporates a wide range of metrics to help answer questions such as:
- Which markets are positioned for growth, and which may face contraction?
- Which cities present the strongest opportunities for rental-property investment, and where could demand soften?
- How likely are delinquency and vacancy rates to remain low in specific submarkets?
- Should a parcel support a shopping center, office development, or multifamily project?
- Where can a retail brand expand with the highest potential for sustained performance?
This guide highlights how brokers, owners, and buyers can leverage location intelligence to enhance real estate market analysis and support more confident decision-making.
Key Factors in Real Estate Market Analysis
Real Estate Market Analysis in Practice: The Role of Location Intelligence
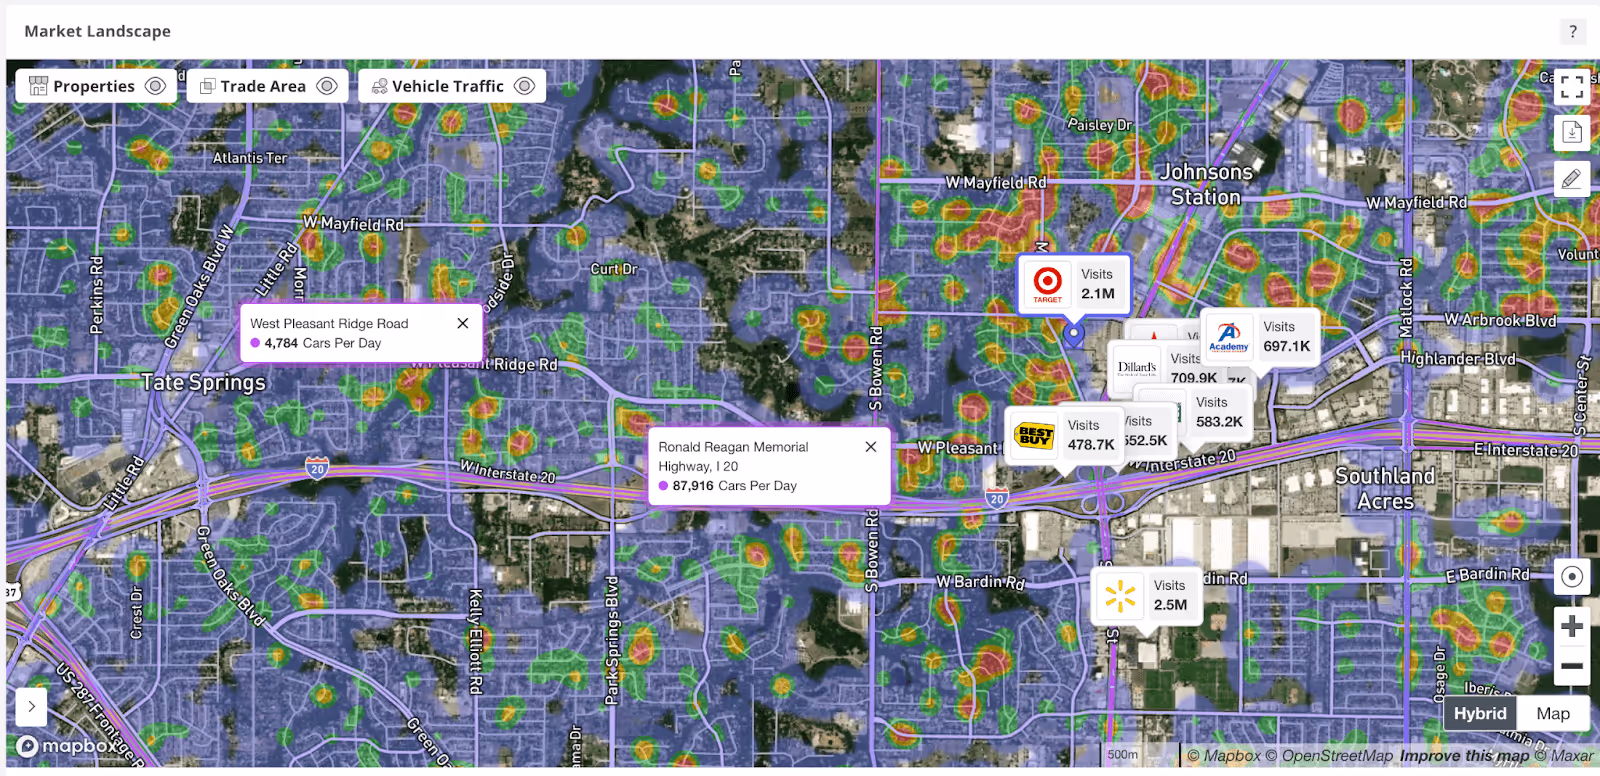
Location intelligence plays a central role in commercial real estate market analysis. Many of the most meaningful market- and property-level signals – from shifting population patterns to retail visitation trends – rely on foot traffic data and other forms of mobility analytics. These inputs help convert qualitative impressions of a market into quantifiable, comparable metrics that strengthen decision-making across asset types.
The examples below highlight how different segments of the CRE industry apply these insights to strengthen decision-making and improve underwriting.
1. Real Estate Market Analysis for Multifamily Rental Properties
A firm evaluating multifamily opportunities across multiple cities needs clarity on population movements, neighborhood dynamics, and long-term demand signals. Foot traffic and mobility analytics help reveal these patterns at both macro and micro levels.
How Location Intelligence Supports Multifamily Decisions
- Mobility patterns: Track population movements at state, CBSA, ZIP code, and neighborhood levels.
- Demographic indicators: Align asset strategy with the demographic and economic profile of incoming residents.
- Neighborhood vitality: Understand visitation to retailers, service nodes, and business centers.
- Contextual risk factors: Quantify neighborhood quality with crime profiles and development pipeline data.
Together, these inputs help investors evaluate whether a location is gaining momentum or showing early signs of softening. They also support a more complete risk–return assessment before pursuing an acquisition.
2. Real Estate Market Analysis for Retail Properties: Shopping Centers and Stores
Retail CRE depends heavily on understanding how customers move through physical space. Foot traffic data often serves as a direct, real-time indicator of demand – making it essential for evaluating both shopping centers and individual storefronts.
How Location Intelligence Supports the Sale of a Shopping Center
A broker marketing a center can use visitation analytics to quantify performance and position the asset competitively.
Key Location Intelligence Metrics Include:
- Total property visitation volumes.
- Distribution of visits across tenants.
- Peak visitation times by day and daypart.
- Demographic and psychographic attributes of visitors.
- Census block groups (CBGs) feeding traffic to the center.
- Benchmarking of visitation levels against competing centers.
These insights help shape pricing expectations, ROI projections, and buyer-facing narratives that emphasize concrete performance indicators rather than anecdotal impressions.
How Location Intelligence Supports the Leasing of a Vacant Store
For a landlord or broker seeking to lease a single storefront within a center, local foot traffic dynamics can clarify the property’s demand potential and inform lease negotiations.
Key Location Intelligence Metrics Include:
- Foot traffic volumes immediately surrounding the property.
- Weekday vs. weekend visitation patterns.
- Daytime vs. evening visitation peaks.
- Visitation trends relative to nearby competitors.
- Demographic fit of consumers in the surrounding area or visitors to the retail center.
If evening and weekend visitation are disproportionately high, for example, the property may be better positioned for dining or entertainment – strengthening the leasing pitch and supporting better pricing alignment.
Location intelligence ultimately improves the quality of CRE decision-making by grounding strategy in real-world behavioral patterns – whether that means tracking migratory trends for a multifamily development or analyzing consumer visitation for a regional shopping center.
How Placer.ai Optimizes Real Estate Market Analysis
Using a location intelligence platform like Placer.ai enables real estate professionals to analyze market, industry, and consumer trends with greater precision. Placer.ai leverages a panel of tens of millions of devices and utilizes machine learning to make accurate estimations for foot traffic across the country, from specific POIs, to chains, markets, and regions. Visitation data is enhanced with Placer Marketplace 3rd party datasets that further describe businesses, audiences, and markets.
Insights into how audiences and places interact are presented via an intuitive UI, data feeds, or the Placer API. Placer.ai’s dedicated support professionals and best-in-class research team are also available to deliver expert analysis and strategic guidance.
Whether you’re conducting real estate market analysis to benchmark properties, understand market conditions, or assess risk and return, Placer.ai provides the data and insights to strengthen your strategy.
Key Takeaways
1. Efficient real estate market analysis integrates market-level and property-level data into a unified view.
Understanding demographic shifts, neighborhood vitality, and property performance enables stakeholders to evaluate risk and identify the strongest markets and assets.
2. Location intelligence turns qualitative impressions into measurable signals that inform decision-making.
Visibility into foot traffic and migration trends helps investors, brokers, and owners assess demand, benchmark assets, and identify submarket momentum long before traditional indicators catch up.
3. Applying location intelligence across asset types strengthens strategy.
Whether analyzing migration flows for a multifamily project or benchmarking visitation for a shopping center, up-to-date behavioral insights help CRE professionals price more accurately, position assets more effectively, and pursue opportunities with greater confidence.

