


.svg)


Mall Visits Held Steady in February
Last year was a leap year, so February 2025 had one less day than February 2024 – leading to dips in year-over-year (YoY) monthly comparisons across the board, including in the mall space.
But comparing YoY at average daily visits – a more accurate analysis of YoY performance when comparing a regular year to a leap year – reveals that visits to indoor malls and open-air shopping centers held relatively stable in February 2025, despite the sharp drop in consumer confidence. And both mall types outperformed the wider retail YoY average – highlighting the ongoing resilience of the retail format.
Meanwhile, outlet malls continued lagging behind both overall retail numbers and the other two mall types. This mall type tends to attract a slightly lower-income visitor base, which could be more susceptible to economic uncertainties – and outlet mall shoppers may have avoided long travels in the cold, preferring to look for discounted items online or in off-price stores closer to home.
Valentine’s Day Boost
Malls’ unique position as both shopping centers and entertainment hubs likely contributed to malls’ stable February visitation patterns amidst the wider consumer headwinds. All three mall types saw significant visit increases on Valentine’s Day (February 14th) along with a rise in the share of evening (7 PM to 10 PM) visits. At the same time, only outlet malls saw a slight increase in the share of shorter visits (under 30 minutes) on Valentine’s Day.
This data suggests that malls played a role in many consumers’ Valentine’s Day celebrations – both in serving as a one-stop shop for gifts and as a centralized place with a variety of dining and entertainment options for the perfect Valentine’s date night.
Malls’ Enduring Draw
The steady February foot traffic coupled with strong engagement on key holidays like Valentine’s Day underscores the enduring role of malls as more than just shopping destinations. As we move further into 2025, the ability of malls to adapt and cater to evolving consumer behaviors will remain a critical factor in their continued success.
For more data-driven retail insights visit placer.ai.

The Kroger Company is one of the largest grocery retailers in the U.S, and the company continues to play a key role in the supermarket industry in 2025. We dove into traffic data for the company as a whole and for its leading banners to understand what 2025 may hold in store for the corporation.
Kroger’s Role in the Wider Grocery Landscape
Kroger and its variety of banners play a key role in the U.S. grocery landscape, with the company receiving around 16% of all visits to grocery stores nationwide (excluding non-traditional grocers such as superstores and wholesale clubs). And although Kroger’s visit share varies by state, the company receives more than a quarter of all grocery visits in 18 states, including four states – West Virginia, Utah, Colorado, and Kentucky – where Kroger receives more than half of the state’s grocery visits.
It seems, then, that the company is positioned to continue having a major impact on the U.S. grocery market in 2025 – even without the addition of Alberstons’ grocery portfolio.
Foot Traffic to Kroger Holds Steady
The company’s recent visit performance also highlights Kroger’s ongoing resilience within an evolving grocery landscape. Traffic data shows that overall visits to Kroger chains held steady in 2024, with yearly visits just 1.3% lower than in 2023.
And the visit stability continued into 2025, with year-over-year (YoY) visits up every week in January 2025 just slightly below 2024 levels in February 2025 – indicating that shoppers are remaining loyal to Kroger’s chains amidst the inflationary environment.
Which Kroger Banners Are Performing Best?
Kroger operates a variety of banners, each catering to different regional markets and consumer segments. And analyzing 2024 visit data for Kroger’s largest chains shows overall stability across the portfolio – although some banners experienced slightly stronger growth while others did post minor visit gaps.
California-based Food 4 Less led the way with a 2.5% YoY visit increase in 2024, and Colorado-based King Soopers posted YoY visit growth as well. Smith’s, which operates in most of the West, Ralphs in California, and Harris Teeter in the Southeast and Mid-Atlantic stayed within one percentage point of their 2023 visit performance. Arizona-based Fry’s and the company’s namesake banner Kroger also remained close to their 2023 traffic levels, while Fred Meyer and Pick ‘n Save saw minimal YoY visit gaps.
Kroger’s steady foot traffic highlights its strong consumer loyalty and adaptability. And as the grocery sector continues to shift, the company’s ability to maintain its stable performance across its portfolio and regions of operations will ensure it maintains its status as a grocery giant in 2025 and beyond.
For more data-driven retail insights, visit placer.ai.

In February 2024, Gap Inc. hired Zac Posen as Creative Director, tasking the designer with revitalizing the companies’ portfolio of brands. A year later, we analyzed the data to understand where the company stands today and uncover untapped opportunities for growth.
Athleta Led Gap Brands in 2024
In 2024, visits to most Gap brands declined slightly compared to 2023, with the company’s four banners collectively experiencing a year-over-year (YoY) traffic dip of 3.5%.
Athleta outperformed the other three brands as well as the overall apparel (excluding off-price and department stores) average, with yearly visits up 0.2% and positive quarterly traffic growth for two of the four quarters. Old Navy came in second, starting the year strong with a 4.2% YoY increase in Q1 visits and ending 2024 with Q4 visits down just 2.4% – outperforming the industry’s YoY dip of 3.3%. And though Gap did lag slightly behind the overall apparel average, the brand managed to stay relatively close to its 2023 visit levels, indicating that its performance is stabilizing.
Meanwhile, Banana Republic experienced the sharpest visit declines with 2024 traffic down 9.6% YoY – indicating that the brand continues to face significant challenges.
The Banana Republic Opportunity
Banana Republic’s 2024 performance continues a multi-year trend of declining traffic, despite the brand’s relatively affluent consumer base – an audience that, in theory, should have positioned the brand to weather the current inflationary environment more effectively.
But the brand may be positioning itself for a comeback. Last year, Banana Republic underwent a leadership change, with Gap Inc. CEO Richard Dixon stating that “2024 will be about getting back to the basics.” The brand has been redesigning select stores and leaning into influencer marketing with the goal of “reestablishing the brand to thrive in the premium lifestyle space.”
And as return to office mandates continue to roll in – reinvigorating the long dormant demand for business casual and office wear – the chain is well positioned for a comeback.
Do Banana Republic Shoppers Want More Athleisure?
Location intelligence analysis also reveals an additional growth opportunity. Banana Republic is the only Gap banner without a dedicated sportswear line. Athleta specializes in athletic wear, Gap offers GapFit, and Old Navy’s activewear line has been a core component of the banner’s success in recent years.
But the data indicates that Banana Republic shoppers are just as active as visitors of the other Gap banners – in fact, cross-visit data suggests that those who shop at Banana Republic frequent fitness chains at similar rates as Athleta customers.
Analyzing cross-visitation to leading sporting goods retailers also indicates high demand for sportswear among Banana Republic shoppers: Consumers who visit Banana Republic visit Dick’s Sporting Goods and Academy Sports + Outdoors at higher rates than Gap Shoppers, and visit lululemon and REI at higher rates than both Gap and Old Navy visitors. This data strongly suggests that Banana Republic customers would likely embrace an expanded product mix that includes premium athleisure and sportswear.
The Men’s Athleisure Opportunity
While Gap Inc. already offers premium women’s activewear through its Athleta brand, none of Gap Inc.’s existing brands cater to the growing demand for premium men’s athletic wear. Expanding Banana Republic’s offerings to include a high-end athleisure line – with a specific focus on menswear – could help the brand carve out a niche in this fast-growing segment while leveraging its existing customer base’s interest in performance apparel.
Beyond product expansion, this move could align with Banana Republic’s broader repositioning efforts, reinforcing its identity as a premium lifestyle brand that caters to both professional and active lifestyles. Given the increasing overlap between workwear and athleisure, a thoughtfully designed sportswear line could also strengthen Banana Republic’s appeal to younger, fashion-conscious consumers who seek versatility in their wardrobes.
Gap Inc.’s Potential for Growth in 2025
As Gap Inc. navigates its next phase under Zac Posen’s creative leadership, identifying and leveraging untapped opportunities—such as Banana Republic’s athleisure potential—will be critical for reinvigorating the company’s portfolio. By strategically diversifying its offerings, Gap Inc. can not only address shifting consumer preferences but also carve out a more competitive position in an evolving retail landscape.
For more data-driven retail insights, visit placer.ai/blog.
How did Walmart, Target, and wholesale clubs perform in 2024? What do early 2025 foot traffic trends tell us about superstores’ growth potential in the coming year? And what do visitation patterns at Target and Walmart reveal about the role each chain plays in the wider retail landscape? We dove into the data to find out.
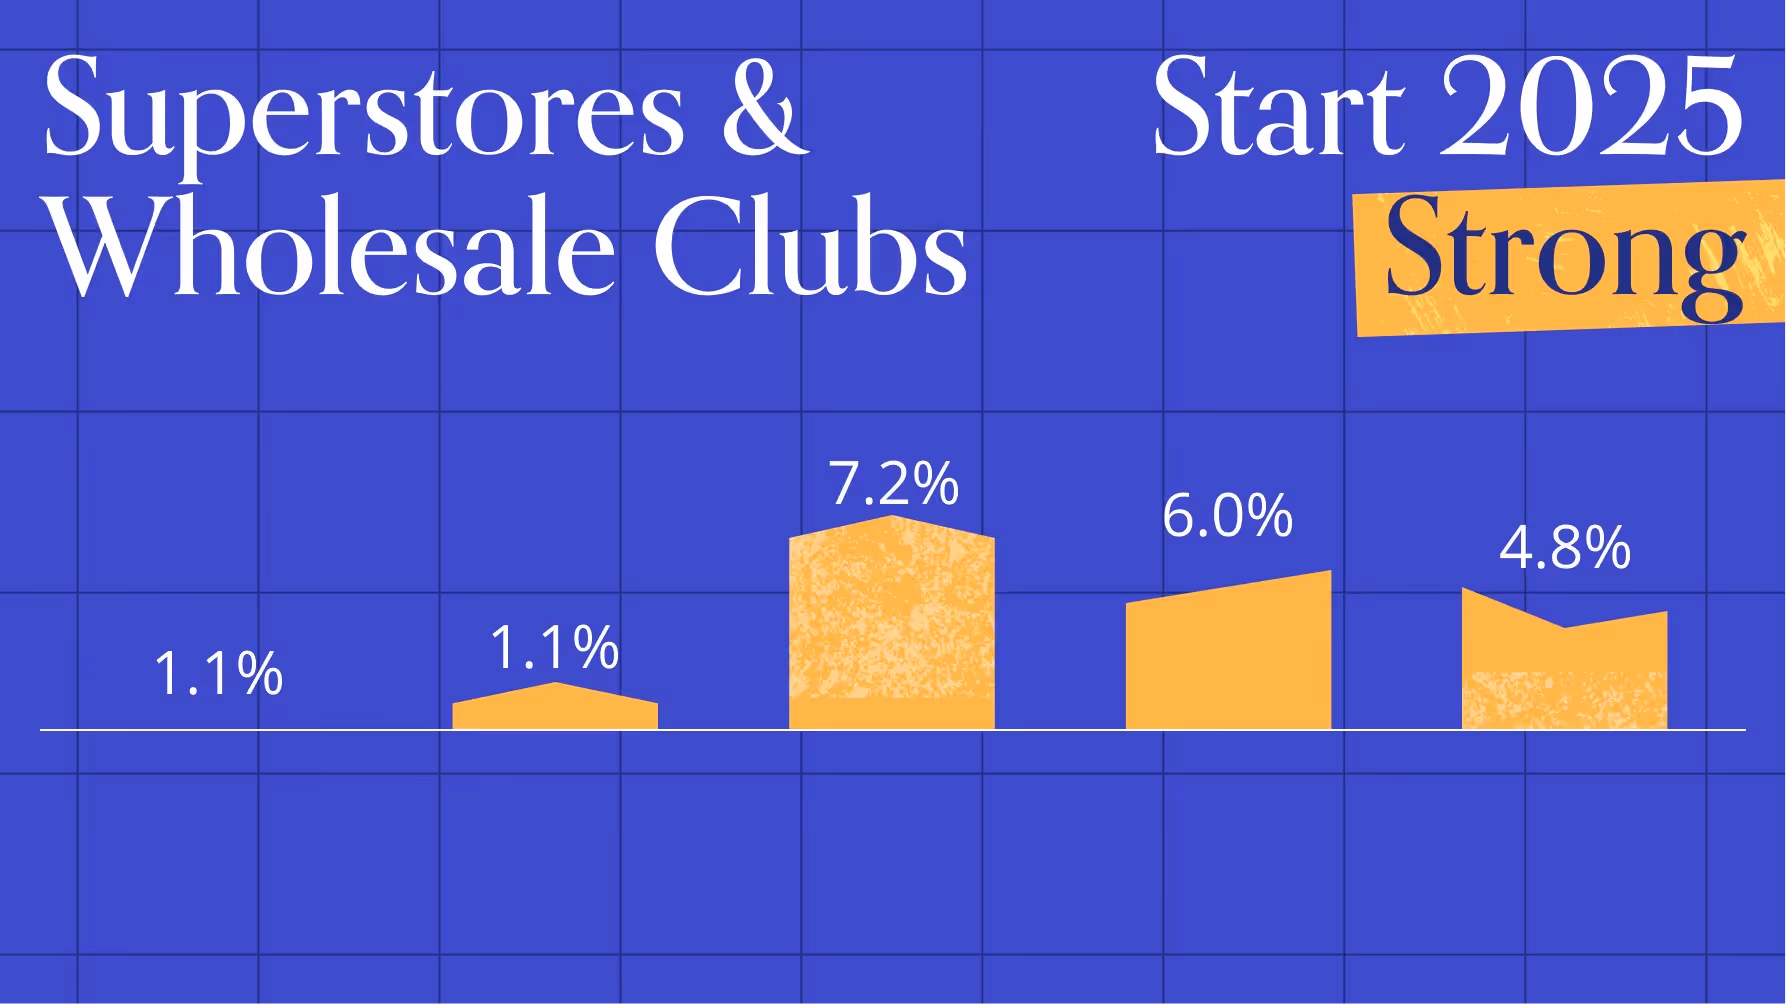
Superstores & Wholesale Clubs Start 2025 Strong
Wholesale clubs outperformed more traditional superstores in 2024, as Costco, BJ’s, and Sam’s Club saw 4.8% to 7.2% YoY increases in visits while Target and Walmart’s traffic remained relatively flat. And though wholesale clubs continued outperforming Target and Walmart in the new year as well, the two superstore leaders did see clear visit increases of 3.6% and 3.0%, respectively, in January 2025 – a promising sign for the retail giants’ growth in the year ahead.
How Do Audience and Shopping Behavior Differ at Target and Walmart?
Target and Walmart both operate national chains of one-stop shops that carry a variety of consumables and non-consumables, including groceries, apparel, toys, and electronics. But diving into the demographics of the two brand’s captured market reveals that each chain serves a slightly different audience.
Target tends to attract visitors from areas with higher HHI and larger households: The company’s captured market includes a larger share of both households with children and non-family (e.g. roommates) households than Walmart’s, perhaps due to Target’s relative appeal to both suburban and strongly urbanized segments. Meanwhile, Walmart seems to attract more repeat monthly visitors (who visit the chain at least twice a month), perhaps thanks to the chain’s extensive grocery offerings and to its popularity among rural and semirural segments who may not have a variety of retail options to frequent.
Walmart Shoppers Stay Longer, Target’s Visitors Come Later
The two chains’ visitor base also exhibit differences in in-store behavior. Walmart visitors do seem to linger a little longer in store, with 20.7% of the chain’s visits lasting longer than 45 minutes compared to Target’s 17.1% – maybe thanks to the mission-driven shopping behavior of some of its rural and semirural customer base. But despite the longer visits, Walmart still receives a larger share of weekday visits than Target – perhaps thanks to its larger share of single shoppers with fewer weekday commitments.
For more data-driven consumer insights, visit placer.ai.

With consumer interest in wellness showing no sign of slowing down, we dove into fitness foot traffic data to see how the segment performed in 2024 and understand what the new year holds for the category.
Fitness Category Still Growing
The fitness category has yet to hit its peak. Following consistent year-over-year (YoY) growth in monthly visits throughout 2024, traffic to the category rose again in January 2025 with visits 2.3% higher than in January 2024 – a strong start for what is likely to be another standout year in the fitness space.
Traditional January Fitness Spike Continues in 2025
And while some may consider New Year’s resolutions to be an outdated, unhelpful institution, the data indicates that January still drives a significant fitness spike as Americans across the country commit to their wellness goals at the start of the year.
Fitness visits in January 2025 were 21.2% higher than in December 2024 – only a slightly lower spike than the month-over-month (MoM) January 2024 jump of 23.4% – indicating that New Year’s resolutions are still quite popular in 2025. At the same time, the slightly lower MoM growth in January may also reflect the relatively stable visitation trends throughout 2024 – a shift from the traditional patterns of fitness chains losing about 30% of their members each year.
Interest in Wellness Boosting Gyms Across the Board
Diving into individual fitness chains reveals that the category’s ongoing success is driving visit growth across the fitness segment – including at budget gyms such as Planet Fitness and Crunch Fitness, mid-range chains such as LA Fitness, and premium brands such as Life Time. And critically, both overall visitors and visit frequency were consistently elevated in H2 2024 and going into 2025, indicating that not only are more people going to the gym – they’re also generally going more frequently. It seems, then, that the wellness trend of the past few years is still gaining momentum.
Fitness Consumer Trends – Variation in Visit Frequency by Season & Brand Tier
While the increased interest in wellness seems to have brought a boost in industry-wide fitness visits, analyzing visit frequency by brand and quarter does reveal some differences – and some similarities – across different brand tiers.
All four brands analyzed – Planet Fitness, Crunch Fitness, LA Fitness, and Life Time – received the largest share of repeat visitors (at least twice a month) in Q1 2024, as New Year’s resolutions drove a boost in gym-going frequency. The share of repeat visitors then consistently fell throughout the year, and the chains (with the exception of Life Time) received the lowest share of repeat visits in Q4 as vacations and holidays likely interfered with people’s exercise schedule.
One might expect high value low price (HVLP) gyms to attract lower-usage members – since the modest fee may mean that members are not compelled to get the most bang for their buck – but looking at the data reveals that visit frequency did not necessarily correlate with membership pricing. While Planet Fitness and Crunch Fitness are both HVLP chains, their visit frequency patterns differed significantly: Planet Fitness seemed to attract a relatively high share of lower-usage members, while Crunch Fitness’ visit frequency exceeded that of higher-priced LA Fitness and was in fact was closer to that of premium chain Life Time.
For more data-driven consumer insights, visit placer.ai.

The Placer.ai Nationwide Office Building Index: The office building index analyzes foot traffic data from some 1,000 office buildings across the country. It only includes commercial office buildings, and commercial office buildings with retail offerings on the first floor (like an office building that might include a national coffee chain on the ground floor). It does NOT include mixed-use buildings that are both residential and commercial.
Temporary Setback for RTO
Several factors seem to have converged in January 2025 to temporarily hamper the return to office (RTO) recovery. First, last month brought a polar vortex to much of the United States, compelling Americans to stay indoors and avoid unnecessary trips outside – including to the office. January 1st also fell on a Wednesday this year, and many people likely took advantage of the calendar luck to extend their vacation through the weekend – leading to fewer January office visits compared to years when New Year’s Day falls earlier in the week.
As a result, the January 2025 bump appeared relatively muted: Visits in January 2025 were only 17.7% higher than in December 2024, compared to a 31.3% month-over-month increase from December 2023 to January 2024. And visits were 40.2% lower than they were in pre-pandemic January 2019 – a slightly worse showing than the 39.2% pre-pandemic visit gap of December 2024.
New York Continues to Lead the RTO Pack
The meteorological and calendar challenges seem to have impacted office visits on a metro area as well, with few cities analyzed making significant RTO strides in January 2025. The sole exception was New York, where January 2025 visits were only 19.0% lower than they were in January 2019 – a slightly smaller visit gap than the previous month.
Impact of Polar Vortex Stronger in Southern Cities
Diving into the year-over-year data shows the impact of the polar vortex more clearly. Many of the cities where residents are used to and equipped for the colder weather – Chicago, Boston, and New York – seemed to have experienced a relatively minimal impact from the arctic blast. The one exception was Denver, which was exceptionally frigid – with subzero temperatures – so that even those used to cold may have opted to work from home.
But in metro areas where weather tends to be relatively warm – including Atlanta, Houston, Washington, D.C., and Dallas – the impact of the polar vortex was visibly stronger. In these cities, the YoY visit gap ranged from 7.5% (Atlanta) to 12.0% (Dallas) – as employees without proper winter jackets or snow tires likely chose to stay cozy and avoid the chill.
Temporary Setback Within a Still Unfolding Story
January 2025’s RTO stats may not have been particularly impressive, but the relatively weak office data is likely more a reflection of last month’s unique challenges rather than a slowdown in RTO momentum. With the weather now back to normal and no mid-week holidays in the near future, the coming months will be critical in evaluating if the RTO is in fact slowing down or whether January just marked a temporary setback within a still unfolding story.
For more data-driven insights, visit placer.ai.

