


.svg)


.jpg)
Sprouts Visits Still on the Rise – But Visits per Venue Are Moderating
Sprouts closed Q4 2025 on a positive traffic note, with overall visits rising 4.0% year-over-year (YoY), although average visits per location declined slightly – suggesting that growth in its more established core markets may be beginning to normalize. As such, the company’s recent expansion into new states – including the opening of its first New York location – reflects a logical next phase of growth, as Sprouts looks beyond its traditional strongholds to unlock incremental demand in less penetrated geographies.
Longer-Distance Shoppers Fuel More Visit Gains
A closer look at visit patterns by distance suggests that Sprouts’ growth is increasingly being driven by customers traveling from farther away – a dynamic that aligns with its broader national expansion strategy. From September through January, visit gains from shoppers located more than five miles away consistently outpaced those from within a five-mile radius.
This pattern points to expanding trade areas and growing destination appeal, which is critical as the retailer enters new states and builds brand awareness beyond its traditional strongholds. As Sprouts pushes into newer geographies, its ability to draw shoppers from a wider radius reinforces the scalability of its model and supports its strategy of growing into a more nationally recognized specialty grocer.
For more data-driven grocery insights, visit placer.ai/anchor.
Placer.ai leverages a panel of tens of millions of devices and utilizes machine learning to make estimations for visits to locations across the US. The data is trusted by thousands of industry leaders who leverage Placer.ai for insights into foot traffic, demographic breakdowns, retail sale predictions, migration trends, site selection, and more.
Malls Start the Year Strong
Malls started the year on a strong note, with year-over-year traffic increases across all three mall formats. Open-air shopping centers received the largest gains, with visits up 6.2% compared to January 2025. Indoor malls, which outperformed the other formats for much of 2025, also posted solid growth of 4.5% YoY – a notable result given their already strong performance last January. Even outlet malls, which struggled to maintain growth momentum for most of 2025, saw a 3.6% increase in visits – perhaps suggesting that consumers are entering 2026 more willing to return to discretionary shopping destinations after a cautious 2025.
Increased Returns Activity Likely Contributed to Visit Strength
A closer look at the data suggests that a meaningful share of last month’s mall traffic may have been driven by post-holiday retail returns. There is some evidence that return activity was higher this January than in January 2025, and the timing of visits supports this interpretation.
Mall traffic was heavily front-loaded to the first two weeks of the year – consistent with the post-holiday returns window – with visit growth already beginning to moderate during the third week of January. (The more pronounced decline in traffic observed in the final week of the month was likely driven by the impact of Winter Storm Fern, which weighed on visits across all mall formats).
Short Trips Surge, but Longer Visits Grow Too
Visit duration patterns further support the idea that increased returns activity drove much of January’s mall traffic surge – the largest gains were concentrated in short visits, with trips lasting 10 minutes or less increasing by double digits across all mall formats.
At the same time, the data also shows year-over-year growth in longer visits, indicating that higher-quality, more engaged mall trips increased in January 2026 as well. So while post-holiday returns clearly played a role in driving January foot traffic, the simultaneous growth in longer trips suggests that shoppers were also spending time browsing or making additional purchases.
Efficiency Meets Engagement in 2026
As 2026 unfolds, this blend of efficiency and engagement will be a key dynamic to watch: consumers appear increasingly willing to re-enter physical retail spaces, but they remain intentional about how they shop. Mall formats that can seamlessly support quick, frictionless visits while also encouraging extended dwell time may be best positioned to capture both sides of evolving consumer behavior in the year ahead.
For more data-driven retail insights, visit placer.ai/anchor.
Placer.ai leverages a panel of tens of millions of devices and utilizes machine learning to make estimations for visits to locations across the US. The data is trusted by thousands of industry leaders who leverage Placer.ai for insights into foot traffic, demographic breakdowns, retail sale predictions, migration trends, site selection, and more.
Higher-End Bloomin’s Concepts Benefited From Affluent Demand
Fleming’s Prime Steakhouse & Wine Bar – Bloomin’s most upscale concept – posted year-over-year visit growth in Q4 2025, while elevated-casual chain Bonefish Grill also sustained traffic gains. Both brands draw disproportionately from higher-income trade areas: Bonefish and Fleming’s captured market median household incomes are $88.0K and $102.6K, respectively, compared with a nationwide median of $79.6K, according to STI: Popstats 2024.
By contrast, Outback Steakhouse saw largely flat traffic in Q4 2025, while Carrabba’s Italian Grill recorded a 3.7% year-over-year decline in visits. These brands attract diners from trade areas with median household incomes closer to the national average – $79.7K for Outback and $82.9K for Carrabba’s.
The traffic trends combined with the trade-area income patterns suggest Bloomin’s brand performance mirrors broader industry dynamics. As consumers remain selective with discretionary spending – particularly on dining out – traffic is increasingly concentrated among higher-end destinations offering a clear “value-plus-experience” proposition or casual chains with a well-defined value proposition. Meanwhile, undifferentiated casual dining brands continue to lag.
Against this backdrop, Outback Steakhouse’s flat to slightly negative same-store traffic through much of H2 2025 reflects its positioning within the more challenged segment of casual dining rather than a lack of strategic focus. Management has outlined plans to sharpen the Outback's value proposition through improvements in food quality, guest experience, and operational consistency – steps designed to better position Outback with diners seeking greater value and differentiation in 2026.
Casual Bloomin' Brands Faced Greater Holiday Pressure
Taken month by month, the data suggest that Bloomin’ Brands’ higher-end concepts benefited from both stronger underlying demand and greater flexibility in capturing discretionary spend. Meanwhile core casual brands remained more exposed to year-end pressure.
Bonefish Grill’s same-store traffic showed episodic strength – most notably in October – indicating periods of solid unit-level demand even as momentum softened into the holidays. Fleming’s Prime Steakhouse & Wine Bar, by contrast, delivered its strongest gains on an overall traffic basis, pointing to system-level growth and traffic concentration that helped offset more uneven same-store performance.
Meanwhile, Outback Steakhouse and Carrabba’s Italian Grill saw declines deepen into December across both metrics. This dip underscores the heightened vulnerability of traditional casual dining concepts during the holiday season, when increased competition for discretionary spending tends to pressure lower-differentiated dining occasions.
Positioned For A More Balanced Portfolio Performance in 2026
Looking ahead to 2026, Bloomin’ Brands appears positioned to benefit as stabilizing consumer conditions intersect with ongoing brand-level investments. With higher-end concepts demonstrating resilience and Outback’s repositioning efforts underway, the portfolio is better aligned to capture both experience-driven and value-oriented dining demand.
For more data-driven consumer insights, visit placer.ai/anchor.
Placer.ai leverages a panel of tens of millions of devices and utilizes machine learning to make estimations for visits to locations across the US. The data is trusted by thousands of industry leaders who leverage Placer.ai for insights into foot traffic, demographic breakdowns, retail sale predictions, migration trends, site selection, and more.

Saks Global’s Bankruptcy Was About More Than Debt
Saks Global’s Chapter 11 filing reflects a convergence of balance-sheet pressure and evolving consumer behavior rather than a sudden collapse of its brands or customer relevance. Following the acquisition of Neiman Marcus in late 2024, the company carried a significantly higher debt load, which reduced financial flexibility at a time when the broader luxury department store sector was facing uneven demand.
But while a missed interest payment was the immediate catalyst for the bankruptcy filing, traffic data suggests that the challenges facing Saks Global extended beyond balance-sheet constraints. AI-powered traffic data shows that Saks Fifth Avenue and Neiman Marcus were underperforming most major department stores both on average visits per venue and on rates of repeat visitors already in H1 – before supplier relationships became more visibly strained. So even if inventory constraints and vendor caution likely amplified these trends in H2, the data suggests that softer consumer engagement with these chains was also due to earlier challenges in delivering an experience that consistently brought shoppers through the door.
(Kohl’s is a notable exception – while it underperformed Neiman Marcus on year-over-year visits per venue in H1, the banner still maintained the highest rate of repeat visitation by far, pointing to a more resilient customer base that can help cushion short-term traffic volatility).
Saks and Neiman Traffic Patterns Suggest Fewer Destination Visits
Analyzing in-store behavior at Saks Fifth Avenue and Neiman Marcus relative to other premium department stores is also revealing. Both banners skew more heavily toward midday and weekday visits than Nordstrom or Bloomingdale’s, a pattern that suggests a greater reliance on proximity- and convenience-driven traffic rather than by planned destination trips.
In contrast, Nordstrom and Bloomingdale's capture more visits during evenings, and weekends – times typically associated with browsing, social shopping, and occasions when shoppers are more willing to spend time in-store. These visit patterns reinforce the idea that Saks and Neiman Marcus are currently attracting more “pop-in” visits than experience-led ones.
Rebuilding Destination Retail While Right-Sizing the Footprint
Looking ahead, Saks Global’s path out of bankruptcy depends on repairing its balance sheet while rebuilding in-store experiences that support destination-driven shopping. To remain competitive, the company will need to restore consistent inventory, sharpen merchandising curation, and reinvest in service and experiences that encourage planned visits rather than incidental stop-ins.
At the same time, the data suggests a clear framework for rationalizing the footprint. Underperforming locations are likely those that skew heavily toward weekday, midday, and low-frequency visits, signaling reliance on proximity rather than loyalty or experience. These stores may struggle to justify continued investment, particularly if they sit in markets with limited repeat demand or weak engagement relative to peers. By using traffic trends, visit timing, and repeat behavior to guide closure or consolidation decisions, Saks Global can emerge from bankruptcy with a smaller but healthier store base – one aligned around markets where the brand can reclaim its role as a destination. In that sense, bankruptcy offers not just a financial reset, but a chance to refocus the business around the stores and experiences most likely to drive sustainable, long-term demand.
For more data-driven insights, visit placer.ai/anchor.
Placer.ai leverages a panel of tens of millions of devices and utilizes machine learning to make estimations for visits to locations across the US. The data is trusted by thousands of industry leaders who leverage Placer.ai for insights into foot traffic, demographic breakdowns, retail sale predictions, migration trends, site selection, and more.
.avif)
How Did Winter Storm Fern Shape Consumer Behavior?
As Winter Storm Fern advanced across the U.S. in late January, consumer behavior followed a predictable pattern: early preparation gave way to a sharp pre-storm rush, followed by widening geographic divergence as conditions worsened. Retail visit data from January 22nd and 23rd highlights how quickly storm-driven demand intensified – and which categories and regions were best positioned to capture it.
Retail Visits Accelerated as the Storm Drew Closer
Retailers saw a clear escalation in traffic from January 22nd to January 23rd, underscoring how storm proximity compressed shopping activity into a narrow window.
Home Improvement & Furnishings retailers saw the largest visit spikes on both January 22nd and 23rd as consumers focused on preparing their homes ahead of the storm. Visits were already 20.2% above the YTD (January 1st to 23rd) daily average on January 22nd and rose to 41.7% above average the following day – making the category the clear pre-storm leader. The pattern suggests shoppers were prioritizing purchases such as heating supplies, generators, weatherproofing materials, and snow-removal equipment as conditions grew more imminent.
Grocery Stores recorded the second-largest increases, reflecting consumers’ efforts to stock up on food and beverages in anticipation of staying home, with visits up 14.2% on January 22nd and climbing to 28.4% on January 23rd compared to the YTD daily average.
Value-oriented and necessity-driven categories also saw demand intensify. Discount & Dollar Stores experienced a modest 6.2% lift on January 22nd, which surged to 25.5% the following day. Drugstores & Pharmacies saw visits climb from 9.8% to 21.0%, while Superstores rose from 7.5% to 19.9% over the same period.
Pet Stores & Services stood out for their late-breaking surge: after seeing virtually flat traffic on January 22nd (+0.2%), visits jumped to 18.5% above average on January 23rd, suggesting that many consumers delayed pet-related preparedness until just before conditions worsened.
Across all categories, the doubling of visit lifts from one day to the next indicates that while some consumers planned ahead, a significant share delayed their storm preparations until the threat felt immediate.
Storm Conditions Drove Growing Regional Divergence
The storm’s west-to-east progression was also reflected in shifting regional visitation patterns. On January 22nd, the largest visit surges were concentrated in parts of the Midwest, consistent with Winter Storm Fern’s earlier impacts across inland regions. By January 23rd, as the storm intensified and expanded across the South and Eastern Seaboard, retail visits spiked sharply in those areas as consumers rushed to complete last-minute errands ahead of worsening conditions. At the same time, parts of the Midwest saw more muted growth or visit slowdowns, suggesting that storm-related shopping activity there may have peaked earlier.
This data suggests that storm-related shopping remains a fundamentally local behavior, with consumers responding most strongly when severe conditions feel imminent in their immediate area. At the same time, the Midwest slowdown suggests that storm-related demand is finite and front-loaded, with visit activity tapering once households complete their initial preparation trips.
Winter Storm Fern Reveals How Quickly – and Locally – Storm-Driven Retail Demand Peaks
AI-driven location analytics reveals that storm-driven retail demand is not only intense but highly compressed, with visits surging in the brief window just before conditions deteriorate locally and fading quickly once preparation trips are complete. For retailers, capturing weather-driven demand seems to depend less on the size of the storm and more on aligning operations to where – and when – urgency is about to peak.
For more data-driven consumer insights, visit placer.ai/anchor.
Placer.ai leverages a panel of tens of millions of devices and utilizes machine learning to make estimations for visits to locations across the US. The data is trusted by thousands of industry leaders who leverage Placer.ai for insights into foot traffic, demographic breakdowns, retail sale predictions, migration trends, site selection, and more.
_texasroadhouse_dine.png)
Q4 2025 Reveals Uneven Traffic Gains Across Major FSR Chains
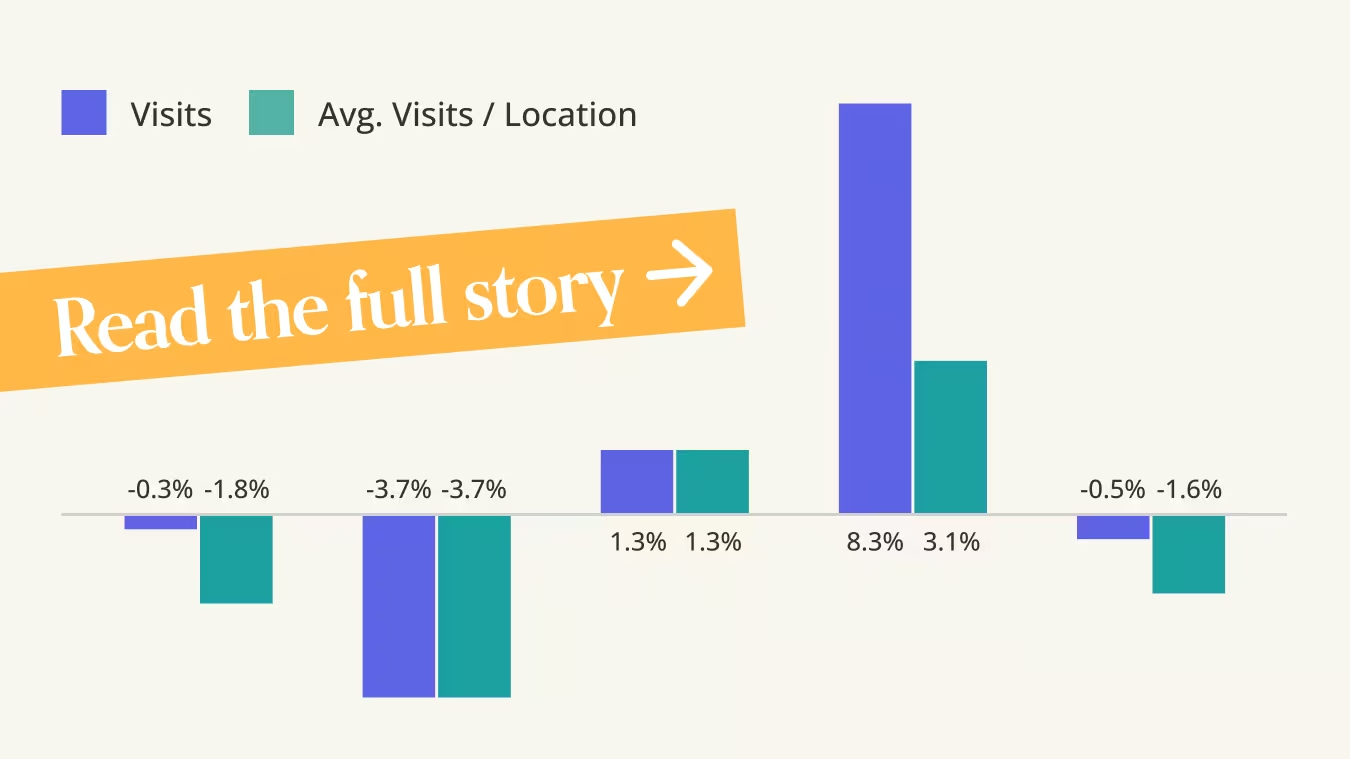
Recent traffic trends to major dining chains show the divergence within the full-service dining space going into 2026. While Brinker International's flagship brand Chili's Grill continued reaping the benefits of its popular food bundles and drinks specials, Maggiano's Little Italy – the company's more upscale concept – struggled to reach 2024 visitation levels in Q4 2025.
For both Dine Brands Global, Inc. and Texas Roadhouse, Inc., traffic changes were mostly due to storefleet reconfigurations. Dine Brands' three banners contracted in 2025, leading to overall visit declines at Applebee's and Fuzzy's (IHOP maintained stable traffic patterns) – but all three concepts outperformed in terms of average visits per venue as the company's rightsizing efforts appeared to be bearing fruit. Meanwhile, Texas Roadhouse, Inc. showed the opposite pattern as its three banners expanded, leading to overall visit growth – but average visits per venue decreased, suggesting that traffic gains were mostly driven by unit expansion.
These patterns reflect a more selective consumer environment heading into 2026, where growth is increasingly shaped by brand positioning, value perception, and disciplined fleet strategies rather than broad-based demand recovery. A closer look at monthly visit trends across major banners further illustrates these dynamics.
Chili’s Value Strategy Drove Success in 2025 – But Momentum Will be Harder to Sustain in 2026
After leading the full-service restaurant category in 2024, Chili’s once again emerged as a standout performer in 2025, delivering consistent monthly visit gains despite a softer consumer environment. The brand has successfully established and maintained a clear value proposition, helping keep Chili’s top of mind for consumers seeking an affordable sit-down dining option
At the same time, recent monthly traffic trends suggest that sustaining this momentum into 2026 may require continued innovation, whether through refreshed bundled offerings, targeted promotions, or menu updates that reinforce value without eroding margins. But even if traffic growth moderates in the year ahead, maintaining the elevated visitation levels achieved over the past two years would still leave Chili’s in a notably strong competitive position within the full-service dining landscape.
Rightsizing Helped Stabilize Traffic at Dine Brands
Applebee’s and IHOP saw YoY declines in overall visits, but same-store traffic generally held up better – indicating that fleet rationalization helped stabilize per-restaurant demand. These trends point to the importance of right-sizing footprints and prioritizing unit-level productivity in a constrained consumer environment.
Overall Traffic Growth for Texas Roadhouse
Visits to Texas Roadhouse in 2025 were up 2.1% compared to 2024, in part thanks to the chain's ongoing expansion. Same-store performance also remained positive for much of the year, suggesting that the larger store fleet can be supported by existing demand.
And even as traffic trends moderated toward the end of the year, the chain’s overall 2025 visit growth suggests an underlying demand that is strong enough to support Texas Roadhouse’s expanding footprint despite the most recent slowdown.
Positioning and Execution Will Shape 2026 Traffic Outcomes
Overall, traffic patterns at these three major FSR players point to a more selective and competitive full-service dining environment heading into 2026, where broad-based demand recovery remains elusive. Brands that clearly communicate value or actively optimize their store fleets appear better positioned to defend store-level demand, while expansion-led growth models face increasing pressure to deliver stronger unit-level productivity. As consumer discretion remains constrained, execution and positioning – not scale alone – will likely define traffic winners in the year ahead.
Fore more data-driven consumer insights, visit placer.ai/anchor
Placer.ai leverages a panel of tens of millions of devices and utilizes machine learning to make estimations for visits to locations across the US. The data is trusted by thousands of industry leaders who leverage Placer.ai for insights into foot traffic, demographic breakdowns, retail sale predictions, migration trends, site selection, and more.

