


.svg)


With the holiday season just around the corner, we dove into the Placer.ai Mall Index to see how these shopping mainstays performed during the fall retail lull.
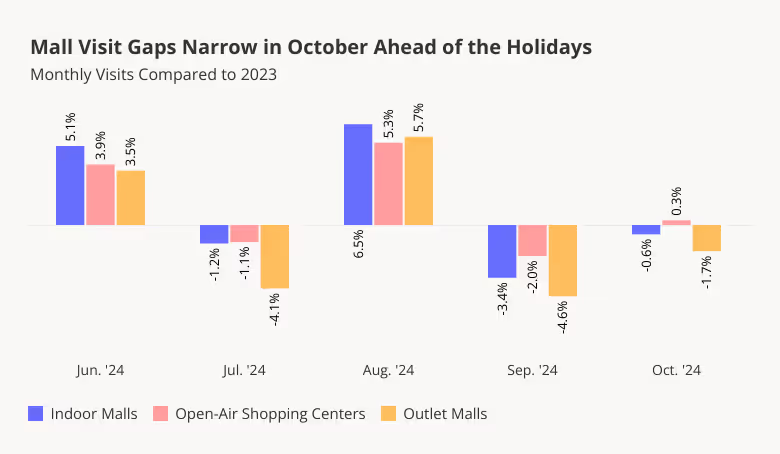
October Mall Visits on Par with 2023 Levels
Following several months of roller-coaster visit trends – as August visits surged compared to last year and September visits dipped year-over-year (YoY) – mall traffic stabilized in October: Last month’s visits to indoor malls, open-air shopping centers, and outlet malls generally matched 2023 visitation trends. The closing of the YoY visit gaps may indicate that consumers are once again ready to spend following the brief September slow-down – boding well for the upcoming holiday season.
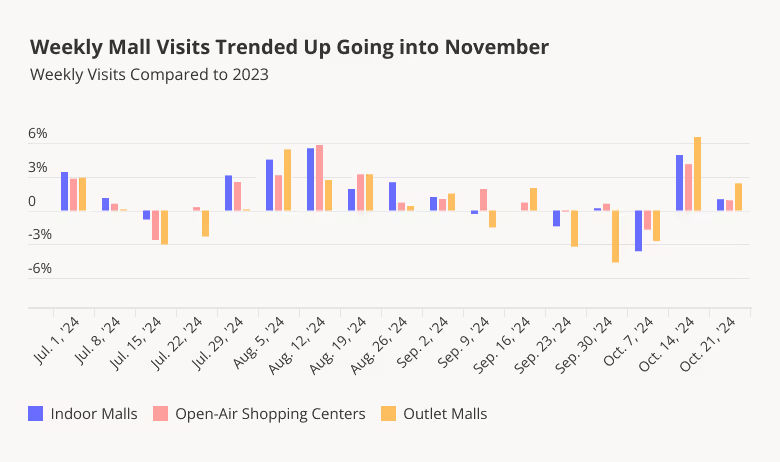
Weekly Trends Swing Positive Ahead of November
Diving into the weekly trends offers even further reasons for optimism: YoY visits over the last two full weeks of October were positive for all three mall categories, with outlet malls in particular seeing the largest YoY increases. Outlet malls’ positive performance during the second half of the month may signal a comeback for the format, which has generally lagged behind indoor malls and open-air shopping centers in recent months.
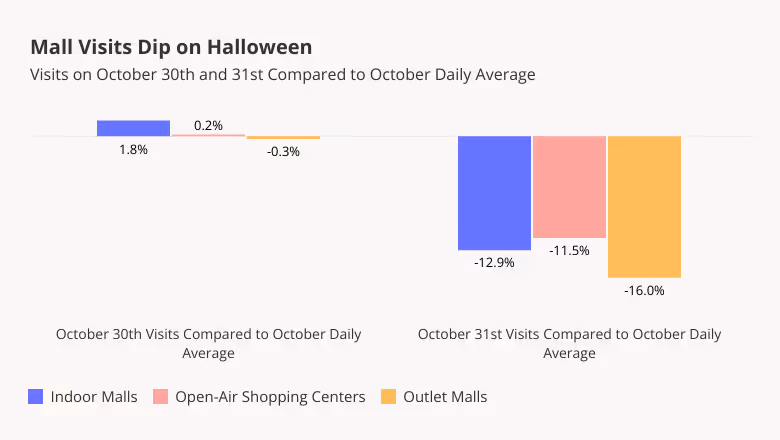
Mall Visits Dip on Halloween
Unlike certain retail categories that enjoy Halloween-driven visit surges either on the day itself or on October 30th, malls do not appear to benefit from the spooky holiday. Analyzing daily visits reveals that October 30th visits were on par with the daily October average, while October 31st traffic actually took a hit across the three mall formats in the Placer.ai Mall Index.
The dip is likely due to shoppers putting off their mall trips and instead choosing superstores and specialty retailers such as party supply stores and liquor shops for their holiday prep. Stores hoping to avoid the Halloween dip may want to offer special promotions around the day – and managers can also use this information to optimize their staffing schedules on October 31st.
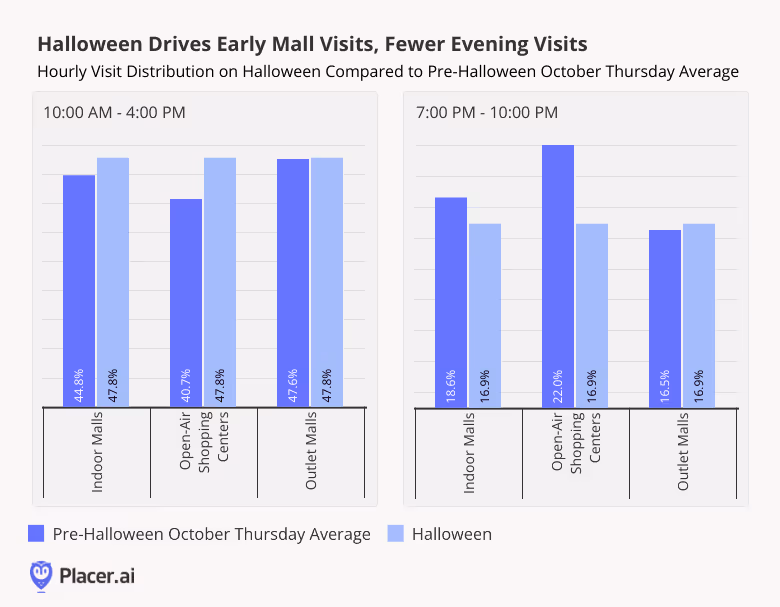
Shoppers Shop Early on Halloween
Diving into hourly visit distributions provides even more data for those looking to optimize store performance. On Halloween, indoor malls and open-air shopping centers received a larger share of their visits before 4:00 PM and relatively fewer visits in the evening when compared to an average Thursday in October. So while some consumers did come out to malls in the morning, by evening, many shoppers may have been too busy scrambling to complete their Halloween costume or stock up on candy for the evening. Meanwhile, the Halloween dip in visits to outlet malls appears to have been evenly spaced throughout the day, with hourly visit shares on October 31st closely matching the average Thursday visit distribution patterns.
Store managers operating in indoor malls or open-air shopping centers may use this data to optimize staffing for the afternoon and evening Halloween shifts, while those working at outlet malls may want to reconsider their manpower needs for the day as a whole. At the same time, those looking to draw in more foot traffic may try offering promotions that appeal to early birds or trick-or-treaters.
With October in the rearview mirror, the holiday season is kicking off. How will malls perform?
Visit placer.ai to find out.

Every year towards the end of October, consumers head to the shops for costumes, spooky yard decorations, candy and Halloween supplies. At the same time, many national dining chains roll out Halloween-themed limited time offers (LTOs) to lure in revelers. So what was this year’s Halloween impact on retail and dining visits? We dove into the data to find out.
Retail for Halloween Prep, Dining for Holiday Fun
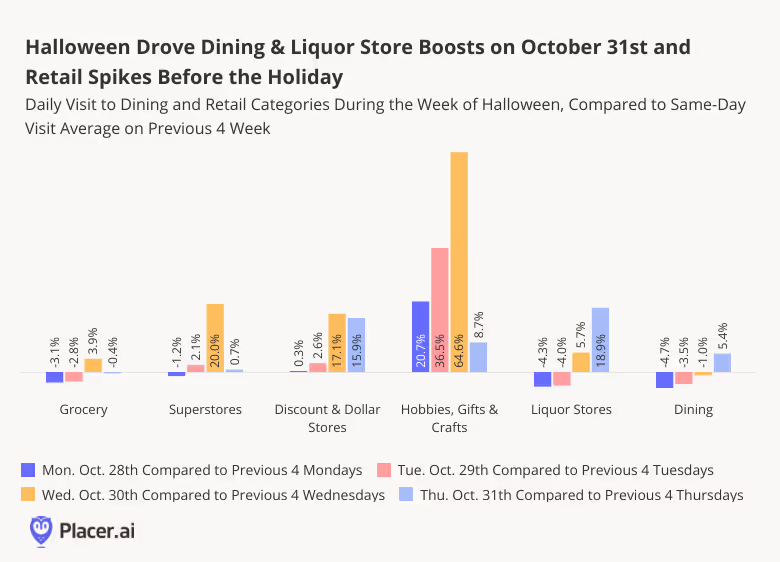
Halloween may not be Black Friday, but the ghostly holiday drives significant dining and retail visit spikes of its own. Comparing daily visit patterns during the week of Halloween to previous weeks’ averages reveals Halloween’s varied impact on the different brick-and-mortar sectors.
For most retail sectors – including grocery stores, superstores, discount & dollar stores, and hobbies, gift & craft stores – holiday visits peaked on October 30th, as consumers got their Halloween supplies before the holiday. Hobbies, gift & craft stores saw the biggest visit increases, with traffic on Monday, October 28th already up 20.7% compared to the average for the previous four Mondays, as patrons sought out the perfect costume piece or yard decoration. Meanwhile, liquor stores – where visits also increased the day before Halloween – got an even bigger boost on October 31st, likely thanks to party hosts and guests grabbing last minute refreshments ahead of the night’s festivities.
Unlike in the retail space, where visits increased prior to the holiday, the Halloween-driven dining visit spike was confined to October 31st. Dining visits on Halloween were up 5.4% compared to the previous four Thursdays’ average – impressive for a category not traditionally associated with Halloween spending. This spike was likely fueled by the many Halloween-themed LTOs across the category.
LTOs Drive Halloween Dining Spikes
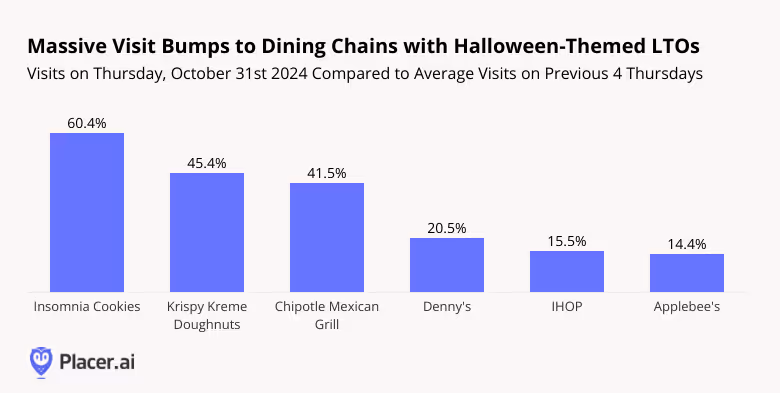
Indeed, many of the major dining chains that saw double-digit visit spikes on October 31st offered Halloween-related promotions. Insomnia Cookies gave away cookies and Krispy Kreme Doughnuts offered free donuts to customers who came in wearing costumes – and visits to the two chains jumped 60.4% and 45.4%, respectively, compared to the average of the previous four Thursdays. And the promise of discounts was almost as alluring as the promise of free stuff – Chipotle offered a deeply discounted entree to any Chipotle Rewards member coming in costume, leading to a 41.5% boost in Halloween foot traffic.
Full-service restaurants also got in on the Halloween action. Denny’s customers who dined on-site donning a costume received free Halloween pancakes, helping drive a 20.5% increase in Thursday visits on October 31st. IHOP, which offered a free “Scary Face Pancake” for kids 12 and under with the purchase of an adult entree, saw its visits rise 15.5% compared to its recent Thursday average. And Applebee’s “Dollar Zombie” cocktail – available throughout the month of October – may have contributed to the 14.4% Halloween visit increase from customers looking to consume the themed drink during the holiday.
Superstores for pre-Halloween Prep, Dollar & Discount Stores for Last Minute Touches
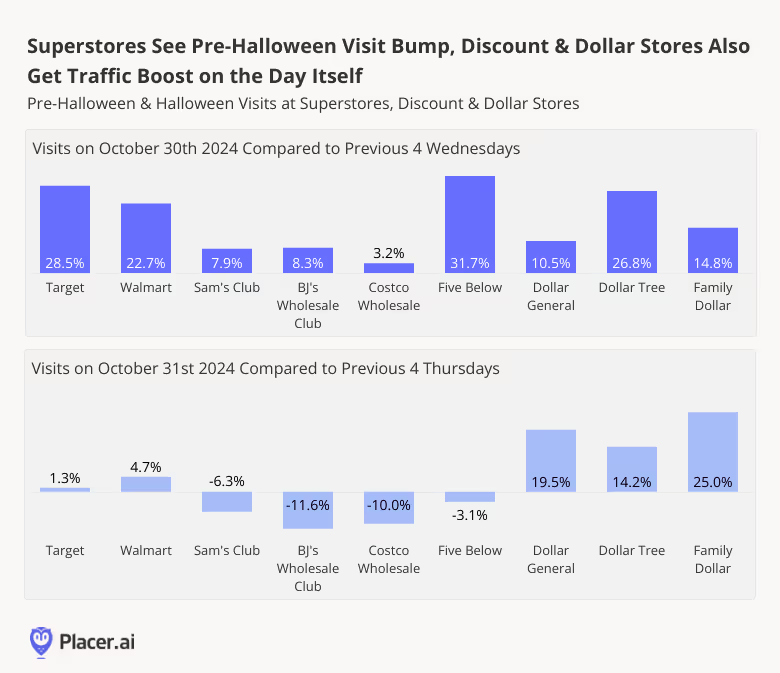
Halloween prep often requires a trip to the store – so unlike dining chains, where traffic peaked on Halloween itself, most retail sectors received the largest holiday-driven boost on October 30th. Visits to Target, Walmart, Sam’s Club, BJ’s Wholesale Club, and Costco Wholesale were up on Wednesday, October 30th compared to a recent Wednesday average – but by October 31st, foot traffic was mostly back to normal (although Walmart visits were still slightly elevated).
Meanwhile, discount & dollar leaders Dollar General, Dollar Tree, and Family Dollar experienced foot traffic jumps on both October 30th and October 31st – with the Halloween spikes at Dollar General and Family Dollar even surpassing the pre-Halloween boosts at those retailers. These visitation patterns indicate that consumers likely visit both superstores and dollar stores for pre-Holiday prep but are more likely to head to discount & dollar chains for last minute Halloween purchases.
Party City Receives Largest Pre-Halloween Visit Boost
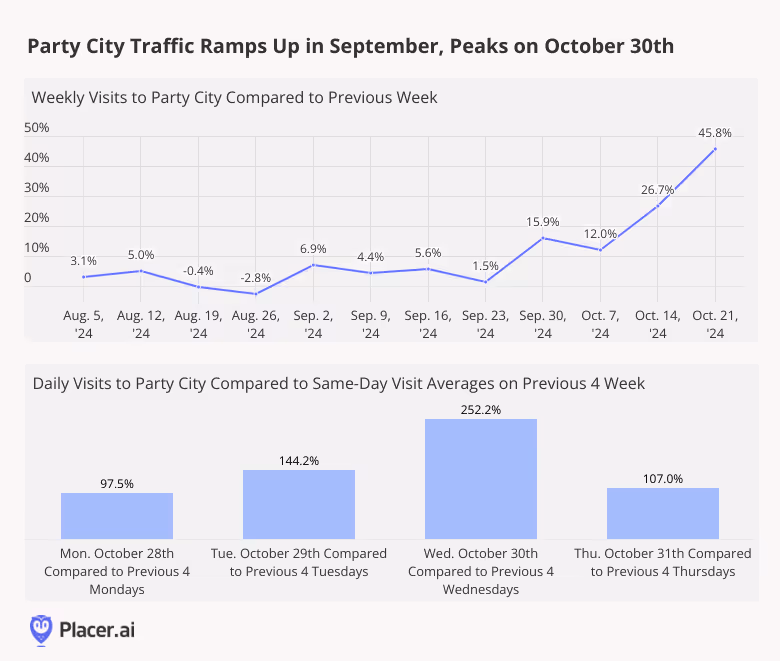
While superstores and discount & dollar stores receive a significant share of Halloween-driven retail foot traffic, the biggest beneficiaries of the season appear to have been party supply stores – with Party City in the lead. Visits to the retailer began steadily increasing week-over-week in the beginning of September, with Wednesday, October 30th seeing a whopping 252.2% increase in visits compared to the average on the previous four Wednesdays.
Party City’s Halloween success indicates that, when it comes to special occasions, specialized retailers still play an important role in the brick-and-mortar retail landscape.
Halloween brought consumers out to stores and restaurants, highlighting an appetite for celebrating special occasions which may bode well for the upcoming holiday season. How will the rest of Q4’s retail milestones perform?
Follow Placer.ai’s data-driven retail analyses to find out.

We looked at nationwide and regional visitation patterns for CAVA to understand how the fast-growing fast-casual chain is performing across its major markets.
CAVA’s Expansion Driving Visit Growth
CAVA – which operated a little over 300 locations by the end of 2023 – is growing rapidly, with plans to reach 1,000 locations by 2032. The chain has seen consistent year-over-year (YoY) visit growth in most of its major markets, with a 23.6% YoY overall increase in nationwide visits in Q1 2024 – in large part due to its ongoing expansion.

CAVA is headquartered in Washington, D.C., and currently, most of its venues are located in the mid-Atlantic and southeastern United States. But the chain also has a strong presence in Texas and California and operates restaurants in a handful of additional states. Recently, CAVA entered the Midwest with its first Chicago location – and has plans to extend its reach even further. So what do CAVA’s various markets have in common – and what sets them apart?
CAVA Attracts Affluent Diners Across Its Major Markets
Nationwide, the median household income (HHI) in CAVA’s captured market trade area is higher than the US median HHI – and diving into the regional markets indicates that this trend persists across regional markets.
In most states with a major CAVA presence – including Texas, Virginia, California, North Carolina, Georgia, and Maryland – the median HHI in CAVA’s trade area is 11% to 24% higher than the statewide median. Even in Florida, where the chain’s trade area HHI is closest to the statewide median, households in CAVA’s captured market are still slightly more affluent than in Florida as a whole.

Differences in Dining Habits
But while the chain seems to attract a similar demographic across states, diving into the hourly visitation patterns in CAVA’s various markets indicates that dining habits differ between regions.
In Texas, Georgia, Florida, and North Carolina, the share of 11:00 AM - 10:00 PM CAVA visits taking place during the lunchtime daypart (11:00 AM - 2:00 PM) ranges from 35.5% to 36.9% – at or above the nationwide average of 35.4%. But in Virginia and Maryland, and especially California, the lunchtime rush is more subdued. In these states, the afternoon and evening dayparts tend to be busier than in the other analyzed states – with California in particular seeing 35.7% of visits taking place between 6:00 PM and 10:00 PM.

CAVA’s Path to Nationwide Ubiquity
Identifying similarities and differences between the visitor bases in CAVA’s various markets can help the company identify ideal locations, optimize staffing needs, and tailor promotional efforts as it continues to enter new markets and open additional restaurants in existing ones.
For more data-driven dining insights, visit placer.ai/blog.

As visits to Superstores continue to rise, we analyzed recent foot traffic data for Walmart, Target, Costco Wholesale, Sam’s Club, and BJ’s Wholesale Club and dove into Walmart’s Q1 2024 regional performance.
Wholesale Club Lead Visit Growth, but Classic Superstores Maintain Overall Visit Edge
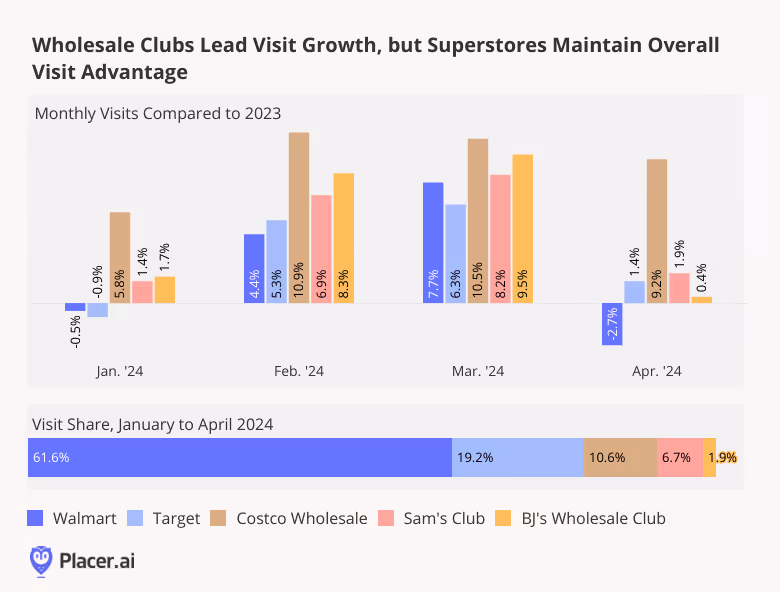
Wholesale chains – which receive about 20% of all visits to Walmart, Target, Costco Wholesale, Sam’s Club (owned by Walmart), and BJ’s Wholesale Club – generally outperformed classic superstore banners Target and Walmart during the first four months of the year. Visits to all three wholesale clubs analyzed were up every month on a year-over-year (YoY) basis, with Costco maintaining its lead in the space. Some of the success of wholesale clubs may be due to the makeup of their visitor base – Costco, Sam’s Club, and BJ’s tend to serve a large share of consumers from family households, and these may be opting for more buying in bulk in an effort to stretch budgets.
But visits to more classic superstores are also heating up – following a muted performance in January, when an arctic blast kept many at home, foot traffic to Target grew YoY in February, March, and April.
Walmart also experienced visit growth for most of the period, despite the slight dip in April due to calendar shifts: Visits for the superstore giant dropped 8.5% in YoY for the week of April 1st - 8th 2024 compared to the traffic surges of Easter week 2023 (April 3rd - 9th 2023), impacting the overall monthly numbers, but visits returned to growth during the last two weeks of April (4.3% and 4.0% YoY, respectively, for the weeks of April 15th - 21st and 22nd -28th).
Diving into Walmart
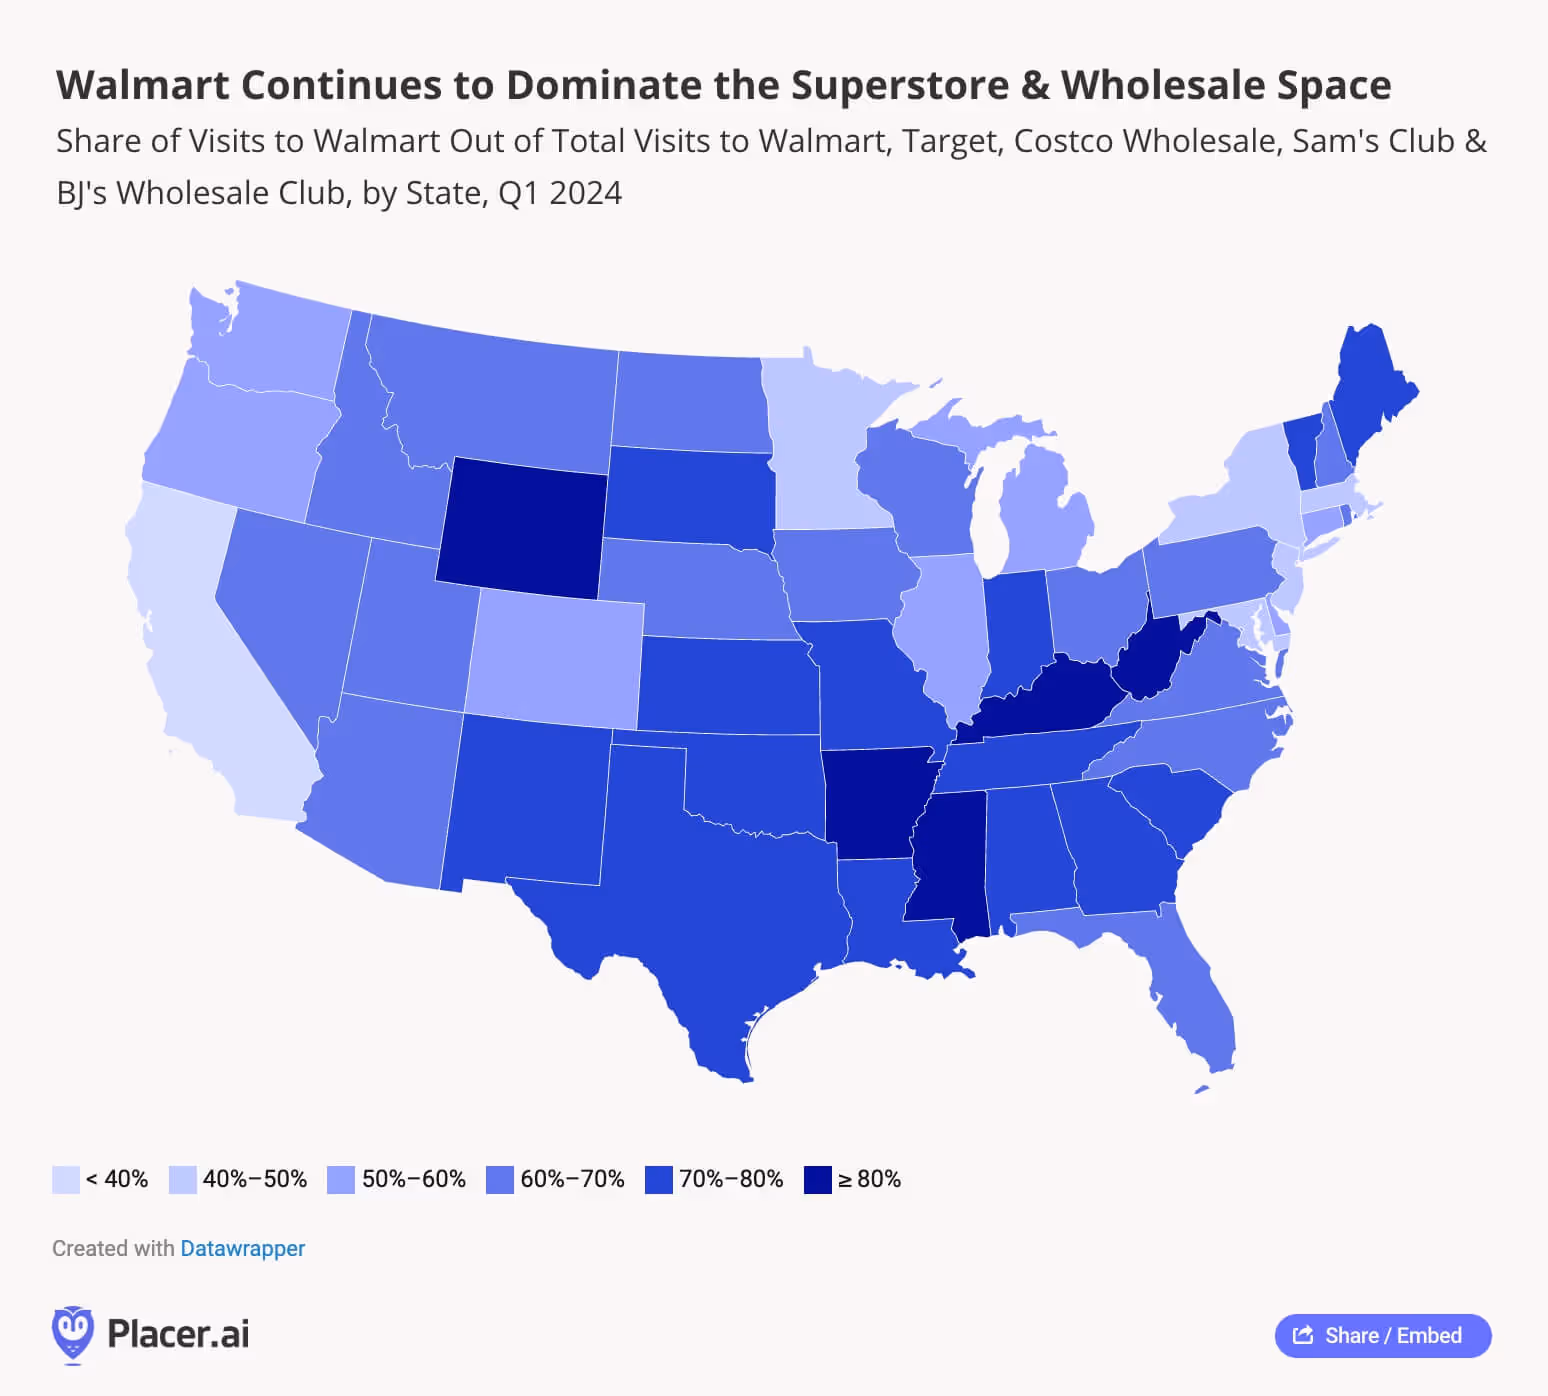
And while Walmart’s growth may not be quite as impressive as that of smaller superstores, the company has retained its position as the largest retailer in the U.S. Nationwide, the Walmart banner receives over 60% of all visits to Target, Walmart, Costco, Sam’s Club, and BJ’s, and in most of the south, the superstore’s relative visit share exceeds 70%. In a handful of states – including the retailer’s home state of Arkansas along with Mississippi, Kentucky, West Virginia, and Wyoming – 4 out of every 5 visits to the five superstore chains analyzed go to Walmart.
Walmart’s Potential to Grow Even Larger
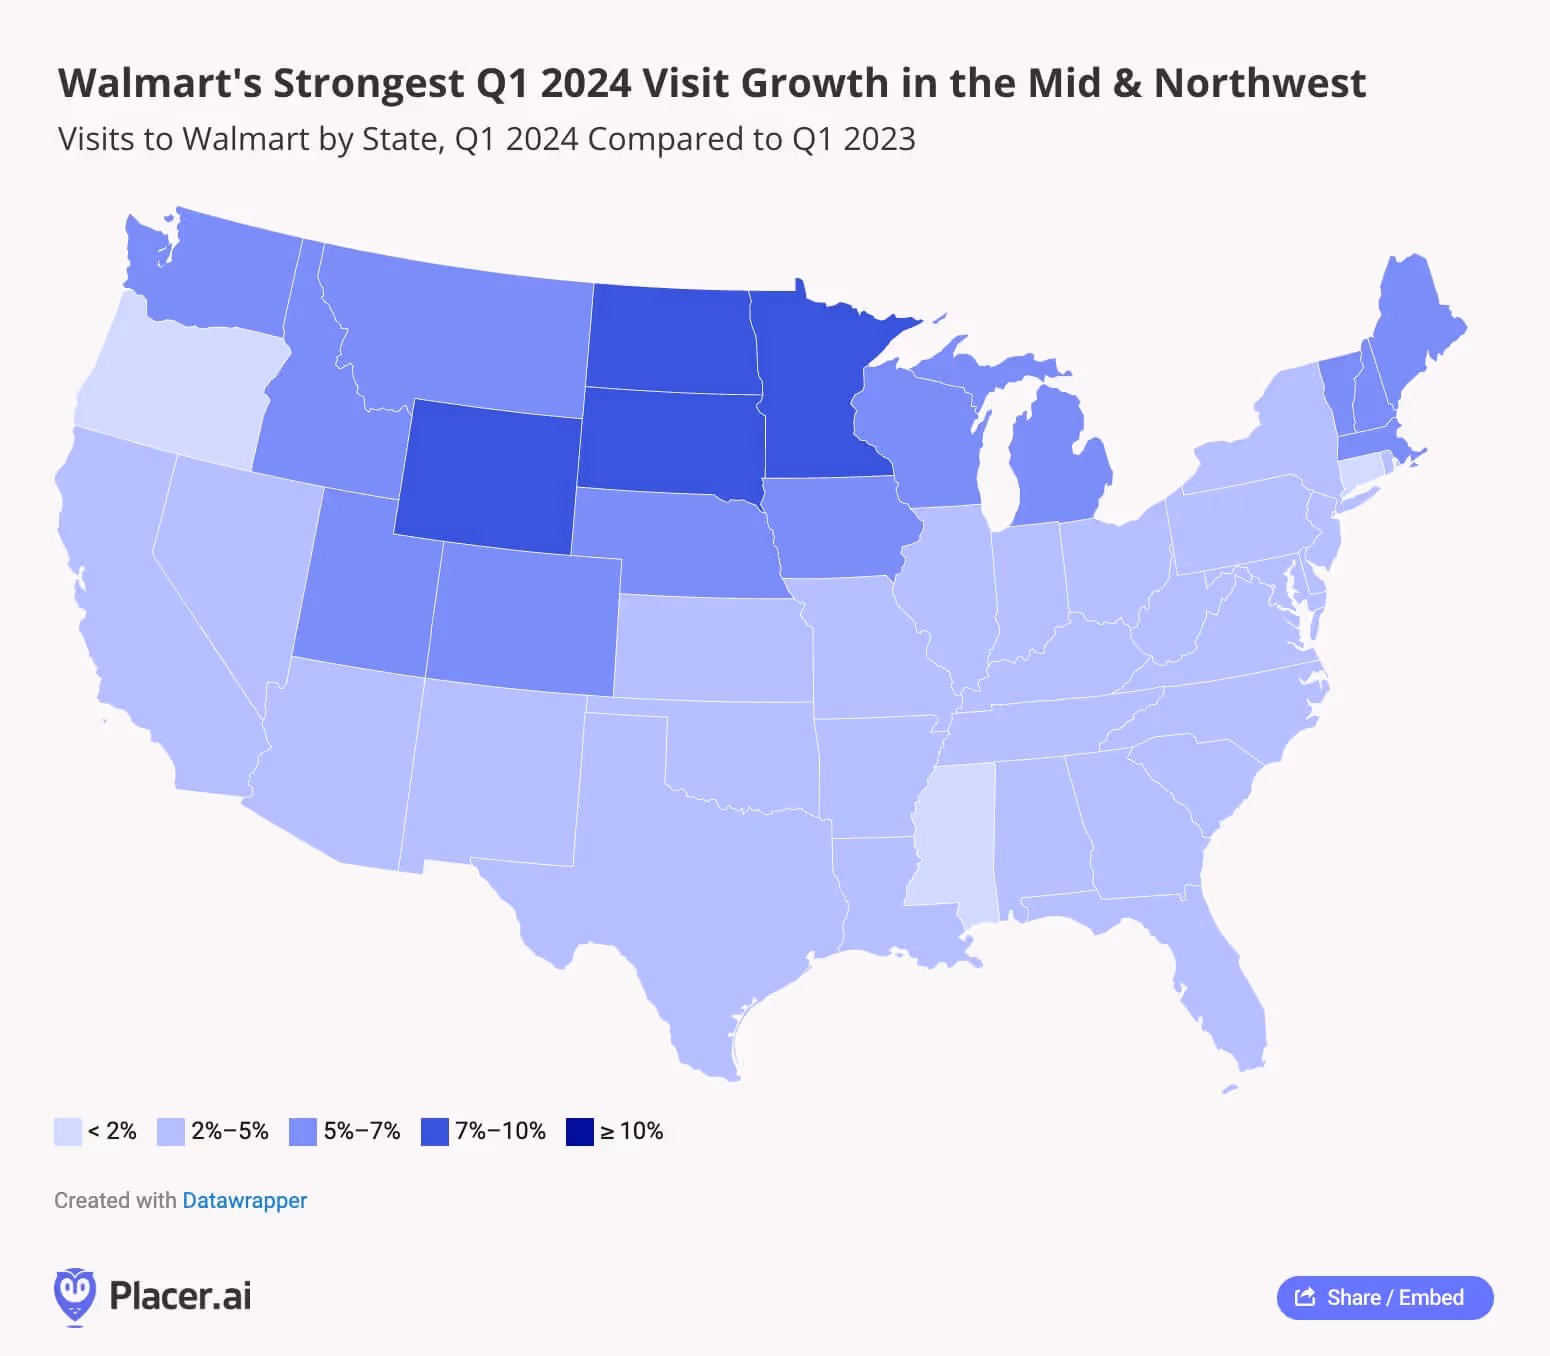
And even as Walmart optimizes its fleet, analyzing the retailer’s Q1 2024 YoY visit increases by region reveals pockets of major growth throughout the country. In addition to the 2-5% traffic increases across most of the South – where the retailer already dominates the superstore space – Walmart is also posting impressive visit increases in the Northeast, Midwest, and Northwest, with the strongest growth in Minnesota, Wyoming, and the Dakotas.
As budget-strapped consumers continue looking for bargains, the legacy retail giant may still have room to grow even larger in 2024.
Superstores Set to Maintain Their Momentum in 2024
Superstore and wholesale club visits are on the rise as U.S. shoppers continue to defy predictions of a consumer spending slowdown while still looking for ways to stretch their budgets.
Will these trends continue as the year progresses?
Visit placer.ai to find out.
.avif)
Discount & Dollar Stores have become an important part of the wider retail landscape over the past couple of years, and location intelligence indicates that the category is continuing to gain momentum in 2024. We dove into the data for Dollar General, Dollar Tree, and Family Dollar to understand how these banners are performing and analyze the regional reach of each chain.
Dollar Stores Still on the Rise
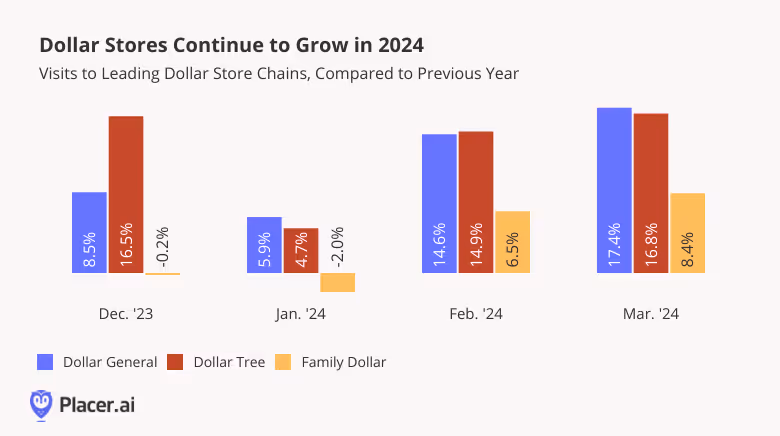
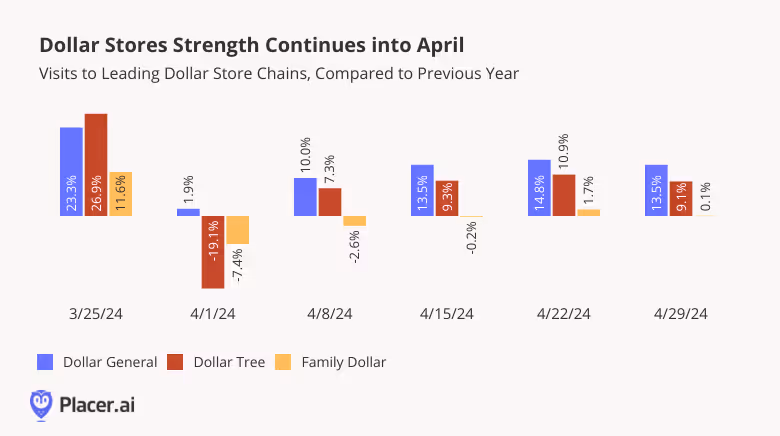
Recent visitation data for the major Discount & Dollar Store banners indicates that the category is still on the rise: Monthly visits to both Dollar General and Dollar Tree grew year-over-year (YoY) between December 2023 and March 2024. Dollar Tree-owned Family Dollar – which recently announced the closure of 1000 stores over the next couple of years – also saw its YoY traffic grow in February and March.
April Data Continues to Show Category’s Growth Potential
With the exception of the week of April 1st 2024 – when the Easter calendar shift caused a regular week in 2024 to be compared to the week of Easter in 2023 – visitation trends remained positive in April, highlighting the ongoing strength of the Discount & Dollar Store category. Even Family Dollar – which has already begun to close stores – saw its numbers remain on par with last year’s visit levels, indicating the ongoing demand for value-priced goods in 2024.
Regional Variations in Dollar Store Preferences
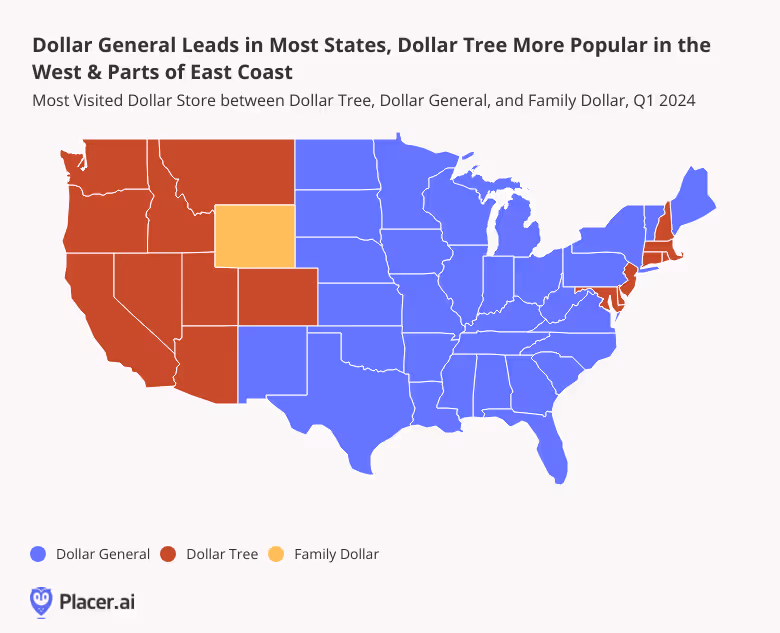
Looking at the Q1 2024 state-by-state relative visit share of the three chains – Dollar General, Dollar Tree, or Family Dollar – reveals some clear regional differences in consumer preferences across states.
Dollar Tree was more popular in the West, with the Dollar Tree brand leading in most western states and the company’s Family Dollar banner receiving the plurality of visits in Wyoming. Dollar Tree was also the most-visited chain in several states on the East Coast, including Maryland, New Jersey, Connecticut, and Massachusetts.
Dollar General, meanwhile, received the majority or plurality of the visit share in the rest of the country.
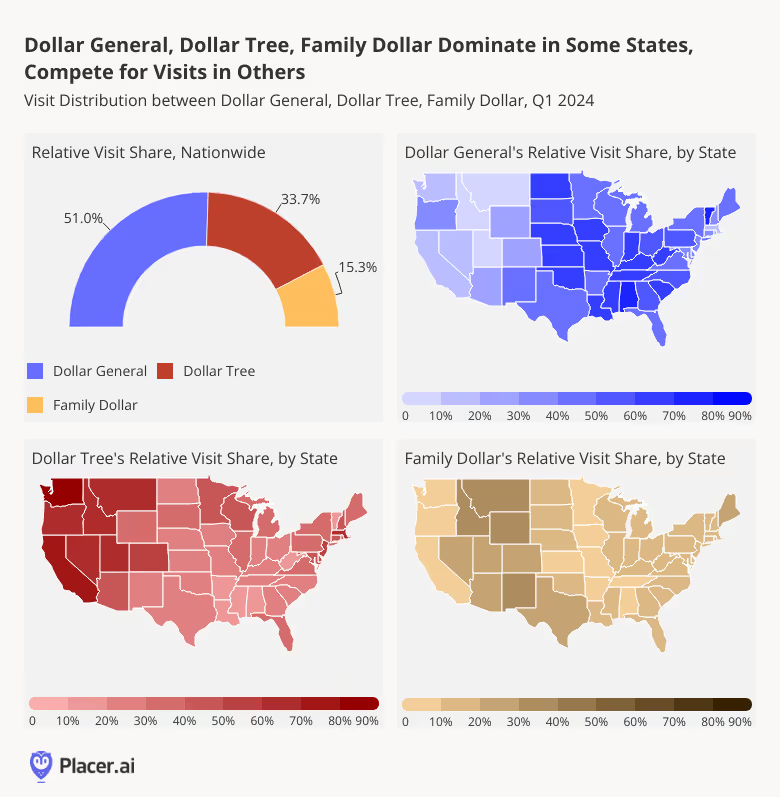
Room for Multiple Strong Players in Discount & Dollar Store Space
But although Dollar General does receive a majority of the combined Dollar General, Dollar Tree, and Family Dollar visit share nationwide, the Discount & Dollar Store category does not conform to a “winner-take-all” model. In many states, Dollar Tree’s visit share is just slightly lower than that of Dollar General.
In New York, for example, where Dollar General received 44.6% of the combined visit share in Q1 2024, 38.1% of visits in the same period went to Dollar Tree. And in Florida, where 44.2% of the combined visits to the three banners went to Dollar General, 38.2% of visits went to Dollar Tree. It seems, then, that even in states where Dollar General takes the lead, there is plenty of Discount & Dollar Store demand to sustain multiple players in the space.
Early 2024 data suggests that the Discount & Dollar Store sector is not slowing down any time soon. What will the rest of the year have in store for the space?
Visit placer.ai to find out.
Wingstop and Shake Shack are on a roll. We dove into recent location intelligence data to understand what is driving success at these two dining leaders.
Key Insights:
- Wingstop and Shake Shack are consistently outperforming the Fast Casual segment, with some of the visit increases driven by the chains’ aggressive expansion.
- Visits to Wingstop and Shake Shack tend to be more leisurely than visits to the wider Fast Casual segments, which may be contributing to the chains’ strong performances.
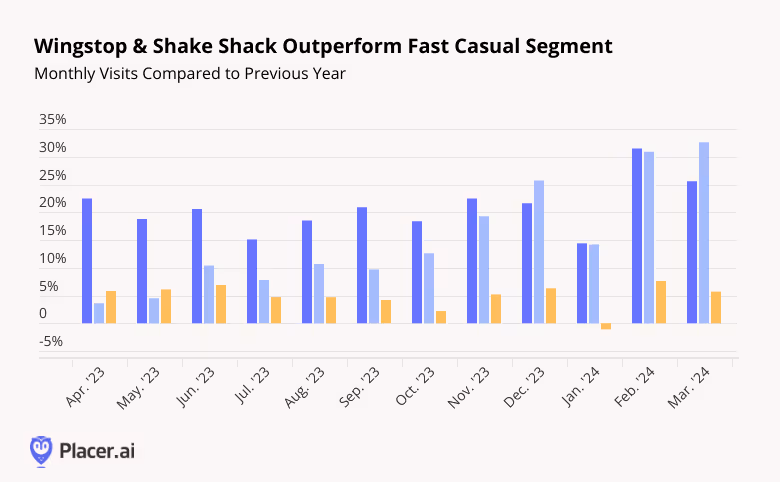
Wingstop and Shake Shack Stay Ahead of the Curve
Texas-based Wingstop and New York-based Shake Shack are growing fast. Over the past twelve months, both chains outperformed the fast casual segment and posted impressive traffic increases – in March 2024, visits to Wingstop and Shake Shack were up 25.6% and 32.6%, respectively, compared to March 2023.
Some of the visit strength is likely driven by the chains’ recent expansion. Last year, Wingstop opened around 200 of its almost 2000 U.S. locations, while Shake Shack opened around 40 new restaurants domestically for a total of more than 300 locations in December 2023.
Wingstop & Shake Shack Diners Seek Leisurely Dining Experience
A rapidly expanding footprint is not the only factor driving success for these fast casual leaders. Location intelligence suggests that both chains attract visitors looking for a more leisurely dining experience, which could be helping Wingstop and Shake Shack stay ahead of the competition.
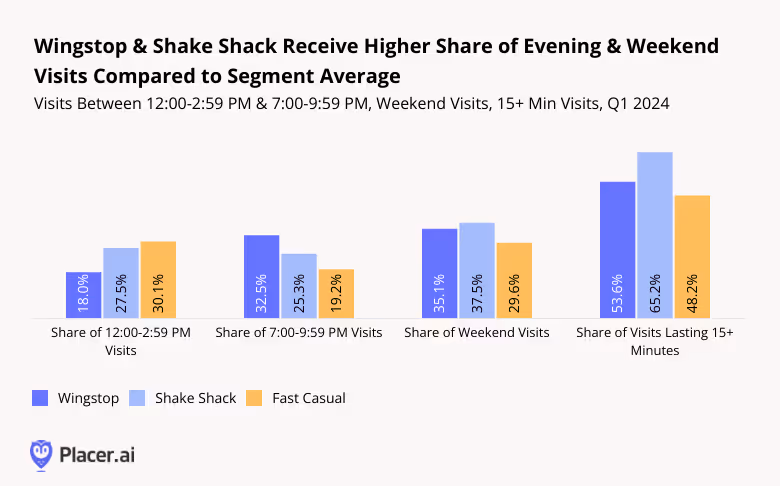
Compared to the average fast-casual dining venue, Wingstop and Shake Shack receive fewer visits during the lunch rush (12:00 to 2:59 PM) when diners are looking for a quick bite to eat before returning to work. Instead, the two chains attract a larger share of visits in the evening hours (between 7:00 and 9:59 PM) – when guests tend to have more time to savor their meals. Both chains also receive a relatively sizable portion of their visits on weekends, when patrons have more time to linger on premises.
And the data indicates that Shake Shack and Wingstop visitors do indeed linger longer than the average fast casual patron: Over half of visits to Wingstop and almost two-thirds of Shake Shack visits last longer than 15 minutes, compared to just 48.2% of visits lasting 15+ minutes for the wider fast casual segment.
It seems, then, that consumers are not just visiting Shake Shack or Wingstop for a burger and shake combo or a platter of steaming wings. The data suggests that many guests are also visiting these chains during more leisurely times when they can focus on the dining experience and take in the chains’ atmosphere.
As the companies continue to expand into new markets and deepen their reach in existing ones, the willingness of consumers to dedicate evenings and weekends to eating at Shake Shack and Wingstop bodes well for these chains in 2024 – and beyond.
For more data-driven dining insights, visit placer.ai/blog.

