


.svg)


The Placer 100 Index for Retail & Dining is a curated, dynamic list of leading chains operating across the United States. It includes chains from a variety of industries, such as superstores, grocery, dollar stores, apparel, full-service dining, QSR, and more.
Consumer Traffic Remains Resilient
Visits to the Placer 100 Retail & Dining Index increased 3.7% in January 2025 relative to January 2024, indicating that – despite the recent dip in consumer confidence – traffic to brick-and-mortar retail and dining venues remains resilient.
Chili’s and Barnes & Noble Top the Ranking
We’ve written extensively about Chili’s ongoing success, so it came as no surprise that the casual dining chain topped the Placer 100 chart again in January 2025: Overall visits and visits per location grew a whopping 29.3% and 30.2%, respectively, compared to January 2024. Barnes & Noble has also been thriving for a while, and the legacy bookseller continued its winning streak with double-digit growth in both overall visits and visits per location in the first month of 2025.
Other notable chart-toppers from January 2025 include LA Fitness, which has been rightsizing its fleet and closing locations throughout the country, leading to a 8.1% year-over-year (YoY) increase in average visits per location. CVS, which closed numerous venues in 2024 as well, has also seen its average visits per location shoot up.
Placer 100 January 2025 Spotlight: Warby Parker
Like Chili’s and Barnes & Noble, Warby Parker was among the January 2025 top 10 growth chains for both overall visits and visits per venue. The company is opening stores at a rapid rate with the long-term goal of 900 brick-and-mortar stores nationwide.
Warby is an expert in omnichannel integration, and the company continues to enhance the online customer experience even as it builds up a brick-and-mortar empire. And analyzing the brand’s January 2025 metrics along with its 2024 performance – when overall visits increased 16.8% while average visits per venue remained steady – reveals that this investment in both its physical and digital channels is paying off.
According to co-CEO and co-founder Dave Gilboa, brick-and-mortar venues accounted for around 70% of Warby Parker’s revenue as of Q3 2024 – an increase from 67% in Q3 2023 – though many customers who initially bought in-store made subsequent purchases online. This showcases the customer acquisition potential of physical stores, especially for companies who succeed in integrating and creating synergy between their offline and online presence. And some of Warby’s strongest e-commerce growth has taken place in metro areas where the brand has a significant physical presence – emphasizing the role that brick-and-mortar venues play in raising brand awareness and strengthening consumer engagement.
It seems, then, that Warby Parker's strategic offline expansion is not only driving in-store sales but also fueling online growth – demonstrating the powerful interplay between brick-and-mortar locations and digital engagement in strengthening customer loyalty and brand visibility.
For more Placer 100 Retail & Dining Index data, visit https://www.placer.ai/placer-100.

About the Placer.ai Mall Index: The Index analyzes data from 100 top-tier indoor malls, 100 open-air shopping centers (not including outlet malls) and 100 outlet malls across the country, in both urban and suburban areas. Placer.ai leverages a panel of tens of millions of devices and utilizes machine learning to make estimations for visits to locations across the country.
January Visits Increase Across Mall Formats
Shopping centers started the year off strong with year-over-year growth across all mall formats analyzed: January 2025 visits increased by 5.5% for indoor malls and by 2.9% and 2.7% for open-air shopping centers and outlet malls, respectively, compared to January 2024. The January visit growth is particularly impressive given this year’s arctic blast which kept many consumers home for much of the month.
January Visit Growth Driven By Increase in One-Off Visits
Relatively few mall-goers visit the mall twice (or more) in one month. Open-air shopping centers have the highest rate of returning monthly visitors – likely thanks to their extensive dining and entertainment options – but even this format only sees around a third of its visitors heading to an open-air shopping center more than once a month.
Comparing the share of returning visitors in January 2024 and 2025 for each format reveals that the share of returning (2+ times) visitors decreased YoY in January 2025, even as overall traffic increased. This means that last month’s visit growth was primarily driven by casual visitors, and could indicate that interest in malls is moving beyond regular patrons as the format now gains new customers – boding well for shopping centers’ potential in 2025.
How Does Mall-Based Consumer Behavior Shift During the Holidays?
Even though January visits increased YoY, traffic was still (expectedly) significantly lower than it was in December. The holidays are malls’ busiest season, and traffic between December 2024 and January 2025 dropped 36.1%, on average, across the three formats. And diving into the data reveals several shifts in audience profile and visitor behavior between December and January.
In terms of visitor behavior, dwell time across the three mall formats fell in January compared to December, indicating that all three shopping center types enjoy an increase in both the quantity and the quality of visits over the holiday season. The increase in dwell time in December seemed correlated with the increase in holiday visits: Outlet malls, which received the largest holiday visit boost, also had the biggest difference in dwell time between December and January (73.8 minutes compared to 68.7 minutes, or a 6.9% increase in dwell time in December). Meanwhile, open-air shopping centers, which received the smallest holiday visit boost, also saw the smallest difference in dwell time between December and January.
In terms of audience profile, the holidays seemed to drive more visits from members of households with children to all mall formats. This is likely due to several factors, including parents looking for a one-stop-shop for their gift lists and to the numerous family-friendly holiday activities offered by malls across the country, such as mall Santas and holiday markets.
2025: The Year of the Mall?
The January 2025 Mall Index data suggests significant growth potential for malls in 2025. The increase in one-off visits may indicate that malls are attracting a broader audience, signaling an opportunity for retailers and shopping centers to convert these casual visitors into loyal customers. Will malls leverage this momentum to ensure that today’s occasional mall-goers become tomorrow’s repeat shoppers?
Visit placer.ai to find out.

About the Mall Index: The Index analyzes data from 100 top-tier indoor malls, 100 open-air shopping centers (not including outlet malls) and 100 outlet malls across the country, in both urban and suburban areas. Placer.ai leverages a panel of tens of millions of devices and utilizes machine learning to make estimations for visits to locations across the country.
Strong 2024 for Malls
Malls demonstrated their resilience once again in 2024, will traffic to the three shopping formats essentially on par with 2023 levels despite the ongoing consumer headwinds. Indoor malls and open-air shopping centers even saw slight increases – of 1.5% and 1.7% year-over-year (YoY), respectively – while outlet malls experienced a minimal visit decline of 0.4%.
So although YoY visits dipped at all three mall formats in December 2024 – likely due to the month having one less Saturday than December 2023 – malls appear well positioned going into 2025.
Visit Performance Correlated with Captured Market Income
The 2024 traffic performance of each format may be correlated with the income levels of the format’s visitor base. Open-air shopping centers, which received the largest YoY visit boost, also attracted the most affluent visitors who were likely less impacted by the ongoing consumer headwinds. Meanwhile outlet malls – which saw slight YoY traffic dips – drew visitors from areas with the lowest household income.
Holidays Boost Mall Visits
The holidays are particularly busy for shopping centers as consumers shop Black Friday discounts, meet mall Santas, buy gifts, and hang out with family and friends. But comparing average daily visits between Black Friday (November 11th) and New Years Eve (December 31st) with average daily visits during the rest of the year (January 1st to November 28th) reveals that the holiday boost is not distributed equally across the three mall formats.
Outlet malls received the largest Holiday-driven visit boost and Indoor malls came in at a close second, with visits during the holiday season up 59.3% and 57.0%, respectively. Open-air shopping centers lagged behind the other two formats, with daily visits up just 31.4% compared to the rest of the year.
Diving deeper into the data reveals that weekdays receive the largest lift, with weekday traffic at indoor and outlet malls during the holiday season up 63.0% and 66.4%, respectively, compared to the non-holiday season daily average.
Shoppers Linger Longer over the Holidays
The holidays don’t just drive an increase in traffic – dwell time at malls also tends to be longer between Black Friday and New Years Eve when compared to the rest of the year. Visit length at indoor and outlet malls increased by an average of 4.7 minutes, while dwell time at open-air shopping centers grew by an average of 3.1 minutes.
Looking Ahead to 2025
Malls’ holiday success proves once again that shopping centers continue to play an important role in the wider retail landscape. How will indoor malls, open-air shopping centers, and outlet malls perform in 2025?
Visit placer.ai to find out.

Florida emerged as a domestic relocation hotspot during the pandemic – and analyzing domestic migration trends over the past four years reveals that most newcomers to Florida have stayed in the Sunshine State. We dove into the data to find out just how big a piece of the domestic relocation pie went to Florida – and see where the newcomers came from, where they chose to settle, and which Florida destinations attracted the most affluent new residents.
Florida Received Almost 25% of Intra-State Migration Between 2020 and 2024
Domestic migration picked up over the pandemic, as many Americans liberated from the constraints of in-person work chose to move to areas with more space, a lower cost of living, and better outdoor recreational opportunities.
The map below highlights the states that received net inbound domestic migration between July 2020 and July 2024, with the percentages representing the share of inter-state positive net migration welcomed by each state during the analyzed period.
As the map shows, Florida was one of the major beneficiaries of the recent domestic migration boom. Between July 2020 and July 2024, Florida received 24.7% of positive intra-state migration in the United States. (In other words, 24.7% of inbound net migration to states with overall positive net migration went to Florida.) Texas, another oft-discussed pandemic relocation hub, came in second, receiving a significantly smaller 17.6% of the total inter-state positive net migration pie.
Most Newcomers to Florida Have Stayed in Florida
Most of Florida’s recent population influx dates back to the Covid era – diving deeper into the monthly data reveals that the biggest jump in migration over the past four years took place between late 2020 and early 2022. And although inbound migration slowed somewhat in 2023 and 2024, the Sunshine State’s net migrated percent of population compared to a July 2020 baseline remained steady at about 2.5% to 3.1% (depending on the season). This means that 2.5% to 3.1% of Florida’s residents have moved there over the past four years – indicating that most people who moved to Florida at the height of the pandemic have remained in the Sunshine State.
So where is Florida getting its new residents from?
New York and New Jersey Main Feeder States for Florida Inbound Migration Boom
Analyzing net migration to Florida by state of origin reveals that Florida received net positive migration from most of the country during the analyzed period – but the influx from some states was particularly significant.
The map below charts the share of net migration to and from Florida by state of origin or destination between July 2020 and July 2024. The purple represents states from which Florida received net positive migration – more people moved to Florida from those states than the other way around – and the percentage indicates each state's share of the total net positive migration to Florida. The yellow represents states which received net positive migration from Florida – more people moved to those states from Florida than vice versa – with the percentage showing each state's share of the total net negative migration from Florida.
As the data shows, much domestic migration to the Sunshine State came from the Mid Atlantic region – with relatively expensive New York and New Jersey standing out as the biggest feeder states – as well as from Illinois and California, two more high-cost-of-living states. Illinois and the Mid Atlantic states also tend to have relatively cold winters. Meanwhile, Florida mostly lost residents to neighboring states and to Texas, with a much smaller share of its net negative migration going to Alaska, Michigan, Montana, Wyoming, and the Dakotas.
It is likely, then, that Florida’s affordability and mild winters served as significant migration draws.
Central Florida Receiving the Bulk of Inbound Domestic Migration
People may be moving to Florida from all over the United States. But where are they moving to in the Sunshine State? Mapping domestic migration trends onto Florida’s metro areas reveals that most of the inbound domestic migration is concentrated in Central Florida. Indeed, just three Central Florida metro areas – Tampa-St. Petersburg-Clearwater, Orlando-Kissimmee-Sanford, and Lakeland-Winter Haven – accounted for nearly half (41.5%) of the total net positive migration to Florida during the analyzed period.
Different Central Florida Hubs Play Distinct Roles in Wider Migration Dynamics
Although the Tampa, Orlando, and Lakeland metro areas are contiguous, the demographic profiles of new residents settling in the three CBSAs are quite different. For example, Tampa, which boasts the highest median household income (HHI) of the three metro areas ($65.1K, compared to $61.1K for Orlando and $55.1K for Lakeland), also drew the greatest share of domestic migrants from affluent areas (median HHI > $100K).
Each of the three central Florida CBSAs also attracted newcomers from different areas of the country. Tampa exhibited the most diversity, with its top 5 CBSAs of origins representing under 50% of total net migration to the metro area. Orlando, on the other hand, received almost 50% of its net domestic migration between July 2020 and July 2024 from just two metro areas: New York and Miami. And for Lakeland, over 50% of the inbound net migration came from within the Sunshine State – including 31.6% from the Orlando CBSA and 9.5% from the Tampa metro area.
It is likely, then, that newcomers to Tampa are coming mostly from wealthy areas throughout the country, while Orlando draws slightly less affluent – but still relatively high-income – newcomers from dense urban areas. Meanwhile, Lakeland appears to attract local Floridians who may be looking for a more affordable living situation without moving too far away from their current communities.
Thanks to its mild winters, affordability, and lifestyle appeal, Florida emerged as a major pandemic relocation destination, and recent migration data reveals that many of those who moved in between 2020 and 2024 have stayed in the Sunshine State. In particular, the central Florida hubs of Tampa-St. Petersburg-Clearwater, Orlando-Kissimmee-Sanford, and Lakeland-Winter Haven attracted an outsize share of new Florida residents, with each metro area showcasing unique inbound migration patterns.
What will domestic migration patterns look like in 2025?
Visit Placer.ai to find out.

About the Placer 100 Index for Retail & Dining: The Placer 100 Index for Retail and Dining is a curated, dynamic list of leading chains that often serve as prime tenants for shopping centers and malls. The index includes chains from various industries, such as superstores, grocery, dollar stores, dining, apparel, and more. Among the notable chains featured are Walmart, Target, Costco, Kroger, Ulta Beauty, The Home Depot, McDonald’s, Chipotle, Crunch Fitness, and Trader Joe's. The goal of the list is to provide insight into the wider trends impacting the retail, dining and shopping center segments.
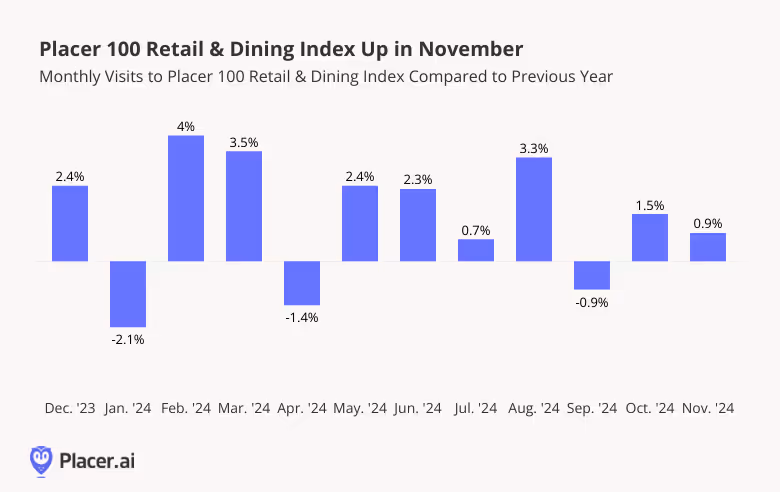
November Visit Growth
October’s positive visitation trends continued in November, with overall visits to the Placer 100 Retail & Dining Index up 0.9% year-over-year (YoY) – a strong start to the holiday season.
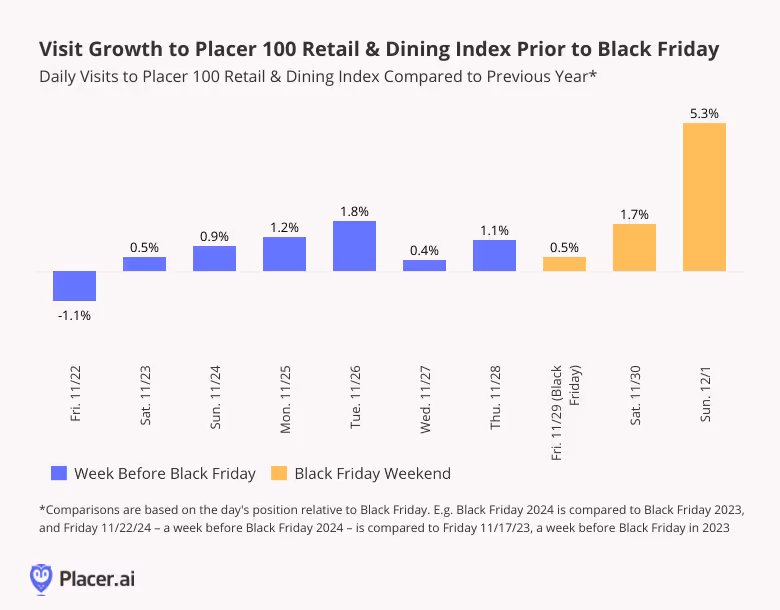
Black Friday Performance
Some of the November uptick was likely driven by Black Friday – visits to the Placer 100 Index were up 2.2% YoY overall for Black Friday Weekend 2024, with Sunday seeing a particularly pronounced visit spike of 5.3%.
And zooming out to the week before Black Friday reveals that the visit boost started even earlier – YoY visits increased as early as the Saturday before Thanksgiving, with traffic remaining positive throughout the week leading up to the retail milestone. The early growth in visits highlights the success of early promotions in driving visits this year.
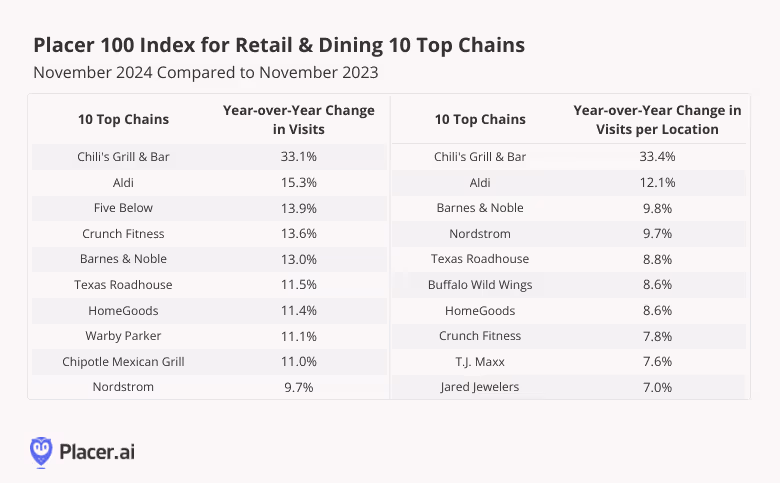
Placer 100 November 2024 Winners
Once again, Chili’s Grill & Bar topped the Placer 100 Index, likely thanks to the ongoing popularity of the chain’s Big Smash Burger, 3 For Me value meal, and Triple Dipper offering. The chain’s even more remarkable visit growth in November was likely also due to Chili’s free Veteran’s Day meals to veterans and active duty personnel, which generated a 135.4% increase in visits on Monday, November 11th relative to the previous three Mondays’ average.
November’s Placer 100 Index winners also included several value-driven chains – such as Aldi’s, HomeGoods, and Crunch Fitness – as well luxury brands such as Nordstrom and Jared Jewelers – perhaps a testament to the still bifurcated consumer market.
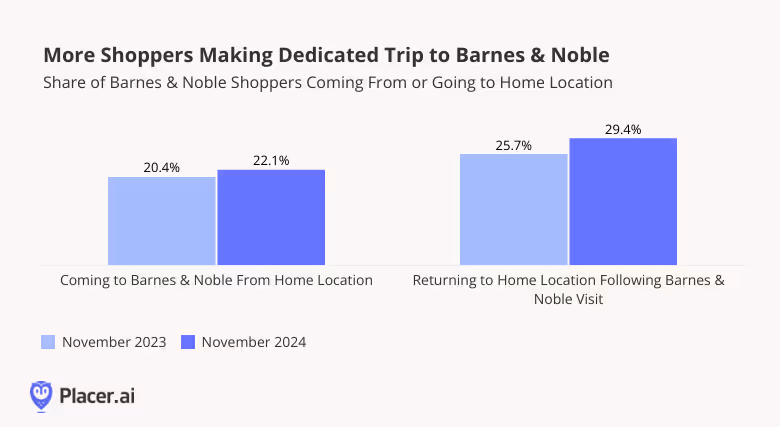
Placer 100 November 2024 Spotlight: Barnes & Noble
Barnes & Noble also made the November 2024 top 10 list, with 13.0% overall visit growth and 9.8% more visits per location, on average, than in November 2023. The legacy book retailer, on an upward trajectory since 2021, has gained significant momentum this year – and the strong November numbers indicate that the company is headed into a promising holiday season.
The chain is seeing more than just impressive visit growth – since November 2023, the share of visitors coming to Barnes & Noble from their home location or headed straight home after a trip to the book retailer has also grown. This visitation pattern suggests that Barnes & Noble is becoming a primary destination for consumers rather than an incidental stop on the way to or from another errand – underscoring the chain’s restored relevance in the wider retail landscape.
Who will dominate the holiday season and top the Placer.ai 100 Retail & Dining Index in December 2024?
Visit placer.ai to find out.

Malls Bounce Back
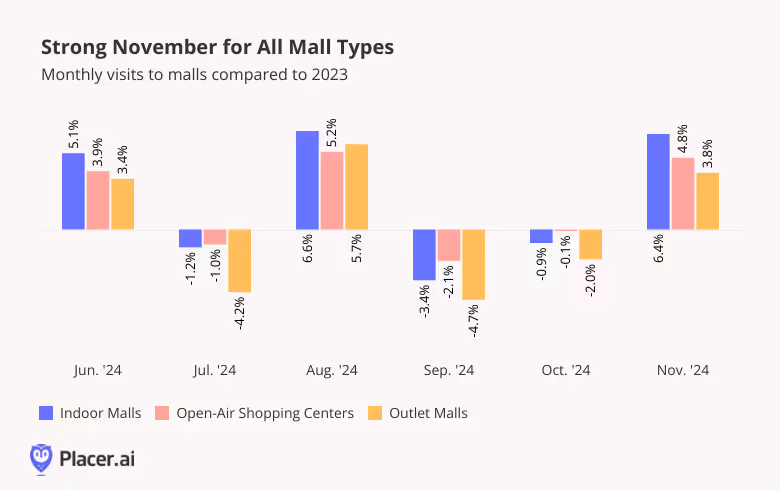
Following weaker foot traffic performances in September and October, mall visits swung positive in November: Indoor malls, open-air shopping centers, and outlet malls received year-over-year (YoY) visit boosts of 6.4%, 4.8%, and 3.8%, respectively. The strong YoY growth across all mall types underscores the continued attraction of brick-and-mortar retail – particularly during the holiday season.
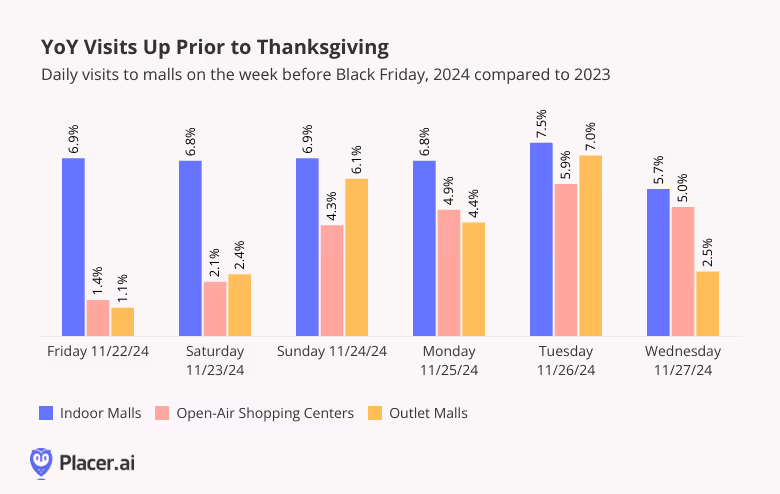
Malls Drive Early Holiday Visits
While much of the November boost is likely due to the malls’ strong Black Friday performance, foot traffic data indicates that early deals also drove visits before the big day: Comparing daily visits during the week before Black Friday (from Friday November 22nd to Wednesday November 27th) to visits during the equivalent days in 2023 (November 17th to 22nd 2023) reveals that malls received more pre-Black Friday mall visits this year than in 2023.
This willingness to shop ahead of Black Friday instead of waiting for the best deals on the day itself may highlight the effectiveness of retailers’ early promotions– or it could signal the readiness of some consumers to spend more freely this holiday season.
Strong Black Friday Performance
Still, despite the positive pre-Black Friday showing, the majority of the November visit boost can likely be attributed to malls’ impressive Black Friday Performance. All three formats saw YoY visit growth over Black Friday weekend, with open-air shopping centers seeing the largest visit increases – foot traffic for this sub-category was up 6.0% compared to Black Friday weekend 2023. In fact, this year’s Black Friday numbers were so strong that visits to indoor malls and open-air shopping centers even exceeded pre-pandemic Black Friday weekend.
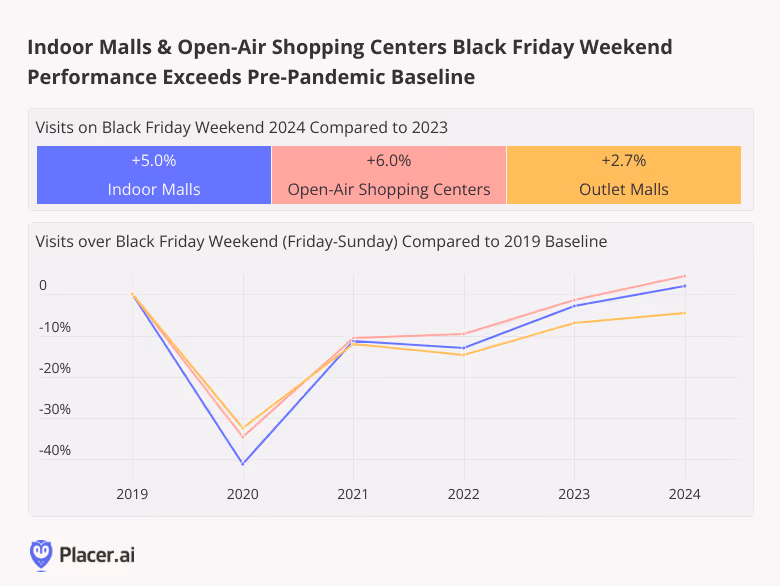
These numbers reveal that, despite the rise in early Black Friday deals and online shopping, many consumers still want to experience the excitement of Black Friday bargain hunting in person. And this powerful kickoff to the 2024 holiday season indicates that the unique experiential offering of malls – combining shopping, dining, and entertainment all under one roof – continue to play a central role in the wider retail landscape.
For more data-driven retail insights, visit placer.ai.

