


.svg)


June 16th, 2024 was Father’s Day – and sons and daughters nationwide took the opportunity to show their dad some appreciation. But how did Father’s Day retail and dining foot traffic compare to that of Mother’s Day?
We dove into the data to find out.
A (More Muted) Hallmark Visit Bump
Last month, we observed that though Mother’s Day wasn’t actually created by the greeting card industry, the holiday is one of Hallmark’s busiest days of the year.
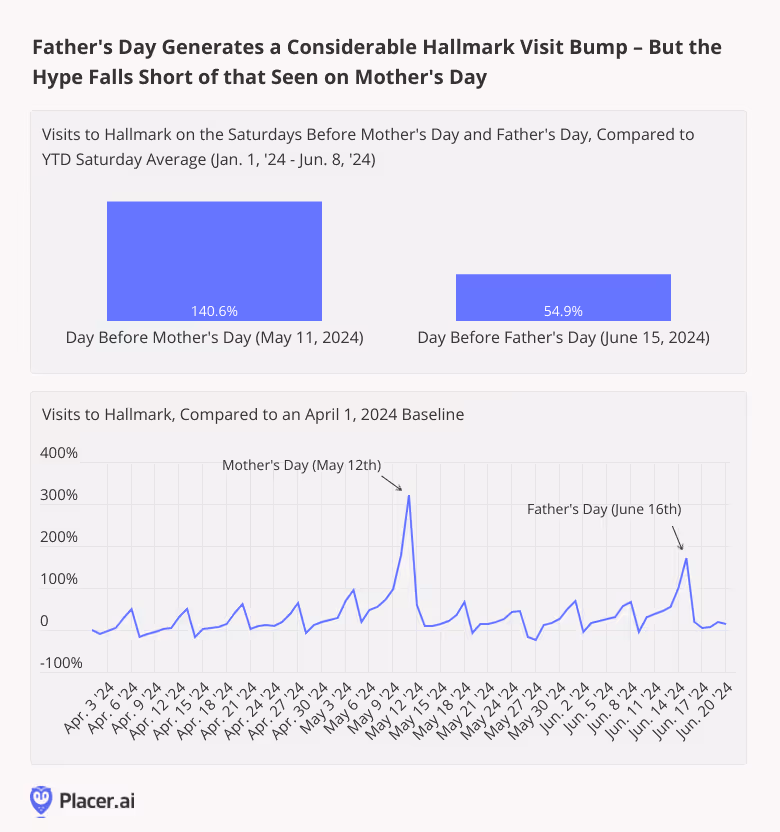
And foot traffic analytics show that Father’s Day isn’t far behind. On June 15th, 2024 (the Saturday before Father’s Day), Hallmark stores drew 54.9% more visits than on an average year-to-date (YTD) Saturday – making it the company’s third-busiest day of the year so far. Only May 10th and May 11th, the days before Mother’s Day, drew bigger crowds to the greeting card chain.
Sporting Goods (Finally!) Score a Win
And a look at visits to major industries that are top picks for dads shows that a variety of segments enjoyed visit boosts in the run-up to Father’s Day – though for most categories, the magnitude of the bump was considerably smaller than that seen before Mother’s Day.
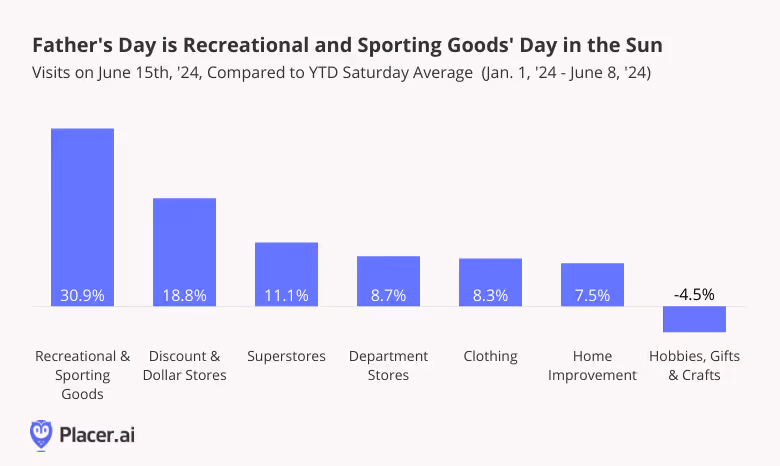
But for one category in particular – recreational and sporting goods – it was the day before Father’s Day that was the bigger deal. On June 15th, 2024, visits to these retailers jumped 30.9% compared to an average YTD Sunday – making them the biggest beneficiaries of dad’s special occasion. Hobbies, crafts, & gift stores, on the other hand – which saw a substantial visit boost in the lead-up to Mother’s Day – experienced a drop in foot traffic.
Grabbing a Bite to Eat With Dad
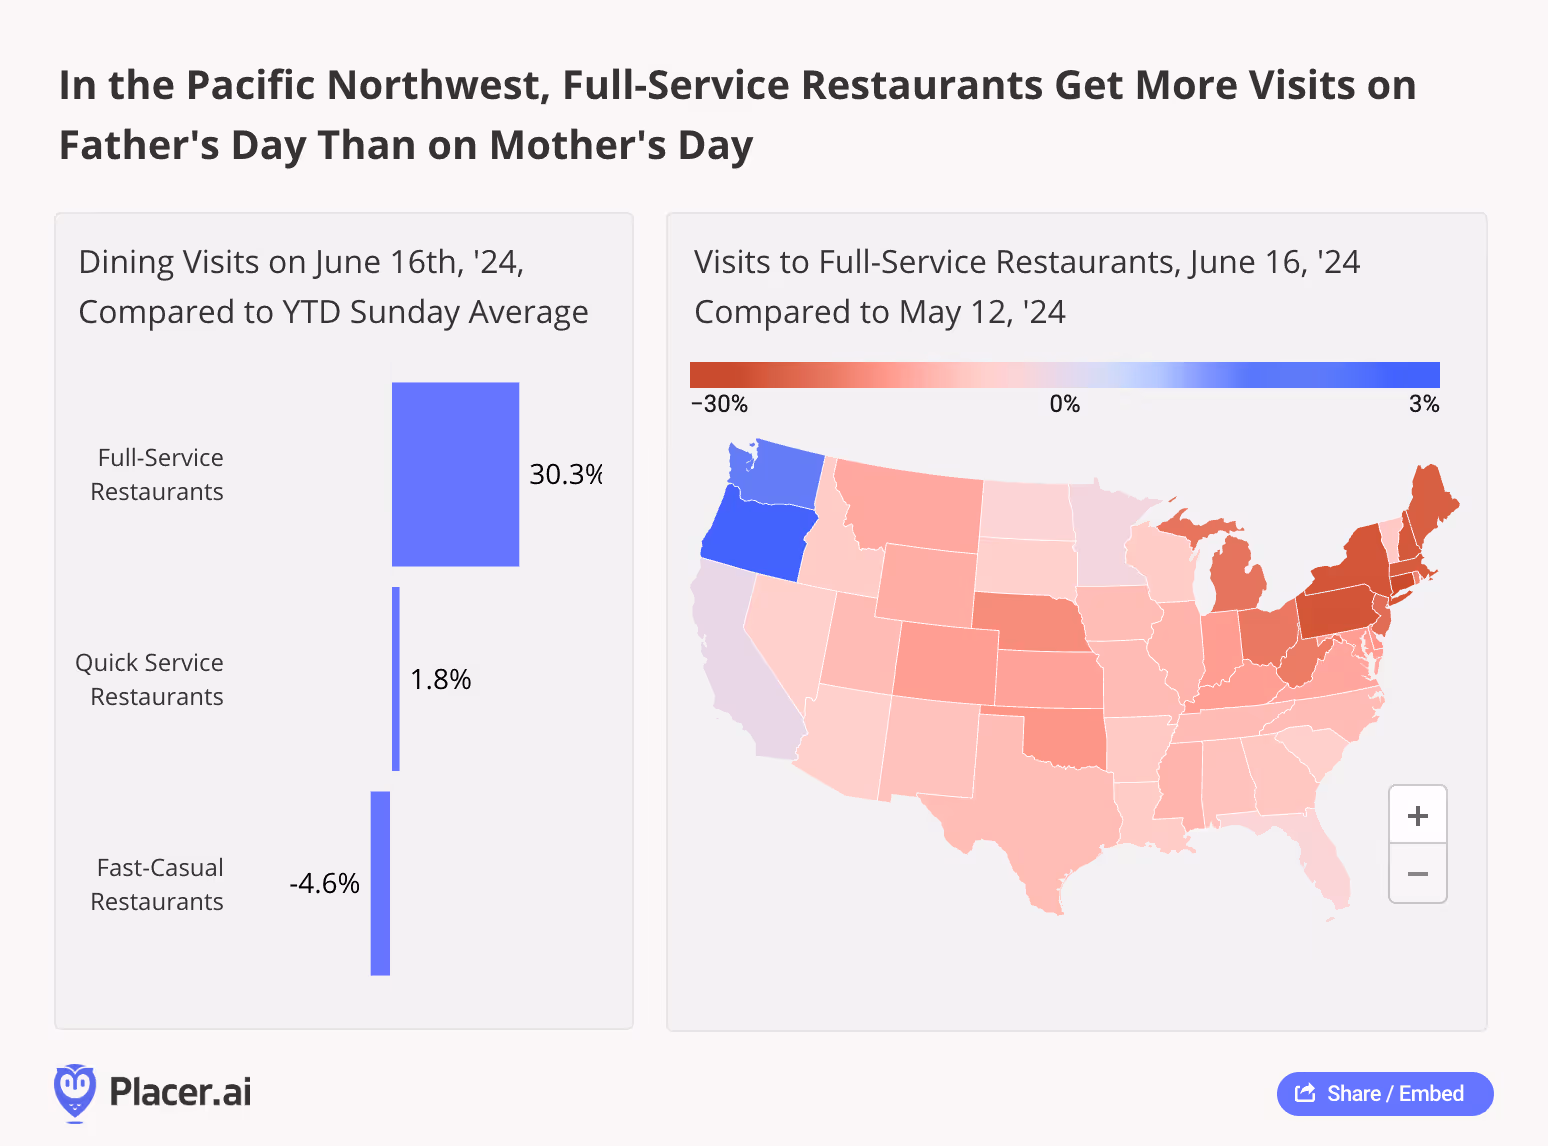
Like on Mother’s Day, grateful offspring ponied up on Father’s Day to treat their dads to a nice, sit-down meal. On June 16th, 2024, visits to full-service dining venues jumped 30.3% compared to a YTD Sunday average. Meanwhile, visits to quick-service restaurants increased just slightly, and those to fast-casual establishments declined.
Still, throughout most of the country, full-service restaurants (FSRs) were much busier this year on Mother’s Day than on Father’s Day. The discrepancy was most pronounced in Northeastern states like Connecticut, Pennsylvania, New York, New Hampshire, Massachusetts, Maine, and New Jersey – where Mother’s Day FSR visits were more than 20.0% higher than Father’s Day ones. But two states in the Pacific Northwest, Washington and Oregon, drew more FSR foot traffic on Father’s Day than on Mother’s Day – perhaps due in part to the region’s special connection to the occasion honoring dads. (The tradition of celebrating Father’s Day originated in Spokane, WA in the early 1900’s, decades before it was declared a federal holiday in 1972).
A Juicy Steak at… Texas Roadhouse
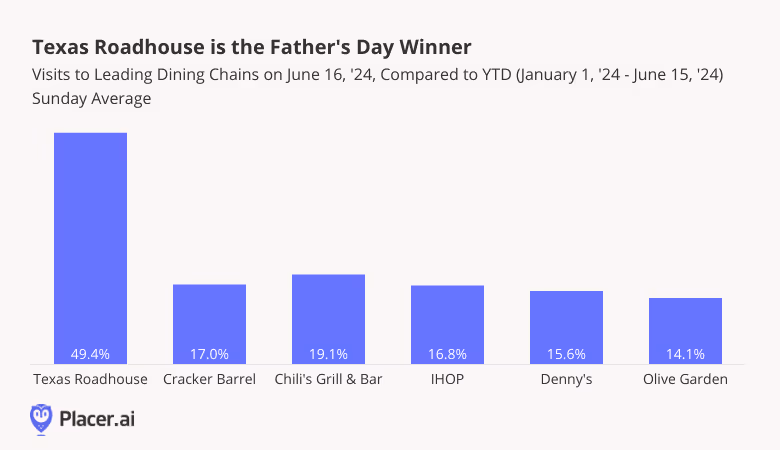
The dining difference between Father’s Day and Mother’s Day is about more than just quantity: Where moms have a clear soft spot for Olive Garden, dads are all about the steak. Texas Roadhouse was the single busiest FSR chain on Father’s Day this year, with visits outpacing an average YTD Sunday by 49.4%.
A Day for Dads
Father’s Day doesn’t have quite the same retail and dining impact as Mother’s Day – but it’s an important milestone nonetheless.
What other special calendar days are poised to draw outsize customer foot traffic in 2024?
Follow Placer.ai’s data-driven retail and dining analyses to find out.

The Placer.ai Nationwide Office Building Index: The office building index analyzes foot traffic data from some 1,000 office buildings across the country. It only includes commercial office buildings, and commercial office buildings with retail offerings on the first floor (like an office building that might include a national coffee chain on the ground floor). It does NOT include mixed-use buildings that are both residential and commercial.
With summer nearly upon us, we dove into the data to see how the return-to-office fared in May 2024. Did the post-pandemic visit recovery trajectory observed in April continue apace? And which major regional hub saw the most YoY visit growth?
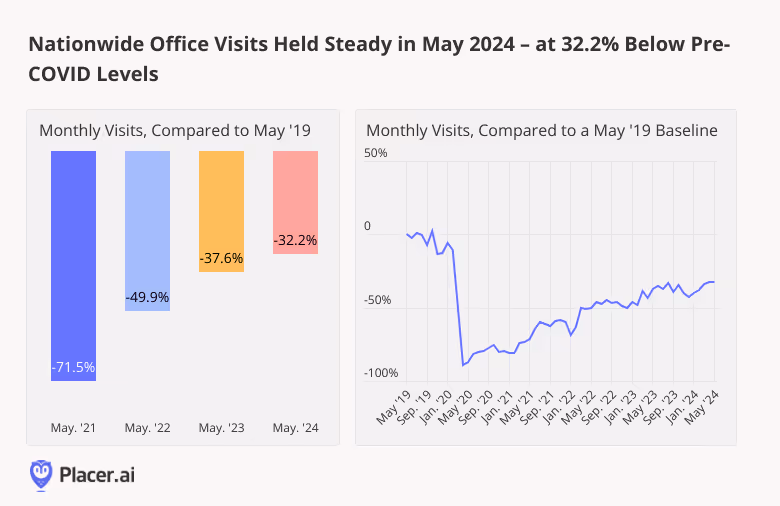
May Office Visits Hold Steady
The office recovery is still very much underway. Visits to office buildings nationwide in May 2024 were just 32.2% lower than in May 2019 – and slightly higher than they’ve been during any other month since COVID. Year-over-year (YoY), office foot traffic in May increased by 8.6%.
Regional Round Robin
And drilling down into the data for 11 major business hubs nationwide shows recovery continuing unabated throughout (most of) the country. For New York, Atlanta, Boston, Los Angeles, and San Francisco, May 2024 was the single busiest in-office month since February 2020. And for Miami, Washington, D.C., and Denver, it was the second-busiest month.
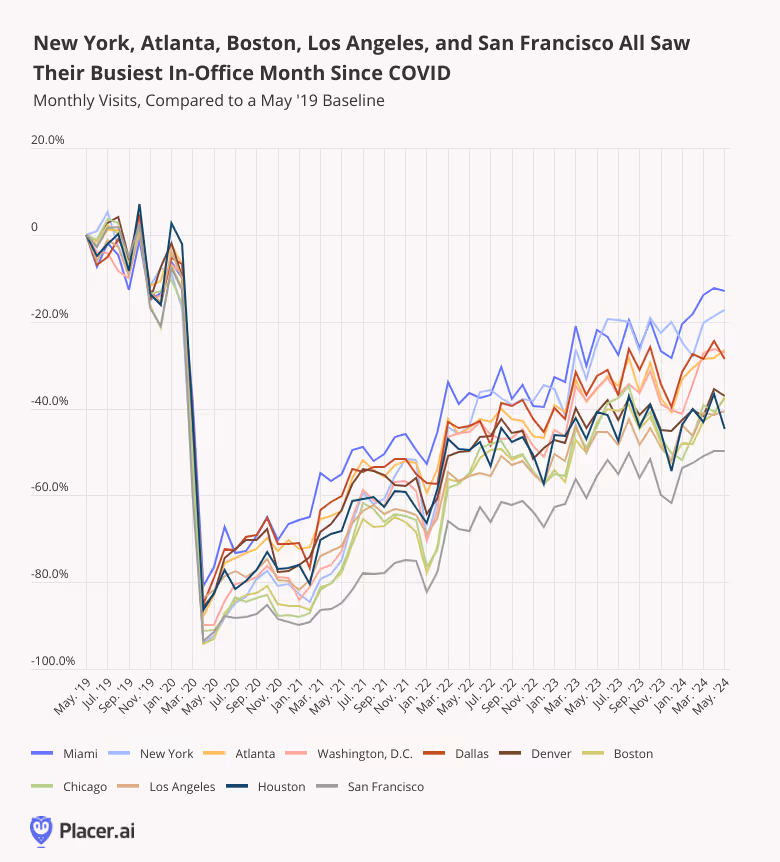
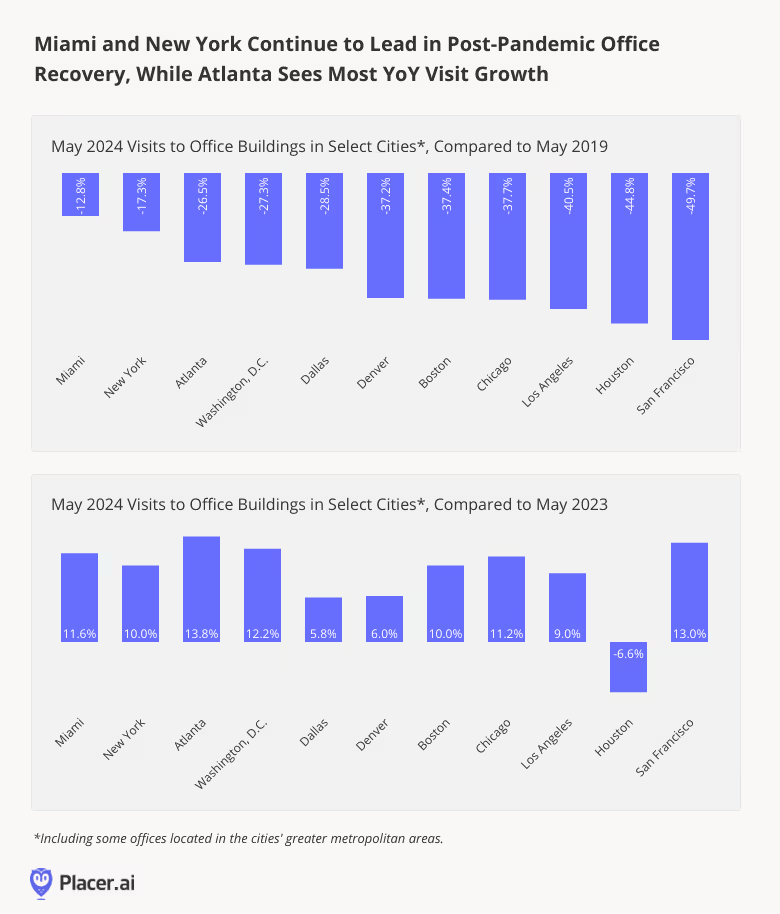
Consistent with recent trends, Miami continued to lead the post-COVID recovery pack, followed by New York: Foot traffic to the two cities was just 12.8% and 17.3%, respectively, below May 2019 levels.
But the data also contained some surprises. Atlanta, which saw the biggest YoY visit jump of any analyzed city, pulled into third place – outpacing Washington, D.C. And Houston, the only city to see a YoY decline in visits, fell significantly in the rankings.
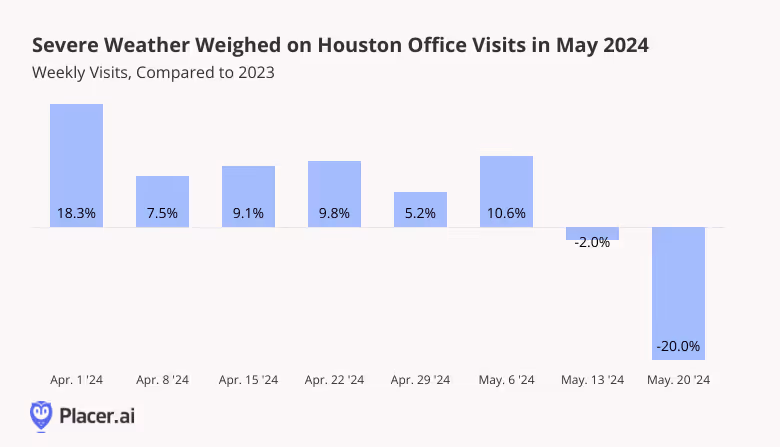
Houston Office Visits Impacted by Storm
Why did Houston YoY office visits drop in May? A look at weekly YoY visits to local office buildings confirms that this was likely due to the extreme weather that engulfed the city during the second half of the month. On Thursday, May 16th, Houston was hit by a particularly violent storm that caused significant damage to the downtown area – breaking windows, downing power lines, and leaving a battered city in its wake. Additional severe weather events pummeled the region as the month wore on – forcing many residents to hunker down at home. And it was when the storm hit that YoY visits began to turn negative, with the week of May 20th seeing a significant 20.0% drop. As the weather improves in the southeast Texas hub, office recovery will likely resume.
Final Thoughts
Five years after COVID upended office routines, employees and companies are still feeling out the ideal balance between WFH and in-person interaction. Will office attendance increase or decrease as the weather warms up?
Follow Placer.ai’s data-driven office analyses to find out.

With summer upon us, we dove into the data to explore Memorial Day foot traffic trends. How did people spend the long weekend? And how did major dining and retail categories fare on the holiday?
Road Tripping
Gas stations were bustling on Friday, May 24th, as people filled their tanks in anticipation of a long, travel or activity-filled weekend. Visits to gas stations were up 32.3% compared to an average day this year – and the highest they’ve been since January 1st, 2024.
Year over year (YoY), gas station foot traffic increased 1.5%. And compared to pre-COVID, too, gas station visits were up 1.8% – showing that people are once again hitting the road, whether to go on weekend getaways or to visit nearby parks and attractions.

Seeing the Sights
Indeed, Americans partake in many different activities on Memorial Day – from attending parades and memorial events to sight-seeing or enjoying the great outdoors. And visiting museums is a time-honored holiday tradition: On Monday, May 27th, museums nationwide drew a whopping 71.5% more visits than on an average Monday this year.
YoY, Museums were 1.6% busier on May 27th than in 2023 – and museum-goers spent more time exploring the exhibits (who says attention spans are decreasing?), browsing the gift shop, or fueling up at the cafeteria.

Enjoying A Nice Meal
Memorial Day weekend is a prime time for picnics and barbecues. But for many Americans, it’s also an opportunity to enjoy a nice meal at a restaurant with friends and family.
Like on Mother’s Day, full-service restaurants get a much bigger Memorial Day visit boost than either fast-casual eateries or fast-food (QSR) joints. But all three dining segments enjoyed a significant YoY holiday visit increase this year – proving that despite still-high food-away-from-home prices, people are finding room in their budgets to treat themselves on their day off.

Hitting the Sales
And the last Monday in May is, of course, a big day for savings, on everything from big-ticket items like mattresses, furniture, and major appliances, to clothing and other discretionary items. This year, apparel stores saw the biggest Memorial Day visit spike, with foot traffic up 40.5% compared to an average day and 88.2% compared to an average Monday. But home furnishing stores, home improvement stores, electronics retailers, and (to a lesser extent), grocery stores, all experienced considerable holiday visit spikes of their own.
And comparing Memorial Day retail activity to last year shows most of the analyzed categories seeing minor visit increases or holding steady – no small feat in today’s challenging retail environment. Like dining segments, grocery stores impressed with a 9.3% YoY visit increase – perhaps buoyed by consumers buying last-minute ingredients for their picnics or barbecues.

Final Thoughts
People were on the move this year on Memorial Day – fueling up their cars, and enjoying museums, restaurants, and retail sales. What does the rest of the summer hold in store for American consumers?
Follow Placer.ai’s data driven analyses to find out.

How did Mother’s Day (May 12th, 2024) impact retail and dining foot traffic this year? We dove into the data to find out.
The Hallmark Holiday
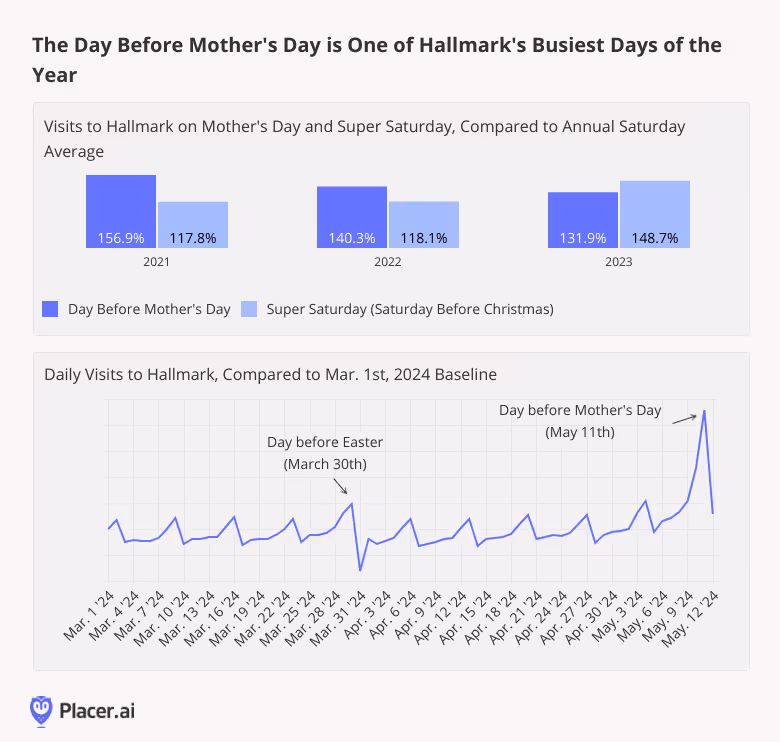
Urban legends notwithstanding, Mother’s Day wasn’t actually created by the greeting card industry. But the occasion hasn’t become known as the “Hallmark holiday” for nothing. Every year in the run-up to Mother’s Day, shoppers descend on the chain to purchase everything from cards to candy.
Most years, the day before Mother’s Day is Hallmark’s busiest day of the year, with Super Saturday (the Saturday before Christmas) a not-so-close second. In 2023, Mother’s Day was edged out by Super Saturday, which converged with Christmas Eve Eve to create a pre-holiday shopping bonanza for the ages.
And this year is shaping up to be no different: On May 11th, 2024 (the day before Mother’s Day), Hallmark experienced a major visit spike – leaving all other Saturdays, including the Saturday before Easter, in the dust.
A Variety of Retail Categories Benefit From Mother’s Day
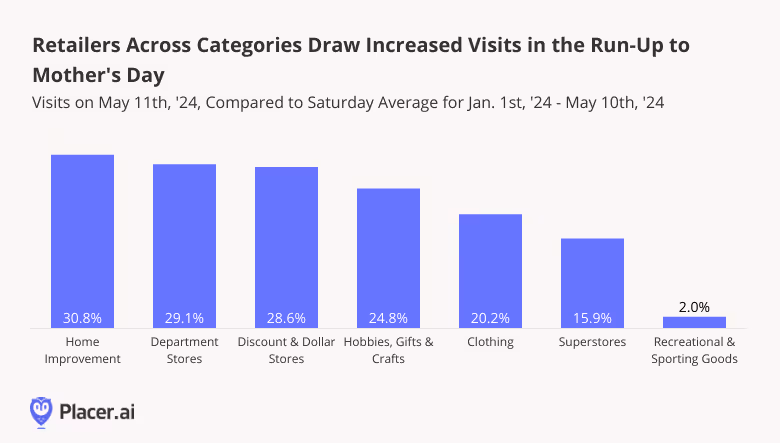
But greeting card retailers like Hallmark aren’t the only ones to benefit from Mother’s Day. A look at foot traffic to major industries on May 11th, 2024 shows that retailers across segments – from Home Improvement chains to Superstores – enjoy substantial visit boosts on the day before Mother’s Day. (Recreational & Sporting Goods, not so much).
For Home Improvement, Department Stores, Hobbies, Gifts & Crafts, and Clothing, May 11th, 2024 was the busiest day of the year so far, while for Discount & Dollar Stores and Superstores it was superseded only by March 30th – the day before Easter.
Going Out to Eat: Only the Best for Mom
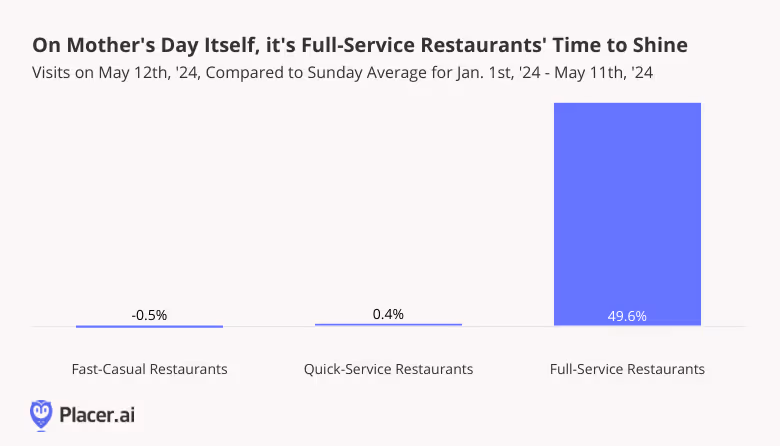
While the day before Mother’s Day is an important retail milestone, Mother’s Day itself is an occasion for treating mom to a nice meal out. And though grabbing a bite at a fast food joint or fast-casual fave is lots of fun – it decidedly isn’t the Mother’s Day vibe. A special occasion calls for a splurge, and Mother’s Day is Full-Service Restaurants’ time to shine.
On May 12th, 2024, Quick-Service and Fast-Casual Restaurants received about the same number of visits as on an average Sunday this year. But Full-Service Restaurants saw visits skyrocket – outperforming an average Sunday by 49.6%.
A Day for Olive Garden
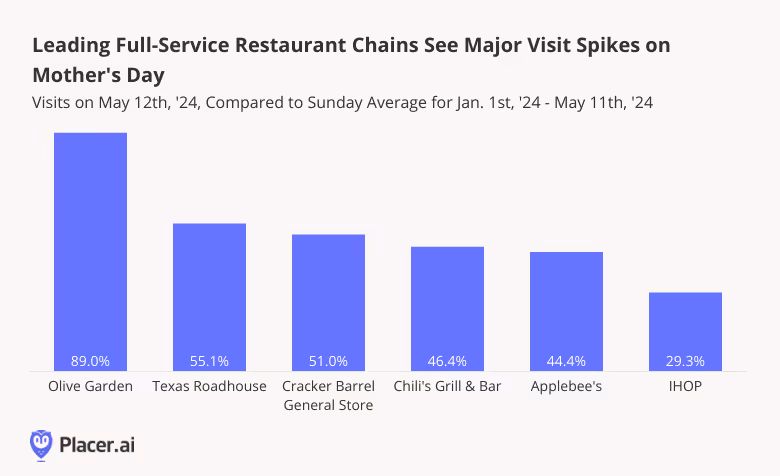
And drilling down into the data for six of Mother’s Day’s busiest Full-Service Restaurant chains shows Olive Garden emerging as a major holiday winner – with 89.0% more visits on May 12th, 2024 than on an average Sunday this year. Olive Garden drew more visits this Mother’s Day than on any other day since the beginning of the year – with Valentine’s Day (February 14th, 2024) coming in a close second.
But the Italian-American cuisine giant certainly isn’t the only FSR to enjoy a substantial visit boost on the big day: Texas Roadhouse, Cracker Barrel General Store, Chili’s Grill & Bar, Applebee’s, and IHOP saw respective May 12th visit increases of 55.1%, 51.0%, 46.4%, 44.4%, and 29.3%, compared to an average Sunday.
Final Thoughts
Mother’s Day comes but once a year – and grateful offspring nationwide show their appreciation with gifts and celebratory meals, generating boons for businesses across categories.
With Father’s Day right around the corner, what kind of impact will Dad’s big day have on retail and restaurant visits? Will Recreational & Sporting Goods brands have their day in the sun?
For more data-driven retail and dining insights, follow placer.ai.
The Placer.ai Nationwide Office Building Index: The office building index analyzes foot traffic data from some 1,000 office buildings across the country. It only includes commercial office buildings, and commercial office buildings with retail offerings on the first floor (like an office building that might include a national coffee chain on the ground floor). It does NOT include mixed-use buildings that are both residential and commercial.
Recent survey data shows that while most people don’t want to go back to the office five days a week, they also don’t want to be fully remote. Many employees – and companies – prefer a middle-of-the-road approach that balances flexibility with opportunities for in-person engagement, learning, and collaboration.
But what’s happening on the ground? We checked in with our Nationwide and regional Office Indexes to find out.
Office Visit Gap Continues to Narrow
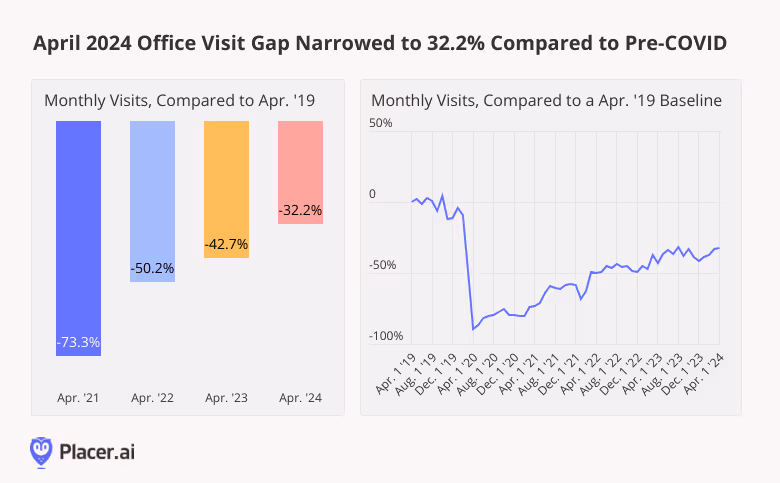
Last month saw a continuation of the positive office recovery momentum observed in February and March 2024. April 2024 office visits were just 32.2% below what they were in the equivalent period of 2019 (pre-pandemic), and nearly the highest they’ve been since COVID. Comparing monthly visits to an April 2019 baseline also shows that April 2024 was outperformed only by August 2023 – a rare month featuring 23 business days. (April 2024 had 22 business days – as did April 2019).
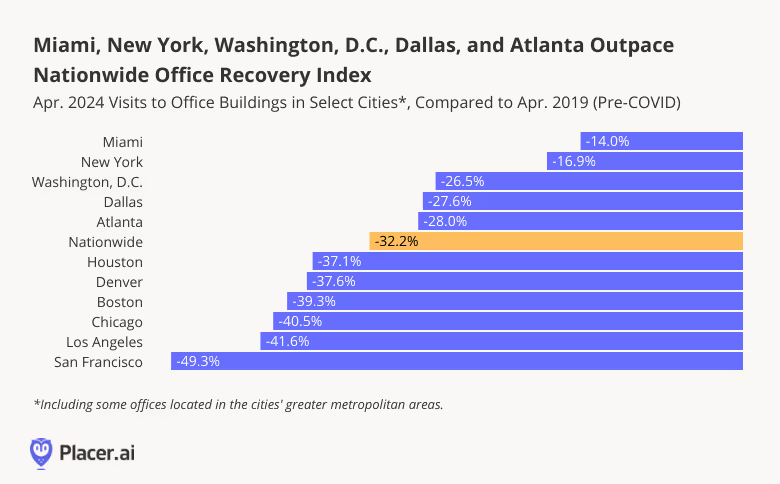
Miami, New York, Washington, D.C., Dallas, and Atlanta Outperform Nationwide Baseline
Drilling down into the data for major regional hubs shows Miami and New York solidifying their office recovery leads with respective pre-COVID visit gaps of just 14.0% and 16.9%. But these weren’t the only cities to shine: Washington, D.C., Dallas, and Atlanta also outperformed the nationwide baseline – and like Miami, experienced their single busiest in-office months since COVID.
San Francisco Wins Again
All the analyzed regional hubs saw significant YoY office visit growth – with the prize once again going to San Francisco, where visits were up 26.0%. Though San Francisco still lags significantly behind other regional hubs compared to pre-COVID, the city’s persistent YoY office visit growth may signal a light at the end of the Golden Gate City’s commercial real estate tunnel.
To be fair, April 2023 had two less business days than April 2024 – a fact that may have served to amplify YoY growth trends across the board. But even accounting for this discrepancy, last month’s strong office recovery was a particularly strong one – showing that RTO remains very much a work in progress.

Looking Ahead
The benefits and drawbacks of remote work are still being debated. But no matter how you slice it, spending some time in the office each week seems to have its benefits. As companies and employees continue to negotiate the new hybrid status quo, office visit patterns will continue to shift nationwide.
Follow Placer.ai for more data-driven office insights.
Dining took a hit over the past few years, with major challenges from COVID to rising costs weighing on the category. And perhaps no food-away-from-home segment was more impacted than Full Service Restaurants (FSR) – which stagnated as consumers traded down and sought out more affordable ways to treat themselves.
But new years present new opportunities – and there are signs that sit-down restaurants may be springing back to life. So with 2024 underway, we dove into the data to explore the current state of FSR. Is cooling inflation prompting a rise in Full Service Restaurant activity? How did FSR leaders like Dine Brands (owner of casual dining favorites Applebee’s and IHOP), Bloomin’ Brands (owner of popular grill and steak chains like Outback Steakhouse and Carrabba’s Italian Grill along with high-end Fleming’s Prime Steakhouse & Wine Bar), and Texas Roadhouse fare in Q1?
Restaurants To Dine For: Applebee’s and IHOP
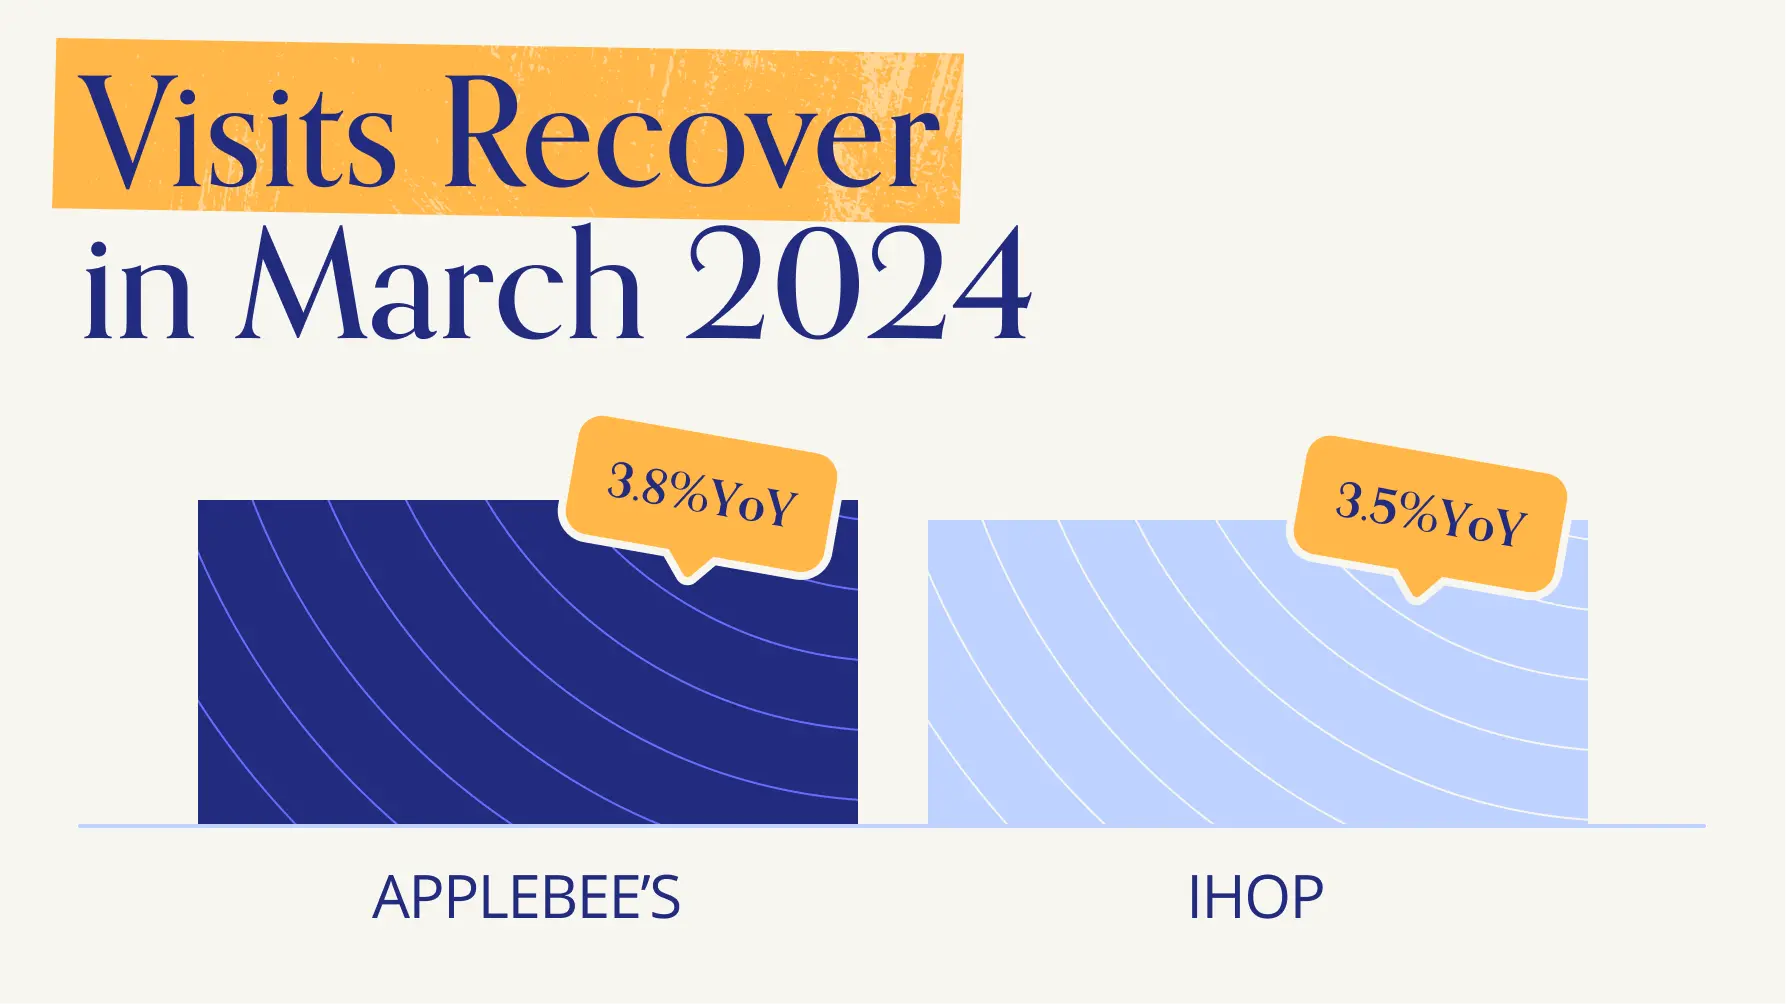
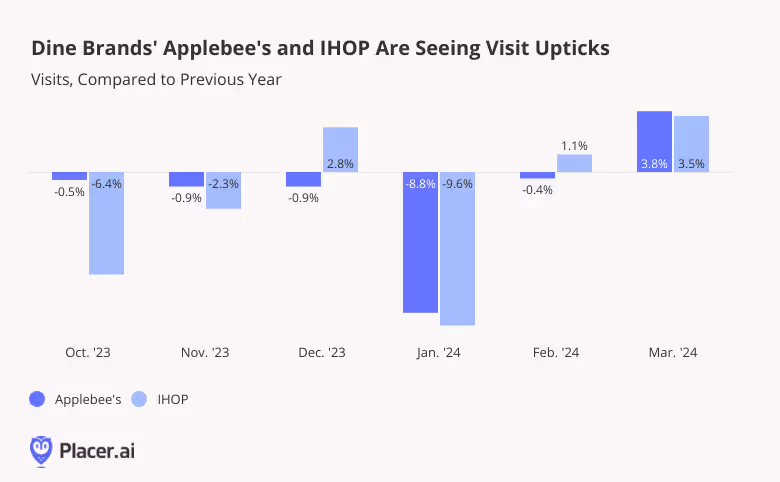
With some 1500 locations nationwide, Applebee’s has long been a mainstay of the American casual dining scene. Like other FSR chains, Applebee’s experienced a setback during the pandemic and has since faced industry-wide headwinds. But even though the brand’s store fleet shrunk by around 30 stores last year, overall YoY visits to Applebee’s declined just slightly between October 2023 and February 2024 (January’s weather-driven slump aside). And in March, the chain saw a promising 3.8% YoY visit uptick.
Breakfast leader IHOP also experienced negative YoY visits in October and November 2023, but in December – when the pancake chain traditionally enjoys a major holiday boost – visits jumped 2.8% YoY. Like Applebee’s, IHOP felt the effects of January’s Arctic blast, but saw its visits recover quickly in February and March 2024.
Bloomin’s Grill and Steak Chains on a Comeback
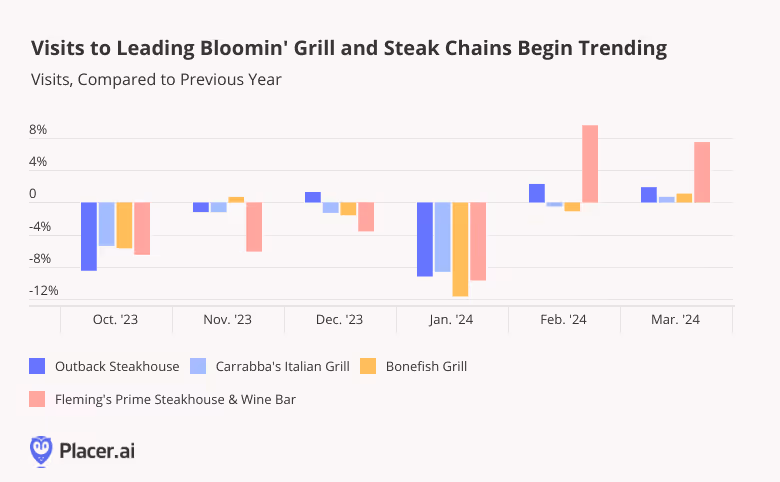
Bloomin’ Brands’ leading casual dining chains Outback Steakhouse, Carrabba’s Italian Grill, and Bonefish Grill appear to be following largely similar trajectories.
Though the brands experienced YoY visit gaps through most of Q3 2023 – and were whalloped by January’s inclement weather – all three chains experienced YoY visit increases in March 2024. Given the fact that the restaurants’ store counts didn’t change significantly last year, this visit growth appears to portend good things for Bloomin’s fast casual portfolio in the year ahead.
But it is Bloomin’ Brands’ fine dining concept, Fleming’s Prime Steakhouse & Wine Bar, that really seems to be hitting it out of the park. While Fleming’s also saw visit gaps between October 2023 and January 2024, the chain experienced 9.6% and 7.5% visit growth, respectively, in February and March 2024 – closing out Q1 with a bang.
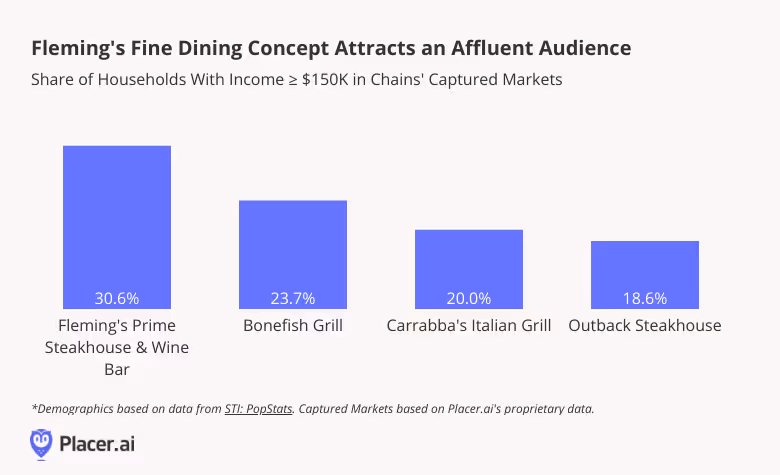
Fleming’s particularly robust recent performance may be due in part to its relatively affluent customer base. Nearly one-third of households in Fleming’s captured market have an annual income of $150K or more – compared to just 18.6% to 23.7% for Bloomin’s casual dining concepts. Though a night out at the fine-dining steakhouse can be expensive, Fleming’s well-heeled visitor base is better positioned to absorb price increases than other consumers.
Texas Roadhouse’s Sizzling Success
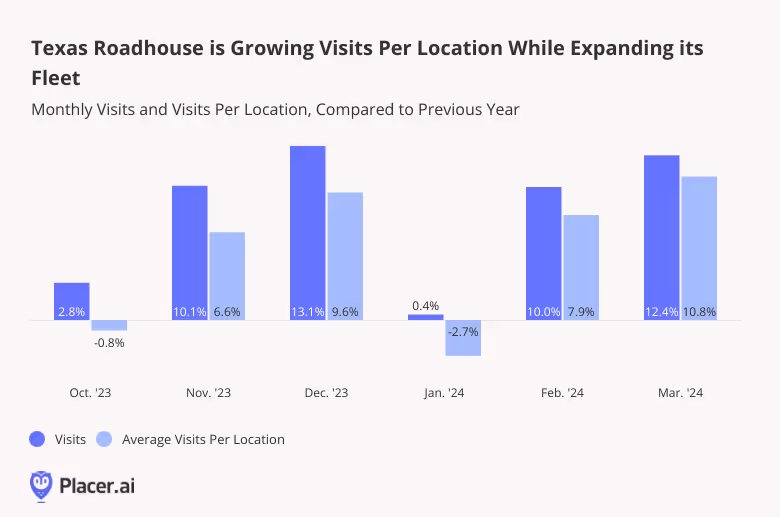
Appealing to affluent consumers, however, isn’t the only way to go. Texas Roadhouse is firmly in the casual dining space and tends to cater to average-income diners. (In Q1 2024, just 15.2% of its captured market had a household income ≥$150K.) But the steakhouse’s strategy of satisfying steak lovers with high-quality, affordable offerings is working: Throughout Q1, Texas Roadhouse experienced strongly positive YoY visit growth. And while some of this growth is attributable to the brand’s increasing unit count, the average number of visits per location is generally keeping pace – showing that Texas Roadhouse’s expansion continues to meet strong demand.
Poised for Further Growth
Though more affordable Dining segments like QSR and Fast Casual began to spring back to life last year, FSR has yet to fully recover from the double whammy of COVID and inflation. But if March 2024’s promising numbers are any indication, the category may be in for a turnaround. How will FSR continue to perform as 2024 progresses?
Follow Placer.ai’s Dining deep dives to find out.

