


.svg)


The past couple of years have been challenging ones for the dining industry as high food prices and economic headwinds led many consumers to cut back on unnecessary indulgences. Still, people can’t eat at home all the time, and there’s always demand for restaurants that serve up good food and a welcoming ambiance – without breaking the bank.
So with Q4 2023 under our belts, we dove into the data to check in with two dining chains that are especially good at giving customers what they want: Shake Shack and Wingstop. How did they perform during the final quarter of 2023? And what lies ahead for them in the new year?
Leaving Dining in the Dust
Shake Shack, curiously named after an amusement park ride from 70’s hit movie Grease, continues to impress. Following a robust third quarter, the gourmet burger joint maintained strong positive year-over-year (YoY) visit growth throughout Q4 2023 – finishing out the year with a remarkable 24.3% foot traffic jump in December 2023.
Wingstop, another darling of the dining industry, also ended 2023 with a bang. Whether celebrating the New York Knicks with a special lemon garlic flavor, or jumping on the dry January bandwagon with its own “dry rub January”, the popular chicken restaurant draws crowds by staying up-to-date with popular trends. And throughout Q4 2023, Wingstop saw positive visit growth ranging from 12.8% to 16.3%.
.png)
Shake Shack Shakes Things Up
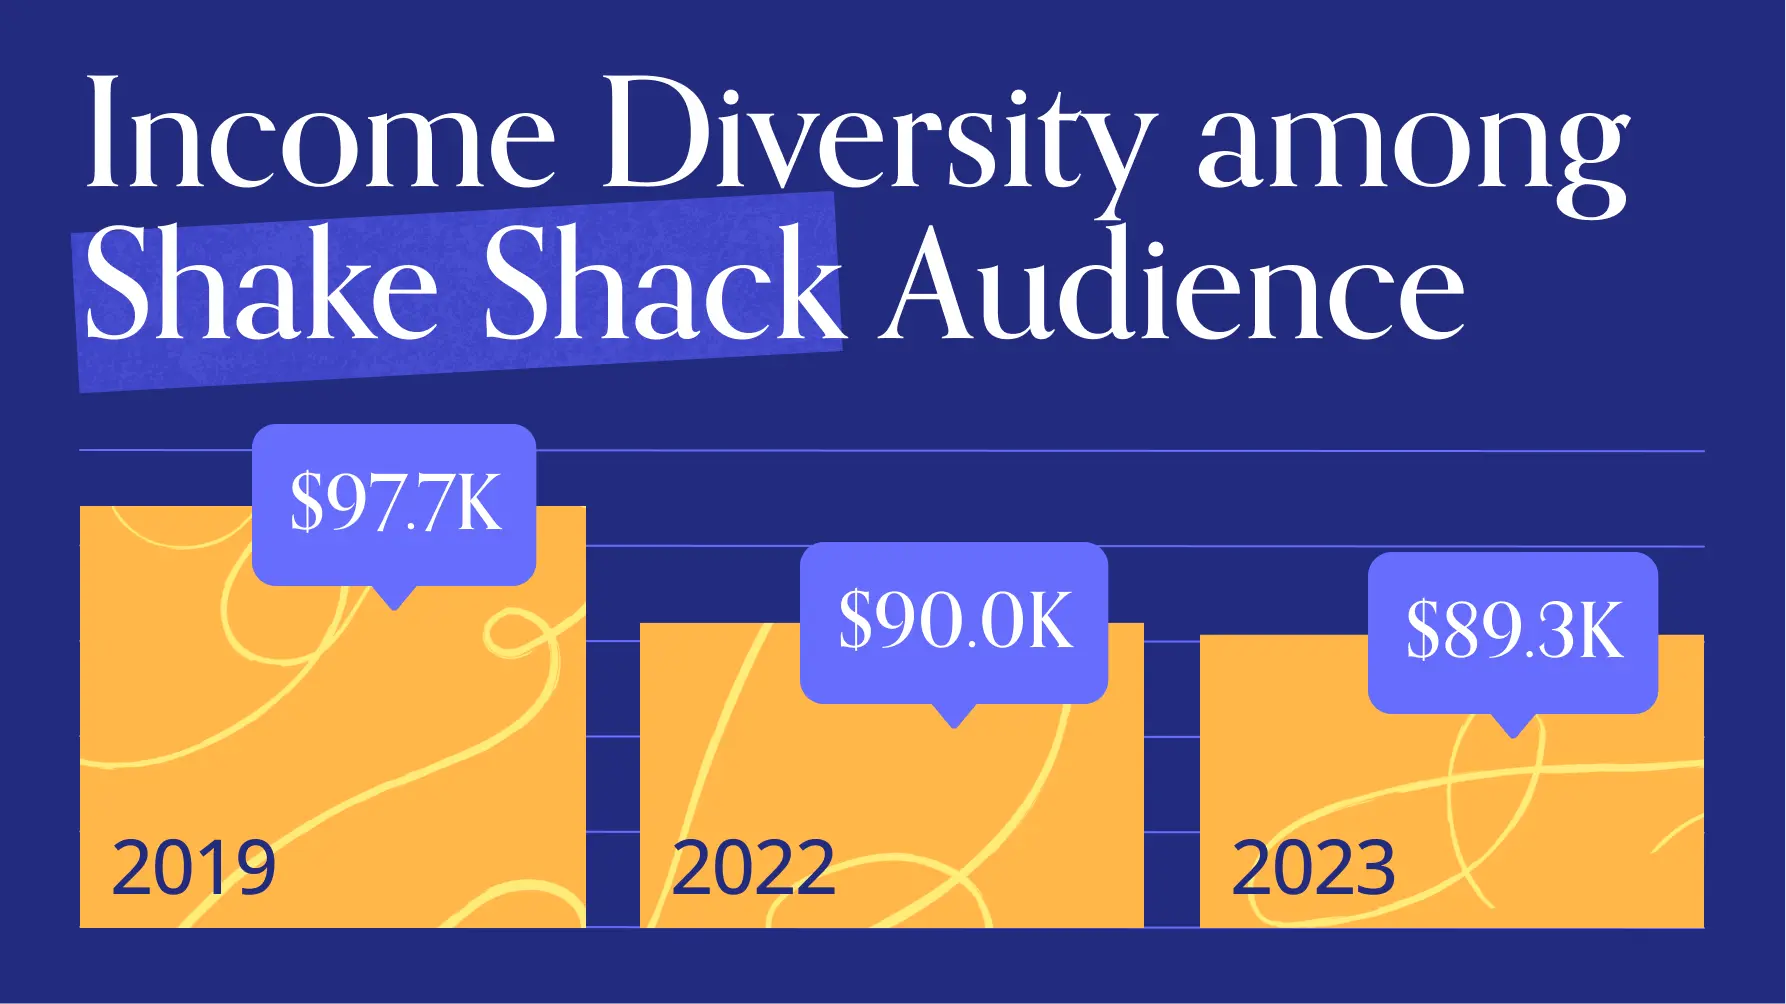
The ongoing success of these two chains in a difficult overall environment shows that there’s more than one way to win at the dining game. With limited-time offerings like White Truffle Burgers, and sandwiches that feature Kimchi slaw, Shake Shack’s relatively upscale offerings have traditionally drawn affluent audiences. But as the chain has continued to expand, its customer base has diversified – with the median household income (HHI) of its captured market dropping by 8.6% over the past four years. Over the same period, the share of ultra-wealthy families and educated urbanites in the restaurant’s captured market declined, while the share of young professionals and urban low income consumers increased. Wider audiences, of course, means broader appeal – and more people getting addicted to Shake Shack’s delicious offerings.
.avif)
Wingstop: Dinner for the Whole Gang
Wingstop, for its part, has pursued a somewhat different strategy. Positioned as an affordable eatery straddling the space between fast food and fast-casual, Wingstop draws less well-to-do consumers. Combining foot traffic data with demographics from STI’s PopStats shows that the median HHI of Wingstop’s captured market came in at $62.1K in Q4 2023, well below the nationwide baseline of $69.5K.
But despite targeting a demographic with less discretionary income, Wingstop has carved out a niche for itself as a to-go dining destination for people seeking the perfect place to sit down to a nice, big meal with the family. In Wingstop’s four biggest markets – Texas, California, Florida, and Illinois – the chain’s trade areas featured more persons per household than the statewide averages in Q4 2023. And Wingstop’s captured markets were also over-indexed for families with children – showing that parents are particularly likely to pay the restaurant a visit.
.png)
Key Takeaways
Though food prices have stabilized and consumer confidence has begun to recover, last year ended on a tough note for restaurants. But while the category as a whole has yet to fully regain its footing, chains like Shake Shack and Wingstop are finding success by leaning into evolving consumer demand.
Will cooling inflation kickstart a dining revival? And what does the rest of 2024 have in store for Shake Shack and Wingstop?
Follow Placer.ai to find out.

The Placer.ai Nationwide Office Building Index: The office building index analyzes foot traffic data from some 1,000 office buildings across the country. It only includes commercial office buildings, and commercial office buildings with retail offerings on the first floor (like an office building that might include a national coffee chain on the ground floor). It does NOT include mixed-use buildings that are both residential and commercial.
Remote work may not be bad for companies’ bottom lines – but it does appear to have drawbacks for employees. Fully remote workers were 35% more likely to be laid off in 2023 than those who came into the office at least part of the week. And full-time WFH personnel also got fewer promotions.
Still, reaping the benefits of in-person office work doesn’t require a full-time return to office. (Five days a week? Seriously?) And for many participants in the remote work wars, 2023 was a year for compromise. But what did the hybrid model look like in 2023? And who were last year’s office visitors?
We dove into the data to find out.
A Hybrid Sweet Spot?
Analyzing office visit trends over the past several years suggests that some variation of the hybrid model is indeed here to stay – though the jury’s still out on whether we’ve found the sweet spot. Since Q2 2023, quarterly visits to office buildings have remained about 34.0%-38.0% below pre-COVID levels. But Q4 2023 office foot traffic was 12.9% higher than the equivalent period of 2022, suggesting that additional office recovery may still be in the cards.
Regionally speaking, Miami and New York closed out 2023 at the head of the pack, with visits about 20% below the pre-pandemic baseline. Dallas and Chicago finished the year with respective quarterly visit gaps of 31.8% and 43.0%. And San Francisco continued to bring up the rear, with office foot traffic 53.8% below pre-COVID levels.
.avif)
These general trends continued into January 2024. Nationwide, office buildings experienced a 42.1% year-over-four-year (Yo4Y) visit gap, potentially indicating stalling recovery. But at the same time, major markets across the country – most impressively San Francisco – saw sustained YoY visit growth, showing that the return to office (RTO) story is still being written.
.png)
Who Goes There?: 2023’s Office Visitors in Three Data Points
Whether office recovery has run its course, or whether 2024 promises a renewed upward trajectory – a more granular picture of the specific habits and characteristics of office-goers can help stakeholders adapt to evolving trends.
Rebounding Affluence
And while foot traffic remains substantially below 2019 levels, the affluence of office buildings’ visitor base has very nearly rebounded to what it was before COVID. In Q1 2019, the median household income (HHI) of the Nationwide Office Index’s captured market stood at $91.9K, a metric which plummeted in early 2020 as more affluent employees rode out lockdowns from home. But since then, the median HHI has slowly risen – reaching $90.1K - $91.6K in 2023.
Unsurprisingly, remote and hybrid work opportunities aren’t distributed equally – and wealthier, more-educated workers are better positioned than others to take advantage of them. But visitors to major office buildings tend to have significantly higher-than-average HHIs to begin with (STI’s PopStats puts the nationwide baseline at $69.5K). So even if the median HHI of office visitors is once again close to what it was before COVID, it is these relatively affluent employees that are coming in less frequently and helping to shape the new hybrid normal.
.png)
Fewer Families With Children
At the same time, there has been a subtle but distinct decline in the share of parental households in offices’ captured markets – indicating that parents of children accounted for a smaller proportion of office visits in 2023 than in 2019. This change varied by region, with Chicago seeing the smallest shift and tech-heavy San Francisco seeing the largest one.
For many working parents, flexibility is the name of the game – and employees juggling parental responsibilities along with their work loads may be particularly eager to embrace working from home.
.png)
Thank Goodness it’s Fri-yay!
Another data point that’s particularly important for stakeholders to understand is the daily breakdown of office visits throughout the week. And foot traffic data for 2023 shows that the TGIF work week that we first observed in 2022 remains more firmly entrenched than ever. People continue to concentrate office visits mid-week and log on from home on Mondays and especially Fridays – an effect that is most pronounced in San Francisco, and least pronounced in Miami. And for municipalities, CRE companies, and local businesses that rely on office foot traffic, recognizing the persistence of this pattern can be key to making the most of those days when offices are abuzz with activity.
.avif)
Key Takeaways
The new hybrid model remains a work in progress – and it’s too soon to tell whether offices will indeed see further attendance increases in 2024. But either way, the behaviors and attributes of office-goers will continue to evolve, presenting stakeholders with opportunities and challenges alike.
What does 2024 have in store for RTO? And how will the profile of visitors to America’s offices change in the new year?
Follow placer.ai/blog to find out.

Hot on the heels of the burrito’s emergence as America’s favorite dish in 2022 – edging out even the iconic cheeseburger – spicy potato tacos rocked Grubhub’s list of 2023’s top five spicy food orders.
So with the new year upon us, we dove into the data to check in with three steadily-expanding taco chains that are likely to continue making waves this year: Bartaco, Condado Tacos, and El Vaquero. Each of the three chains fills a somewhat different niche, and each of them is growing – showing that despite the challenges facing the restaurant industry, there’s a hot market for taco chains that hit the sweet spot with the right food and ambiance.
Bartaco and Condado Tacos on the Rise
Bartaco, the upscale eatery known for its beach-like vibe, specialty cocktails, and eclectic street food menu, is a taco restaurant with a twist. The diverse menu includes everything from falafel tacos to glazed pork belly rice bowls. And while guac and chips are on offer, hungry diners can also indulge in kale caesar salad or Korean-style kimchi. Over the past several years, Bartaco has expanded its fleet – and the restaurant now boasts some 29 locations across 12 states (and Washington, D.C).
Condado Tacos is another popular restaurant that has grown its footprint in recent years. The “come as you are” casual-dining chain known for its funky art decor now features some 49 locations across 10 states – 20 of them in Ohio. And with plans to open 90-100 restaurants by 2026, the chain is on a roll. Customers can build their own tacos with fillings like Thai Chili Tofu or Tequila-Lime Steak, or choose one of the menu’s tempting suggestions. And like Bartaco, Condado Tacos offers a variety of cocktails – including seasonal choices like the Harvest Pear Marg.
And location intelligence shows that the expansion of both chains is meeting growing demand. Visits to Bartaco and Condado Tacos have risen steadily over the past two years, reaching a respective 52.2% and 52.9% growth in Q4 2023 relative to Q1 2022.
.avif)
El Vaquero: A Cinco de Mayo Fav
Ohio is also home to El Vaquero – a Mexican chain with 18 locations in the Buckeye State and two more in Michigan. El Vaquero, which has also expanded over the past several years, saw foot traffic rise 4.8% in Q4 2023 compared to the equivalent period of 2022. And with a menu that includes everything from nachos to huevos con chorizo, it’s no wonder the chain has emerged as a local favorite.
Like Bartaco and Condado Tacos, El Vaquero has a rich cocktail menu, as well as a varied selection of wines and beers. And while the chain’s offerings certainly draw crowds throughout the year, El Vaquero really goes crazy on Cinco de Mayo, the May 5th commemoration of Mexico's victory over Napoleon in 1862. El Vaquero marks the occasion with a five-day special menu and an all-day happy hour on Cinco de Mayo itself. And on May 5th, 2023, El Vaquero experienced its busiest day of the year by far, drawing a remarkable 200.2% more visitors than it did, on average, during April and May 2023.
.avif)
Singles and Tacos for Dinner
Drilling down into the data for Bartaco, Condado Tacos, and El Vaquero shows that despite their differences, the three chains experience similar hourly visitation patterns. All three are busiest in the evenings – but while El Vaquero and Condado Tacos peak between 6:00 PM and 8:00 PM, Bartaco peaks somewhat later, between 7:00 PM and 9:00 PM. Bartaco also stays busier into the 9:00 PM – 10:00 PM time slot.
.avif)
Bartaco’s, Condado Tacos’, and El Vaquero’s evening draw may be due, in part, to the special appeal they hold for singles: The captured markets of all three chains feature significant shares of one-person households – and in the case of Bartaco and Condado Tacos, smaller concentrations of families with children. (For El Vaquero, the proportion of households with children is on par with that of single-person households). Of the three, the more upscale Bartaco boasts the highest share of single-person households – and the lowest share of parental ones – perhaps explaining its later visit peak and greater late-night engagement.
.png)
Key Takeaways
Mexican food has arisen as a preferred cuisine for many consumers. And even in today’s challenging economic environment, brands that can offer a winning combination of good food, nice cocktails, and a welcoming atmosphere are poised to thrive. How will Bartaco, Condado Tacos, and El Vaquero continue to fare in the new year? And what lies in store for the wider taco restaurant space in the months to come?
Follow Placer.ai’s data-driven dining analyses to find out.

High food-away-from-home prices weighed on the dining sector in 2023. But affordable indulgences were the name of the game – and for plenty of people, their daily caffeine fix remained non-negotiable.
So with the new year gathering steam, we dove into the data to explore consumer trends impacting Starbucks and Dunkin’ in 2023. What were the biggest days of the year for the two chains? And who were the java enthusiasts driving visits to the two chains last year?
1. National Donut Day is Coming Back
The first Friday of every June is National Donut Day, an event first kicked off by the Salvation Army in the 1930’s to honor folks that served doughnuts to soldiers during the First World War. Every year, Dunkin’ marks the occasion with – you guessed it – free doughnuts, and this year wasn’t any different. On June 2, 2023, Dunkin’ fans were invited to snag a delicious free treat with the purchase of any beverage, and customers turned out in droves.
The day turned out to be the busiest one of the year, with Dunkin’ locations seeing a 49.4% increase in foot traffic compared to the chain’s 2023 daily average. And after a couple of years when the occasion garnered somewhat less turnout, National Donut Day appears to be very much on track to regain its pre-COVID glory (The last time National Donut Day was the busiest day of the year was in 2019). Friends, it seems, really don't let friends miss out on free doughnuts.
.avif)
2. Holiday Cheer, Black Friday, and … Pumpkin Spice, Of Course!
Like many restaurant and coffee chains, Starbucks tends to be busiest on Saturdays. And in 2023, the popular coffee chain drew its biggest crowds on November 4th – the first Saturday after the launch of the eagerly-anticipated holiday menu. With mouth-watering offerings like Chestnut Praline Latte and Iced Gingerbread Oatmeal Chai, it’s no wonder customers can’t wait to indulge – especially when they can top off their drink with a Snowman Cookie or a Peppermint Brownie Cake Pop. (Luckily, the menu launch comes before those pesky new year’s resolutions.)
Starbucks’ second-busiest day of the year in 2023 was Black Friday (November 24th), as shoppers sought a quick way to fuel up or get a caffeine boost while they hit the stores. And the chain’s third-busiest day of the year was August 26th – the first Saturday after the annual release of Starbucks’ calendar-owning Pumpkin Spice Latte, a tradition that never fails to drive excitement – and foot traffic.
.avif)
3. Reaching Diverse Crowds Year-Round
But who were the customers that fueled Starbucks’ and Dunkin’s foot traffic in 2023? Analyzing the two chains’ captured markets with psychographics from Spatial.ai shows that while each of them attracted a somewhat different audience, they both drew diverse crowds throughout the year.
Starbucks, which features a cozy ambiance that encourages people to stay a while, has emerged as a popular WFH spot – and is more likely than Dunkin’ to be frequented by Young Professionals. The doughnut leader, on the other hand, boasts a to-go vibe, and draws greater shares of Suburban Boomers and Rural High-Income customers. Still, the data shows that coffee consumption is far from a zero-sum game, and in 2023, both chains attracted healthy shares of each of the analyzed segments.
.avif)
4. A Regional Coffee Game
In addition, while Starbucks customers tend to hail from more affluent areas than Dunkin’ fans, the median household income (HHI) of each chain’s customer base varied considerably by region last year – as did the extent of the HHI gap between the two chains.
Starbucks’ most affluent customer base was in New England, where the median HHI of its captured market stood at $90.7K – a significant 19.2% higher than that of Dunkin’s ($75.8K). But in the Pacific region, including California, Dunkin’s captured market had a median HHI of $83.2K, just 2.1% lower than that of Starbucks.
.avif)
Key Takeaways
“Coffee, coffee, coffee!” may be a bit from Gilmore Girls, but it’s also a way of life for millions of Americans. And location data shows that in 2023, there was plenty of love to go around for coffee leaders like Starbucks and Dunkin’.
How will National Donut Day and Starbucks’ holiday menu play out in 2024? And what does the new year have in store for the coffee space more generally?
Follow Placer.ai’s data-driven analyses to find out.

From high prices to changing workplace attire (yes, soft pants are most definitely still a thing) – the fashion industry faced plenty of headwinds in 2023. But some segments, like off-price and thrift stores, reaped the benefits of trading down by consumers. And the category as a whole enjoyed a robust holiday season, helping to drive record holiday sales.
So with 2024 getting underway, we dove into the data to explore the evolving relationship between three major segments that comprise the fashion industry: non-off-price apparel chains, off-price retailers (such as T.J. Maxx, Marshalls, Ross Dress for Less, and Burlington), and thrift shops.* Which segment drew the most foot traffic in 2023? And how have the demographic profiles of visitors to the three sub-categories shifted in recent years?
*Analysis includes major thrift shop chains, including Goodwill, the Salvation Army, Buffalo Exchange, Plato’s Closet, and others.
Off-Price and Thrift Stores Gain Market Share
Last year saw an acceleration of the redistribution of foot traffic between non-off-price apparel retailers, off-price apparel chains, and thrift shops – a trend which began even before COVID. Back in 2017, non-off-price apparel stores accounted for just over 50% of visits to these three segments – but in the years since, the sub-category’s visit share dwindled to 38.9%. Over the same period, off–price-apparel chains grew their visit share by 8.1 percentage points, from 39.3% to 47.4%, and the share of visits to thrift shops increased by 3.2%.
.avif)
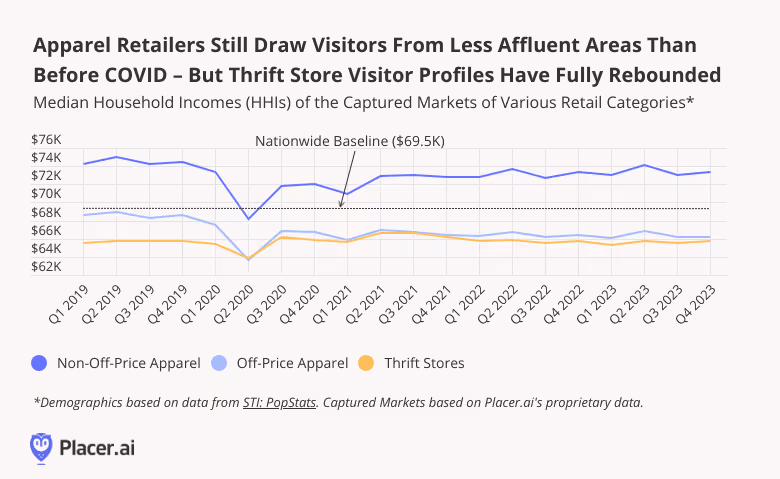
Apparel Affluence Gap Persists
Unsurprisingly, non-off-price apparel chains have traditionally attracted more affluent consumers than either off-price retailers or thrift stores. And throughout the analyzed period, the captured market of non-off-price apparel retailers continued to feature a median household income (HHI) that was significantly higher than the nationwide baseline, while the captured markets of off-price chains and thrift stores featured median HHIs below the nationwide median.
But the three segments were impacted differently by shifts in consumer behavior in the wake of the pandemic. In early 2020, all three sub-categories experienced significant dips in the affluence of their captured markets. But while thrift shops saw an immediate HHI rebound, non-off-price apparel chains – and even more so off-price retailers – have yet to see the affluence of their visitor bases return to 2019 levels.
Thrifting is (Disproportionately) for Singles
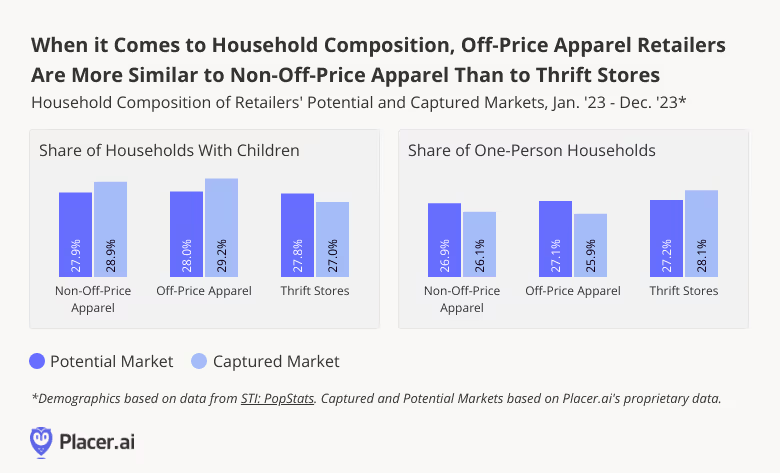
Foot traffic data also reveals an interesting divide in the household composition of visitors to the three segments: While the income profiles of off-price apparel shoppers are more akin to those of thrifters, their household composition is closer to that of visitors to non-off-price apparel stores.
The potential markets of all three categories, for example, featured similar shares of one-person households in 2023. But their captured markets were quite different – with singles over-represented for thrift stores, and under-represented for off-price and non-off-price apparel stores. This indicates that thrifters hail disproportionately from Census Block Groups (CBGs) that feature higher-than-average shares of one-person households. And visitors to off-price and non-off-price retailers come from the CBGs within the trade areas of these chains that feature smaller-than-expected concentrations of one-person households. Given the special appeal thrift shops carry for demographics like college students, it may come as no surprise that singles are among their best customers.
For families with children, on the other hand, more traditional apparel retailers hold sway: Visitors to off-price and non-off-price apparel stores were more likely to come from areas with higher concentrations of families with children in 2023, while thrifters were more likely to come from areas with smaller ones.
Key Takeaways
Economic headwinds and evolving consumer preferences have left their mark on the shifting relationship between different sub-categories within the fashion industry. But what does 2024 have in store for the sector? Will cooling inflation and rebounding consumer confidence lead to an increase in visit share for non-off-price favorites? And will more parental households make the pivot to thrift stores?
Follow Placer.ai’s data-driven retail analyses to find out.

For grocery stores, last year held plenty of challenges – from high food-at-home prices to increased competition from non-traditional grocery players like dollar stores and superstores. But 2023 also offered the segment plenty of opportunities. Discount chains made a strong showing – and customers spent more time browsing grocery aisles, loading up on essentials and making every trip to the store count.
But which grocery brands were most popular in 2023? Did large national chains dominate the scene, or did regional and local banners also have a role to play? And what can foot traffic analytics tell us about some of the broader trends that shaped brick-and-mortar grocery shopping last year?
We dove into the data to find out.
And the Winner is… Kroger!
The nation’s most-visited grocery banner in 2023 was Kroger, which captured almost 19% of annual foot traffic to the nation’s ten most-frequented grocery chains. Safeway, owned by Albertsons, also made the top ten list.
But significantly, several regional chains also garnered significant nationwide visit share – including Texas cult-favorite H-E-B, midwestern Meijer, and East Coast Food Lion and ShopRite. Aldi, the no-frills budget chain that keeps prices low by offering a limited inventory of mainly private-label products, emerged as the fourth most-visited grocery store in the country. And fan-favorite Trader Joe’s, also known for its high-quality own-label merchandise, drew 6.5% of visits to the top ten brands.
.avif)
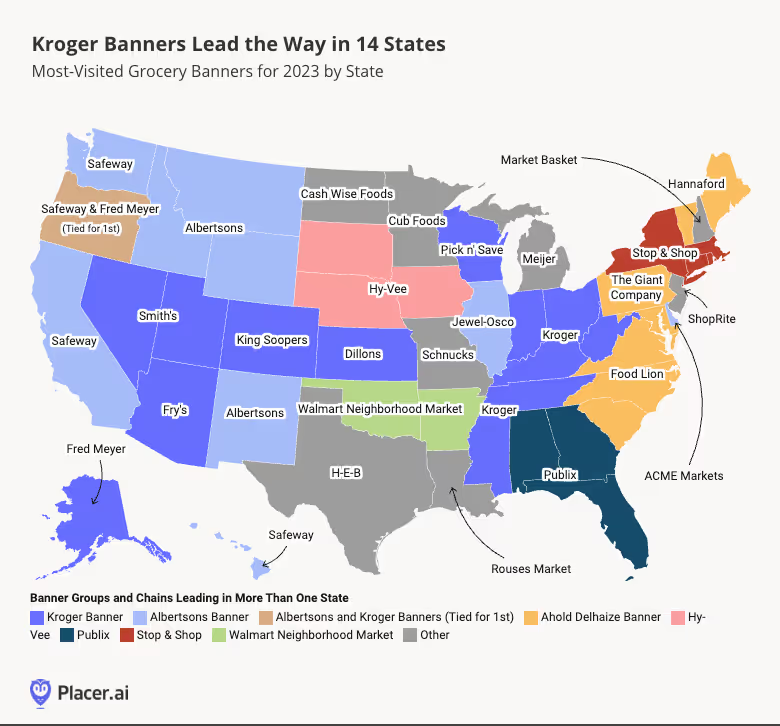
Plenty of Room for Regional and Local Players
And drilling down deeper into the data for each of the fifty states shows that each region of the country had its own local favorite. Kroger banners – including Kroger, Smith’s, King Soopers, Dillons, Fry’s Food Stores, Fred Meyer, and Pick n’ Save – topped the charts in 14 states. In one of these (Oregon), Kroger’s Fred Meyer was tied for first place with Safeway, an Albertsons banner. In addition to Oregon, Albertsons banners took the lead in nine more states, mainly in the Western region of the U.S., while Ahold Delhaize banners ranked first in seven Northeast and South Atlantic states. And a variety of more local chains held sway throughout much of the Midwest and parts of the South.
A Changing Customer Profile
Who were the shoppers driving visits to brick-and-mortar grocery stores in 2023? Location intelligence shows that overall, visitors to grocery chains last year tended to come from areas with slightly higher median household incomes (HHIs) than the nationwide average. Less affluent consumers, perhaps, were more likely to seek out lower-cost grocery alternatives like dollar stores. At the same time, there remained significant HHI gaps between chains, likely reflective in part of regional differences.
.avif)
And comparing the overall median HHI of grocery chains’ captured markets to that of previous years reveals a small but distinct decline in the relative affluence of likely grocery visitors, from $76.2K in 2019 to $73.8K in 2023. Over the same period, the share of “Flourishing Families” in the chains’ captured markets (A psychographic segment encompassing affluent middle-aged families and couples) decreased slightly, while the share of “Singles and Starters” increased.
These shifts may be partially due to the more widespread adoption of online grocery shopping among certain audience segments in the wake of COVID. While ecommerce only accounted for an estimated 7.2% of grocery spending as of May 2023 – with high delivery fees continuing to deter many Americans from going the online route – higher-HHI consumers may be particularly willing to prioritize convenience over price.
.avif)
Key Takeaways
For grocery stores, 2023 was all about value – with many customers flocking to discount chains and going out of their way to maximize savings. Still, traditional mainstays like Kroger and Albertsons continued to capture the biggest pieces of the grocery pie.
What does 2024 have in store for the grocery space? Will shoppers place less emphasis on savings as inflation continues to ease? And which chains will emerge as nationwide and regional winners?
Follow Placer.ai’s data-driven retail analyses to find out.

