


.svg)


After theaters were dominated by Barbenheimer in 2023, 2024 is shaping up to be another record-breaking year, with several big-name releases. We took a closer look at visitation patterns at major movie theater chains – AMC Theatres, Regal Cinemas, and Cinemark – to analyze how foot traffic has been impacted by the highly anticipated summer releases of Deadpool & Wolverine and Twisters.
Major Boost at the Box Office
Last year was one of the most exciting ones in recent memory for cinema, with multiple films breaking box-office records and driving foot traffic at movie theaters across the country. But 2024 has had plenty of tricks up its cinematic sleeve, and several summer releases have been meeting the high bar set by Barbenheimer. Inside Out 2, released nationwide on June 14th 2024, kickstarted the summer with a major movie-goer visit boost– and Deadpool & Wolverine, released on July 26, 2024 brought out even bigger crowds.
Indeed, the superhero crossover movie Deadpool & Wolverine is set to be one of the best-performing films of 2024. During the week of July 22nd, 2024 – when Deadpool & Wolverine was released – visits to movie leaders AMC Theatres, Regal Cinemas, and Cinemark jumped by 132.7% to 140.5% compared to a YTD weekly average. Twisters, released on July 19th, also drove impressive visit boosts ranging from 39.8% to 48.3% during the week of July 15th.

Early Marvel Momentum
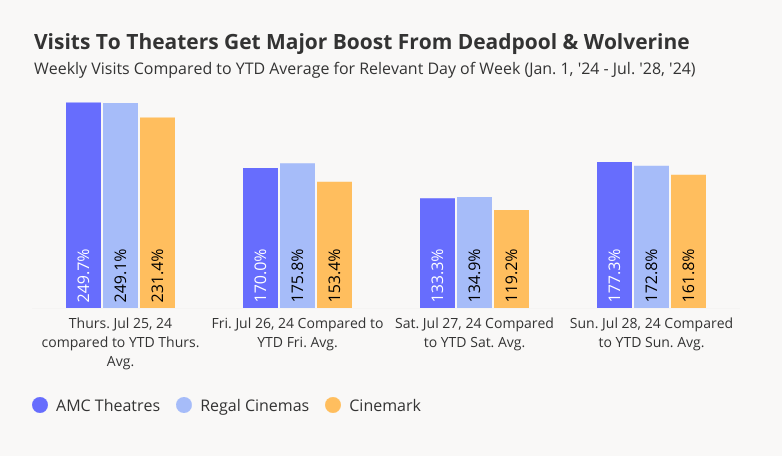
Early screenings have always been a big driver of visits for those lucky enough to grab tickets. And on the day before Deadpool & Wolverine’s big July 26th release, movie theaters already started filling up. On Thursday, July 25th, 2024, visits to AMC, Regal, and Cinemark were up a whopping 231.4% to 249.7% compared to a YTD Thursday average. And Friday, Saturday, and Sunday continued to see visit numbers significantly higher than the YTD visit averages for those days of the week, confirming the movie’s ability to drive visits to theaters. (In absolute terms, Saturday, July 27th was the cinema leaders’ busiest day of the year so far – but since Saturdays tend to be busier than Thursdays, the relative visit spike was somewhat smaller).
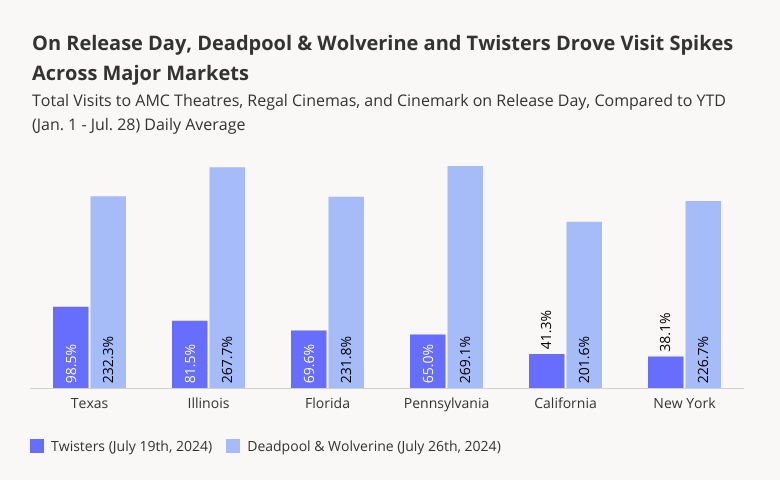
Twister Drives Visits Across Major Markets – Especially in Tornado-Prone Texas
Drilling down into the data for major markets shows that though Deadpool & Wolverine was the runaway hit of the summer, Twisters also drove significant visit spikes throughout the country. And of the major markets, some of Twisters’ biggest visit boosts took place in states with plenty of hands-on tornado experience – like Texas, where July 19th visits to AMC, Regal, and Cinemark (combined) were up 98.5% compared to a YTD daily average.
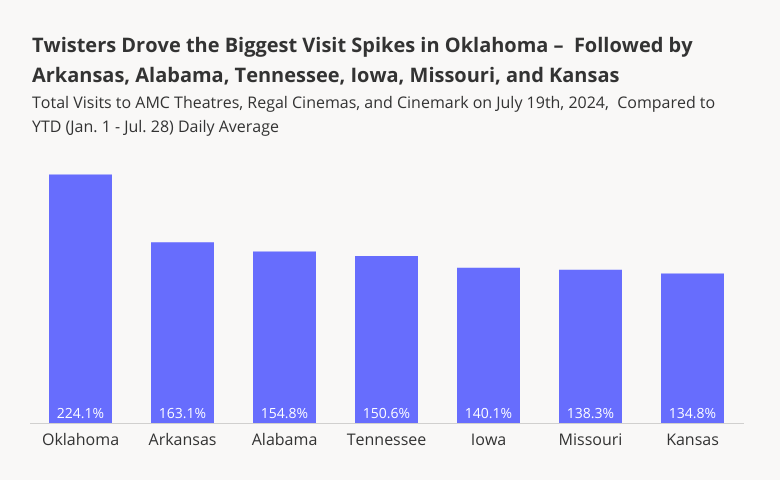
Oklahoma!
Indeed, looking at the states where Twisters drove the biggest visit spikes shows that many of the top performers were in tornado-prone areas. Oklahoma – where much of the movie was filmed – saw the most impressive Twisters foot traffic bump, with visits to leading cinemas up 224.1% on July 19th, 2024 compared to a YTD daily average. And the tornado-focused thriller also drew outsize crowds in other states where the theme of the movie was more likely than average to resonate with local audiences’ personal experiences – including Arkansas, Alabama, Tennessee, Iowa, Missouri, and Kansas.
A Cinematic Marvel
Blockbuster releases like Deadpool & Wolverine, Twisters, and Inside Out 2 highlight the enduring appeal of out-of-home entertainment, and proves that movie theaters are as relevant as ever.
With more highly-anticipated releases still yet to come in 2024, can movie theaters across the country continue to break visit records?
Visit Placer.ai to stay on top of the latest data-driven leisure and entertainment stories.

Ahead of Toyota’s August 1st earnings call, we dove into the data to explore Q2 2024 visitation patterns at Toyota dealerships nationwide. How did year-over-year (YoY) foot traffic to Toyota showrooms perform in Q2 2024 – and what happened in June 2024, when the CDK Global outage caused paralysis across the industry? Who are the customers driving growth for Toyota – and what lies in store for the brand in the months ahead?
We dove into the data to find out.
Bustling Dealerships
During the second quarter of 2024, Toyota subsidiary TMNA (Toyota Motor North America, Inc.) reported a remarkable 9.2% year-over-year (YoY) increase in U.S. Toyota vehicle sales, buoyed by rising demand for hybrid cars. (The company also owns the luxury Lexus line).
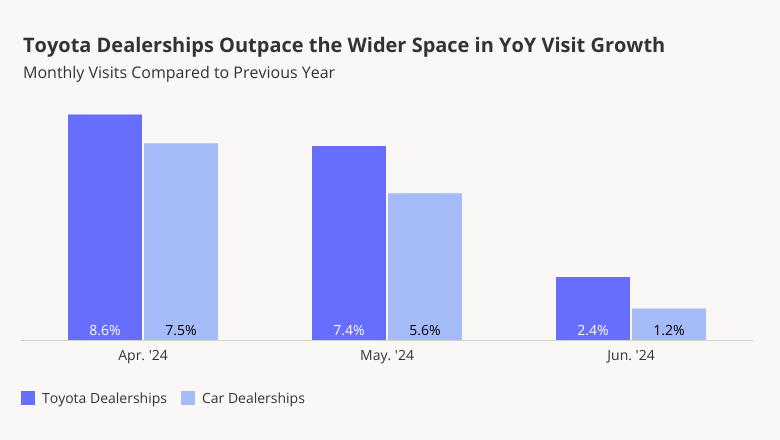
And foot traffic data shows that U.S. Toyota dealerships have indeed been significantly busier in Q2 2024 than in Q2 2023, outperforming the wider space. Apart from the regular portion of repair and maintenance visits, the auto brand’s YoY visit growth also reflects an increase in interested buyers. In April and May 2024, Toyota dealerships saw respective YoY visit boosts of 8.6% and 7.4%. And though the pace of YoY foot traffic growth to dealerships dropped in June 2024 – likely due in part to the CDK outage – the brand appears poised for continued visit success throughout the rest of the year.
Four Wheels for Everyone
Toyota’s outsize success is likely due, in part, to its broad appeal – amongst everyone from price-conscious families seeking to maximize reliability and fuel efficiency to more affluent consumers that place a high premium on style. Toyota’s Certified Used Vehicles offering also draws in customers looking for trustworthy, pre-owned cars.
Analyzing Toyota dealerships’ captured markets with psychographics from Spatial.ai’s PersonaLive shows that their trade areas are economically diverse. Toyota attracts customers from areas with higher-than-average shares of both middle and working-class families, as well as more affluent ones. And Young Urban Singles are also more likely than average to visit Toyota dealerships.
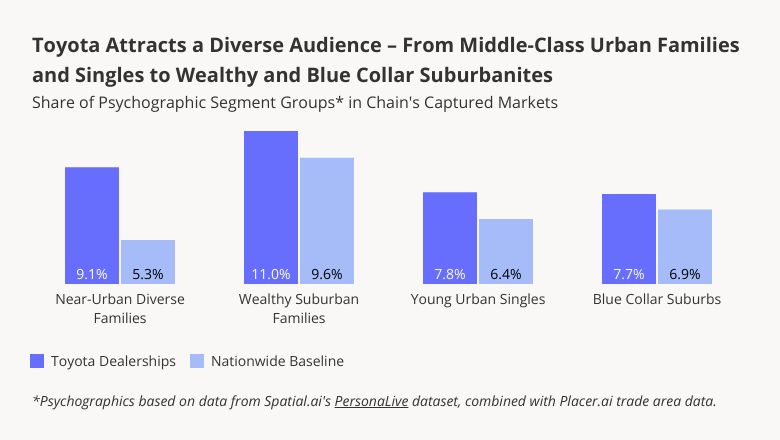
An Increasingly Affluent Audience
Still, in Q2 2024, Toyota dealerships attracted a slightly more affluent consumer than average. The median household income (HHI) of the dealerships’ captured markets was $77.0K, just above the nationwide baseline of $76.1K. And looking at changes in Toyota’s audience over time also shows that the median HHI of its customer base has increased steadily over the past few years – rebounding to, and even exceeding, pre-pandemic levels. In the face of high interest rates, consumers with less room in their budgets may be cutting back on visits to car dealerships. And Toyota’s hybrid first strategy may also be increasing its appeal among more affluent car owners, who are more likely to purchase hybrid vehicles.

Looking Ahead
Will Toyota continue to thrive in the months ahead? And how will its customer base continue to evolve as inflation stabilizes and interest rates eventually come down?
Follow Placer.ai’s data-driven retail analyses to find out.

All-day breakfast mainstays Denny’s and IHOP (owned by Dine Brands) are two of the most popular full-service restaurants (FSRs) in the United States. But though the chains occupy similar niches, there are some differences between them. We dove into the data to check in with the two breakfast leaders – and see how they stack up against one another on key visitation metrics.
Similar Visit Shares and Foot Traffic Trajectories
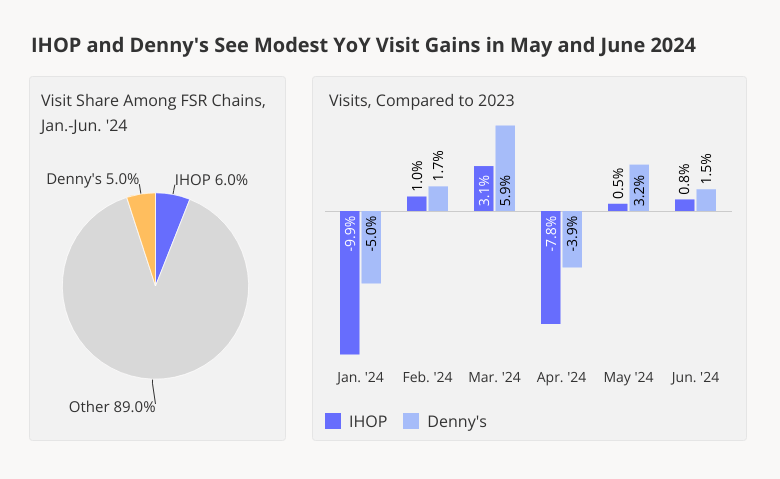
Both Denny’s and IHOP are major players in the FSR space. With its somewhat larger footprint, IHOP captured 6.0% of visits to full-service restaurant chains in the U.S in H1 2024, while Denny’s captured 5.0%. And despite the headwinds that continued to weigh on the sector this year, both chains saw modest YoY foot traffic gains in May and June 2024.
(The relatively big YoY fluctuations that both chains experienced in March and April 2024 are likely due in part to calendar shifts: March 2024 had one more weekend than March 2023, while April 2024 had one fewer weekend than April 2023. The two chains’ YoY June performance was also likely buoyed by an extra weekend in June 2024.)
(Somewhat) Different Audiences
Who are IHOP’s and Denny’s typical customers? Given the two diners’ affordable offerings, it may come as no surprise that both restaurants draw visitors from captured markets with median household incomes below the nationwide baseline of $76.1K – $67.5K for Denny’s and $69.2K for IHOP.* Both chains also draw substantial shares of customers from Blue Collar Suburbs.
But each breakfast leader also draws a unique mix of visitors from a range of segments – with Denny’s attracting higher shares of middle-class urbanites and IHOP attracting higher shares of wealthy and upper-middle-class suburbanites.
Wealthy Suburban Families, for example, made up 9.5% of IHOP’s captured market and 8.1% of Denny’s in H1 2024 – while Young Urban Singles made up 10.5% of Denny’s captured market and 9.2% of IHOP’s. And while Denny’s visitors were more likely to hail from middle-class Near-Urban Diverse Families, IHOP visitors were more likely to be from upper-middle-class Upper Suburban Diverse Families.
The ability of both chains to attract a wide variety of audiences across economic strata is an important factor in their success and staying power.
*Based on STI: PopStats, combined with Placer.ai trade area data for January-June 2024.

Different Calendar Milestones
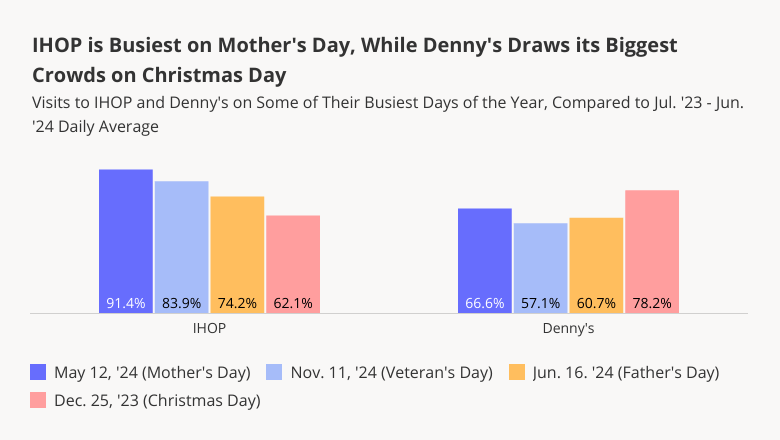
Plenty of people eat at all-day breakfast chains on a regular basis: In June 2024, for example, 16.9% and 14.1% of visitors to Denny’s and IHOP, respectively, frequented the chains at least twice during the month. But for both restaurants, holidays and other special milestones – including Christmas, Mother’s Day, Father’s Day, and Veteran’s Day – drive major visit spikes.
Here too, however, the data reveals important differences between the two chains. Generally speaking, IHOP’s special-occasion visit boosts (compared to annual daily averages) are more substantial than those of Denny’s. And while for Denny’s, Christmas Day is the busiest day of the year, for IHOP, Mother’s Day reigns supreme. And Veteran’s Day – which both IHOP and Denny’s mark with free meals for current and former servicemen and women – is more important for IHOP than for Denny’s.
Similar Weekly Rhythms – With Some Nuances
A look at the daily and hourly breakdown of visits to IHOP and Denny’s shows that the two chains also follow similar visitation patterns – but with a twist. For both restaurants, Sunday morning between 10:00 AM and 1:00 PM is the single most busiest daypart of the week – when many customers likely visit the chains to enjoy leisurely weekend brunches. Predictably, the 10:00 AM to 1:00 PM daypart is also bustling for both breakfast brands throughout the rest of the week.
But though IHOP and Denny’s both have many restaurants that are open 24/7, Denny’s sees a greater share of evening and late night visits than IHOP – perhaps reflecting the chain’s recent push to increase the number of locations open in the wee hours. Between January and June 2024, Friday and Saturday evenings between 10:00 PM and 1:00 AM drew 2.3% and 2.5%, respectively, of weekly visits to Denny’s – compared to just 1.6% and 1.7%, respectively, for IHOP.

Breakfast Buddies
IHOP and Denny’s are two of the most important FSR chains on the category landscape. And location analytics shows that there’s plenty of room at the top for both chains, which despite similar offerings serve audiences with somewhat different profiles and behaviors.
For more data-driven restaurant insights, follow Placer.ai.

The fast-casual space has been having a moment – with rising QSR prices leading many diners to embrace an upgraded experience. So with Q2 2024 in the rearview mirror, we dove into the data to check in with two fast-casual restaurant chains that have been doing particularly well: Chipotle and sweetgreen. How did their Q2 performance compare to that of the wider fast-casual segment? And what is it, exactly, that they are doing right?
We dove into the data to find out.
Key Takeaways:
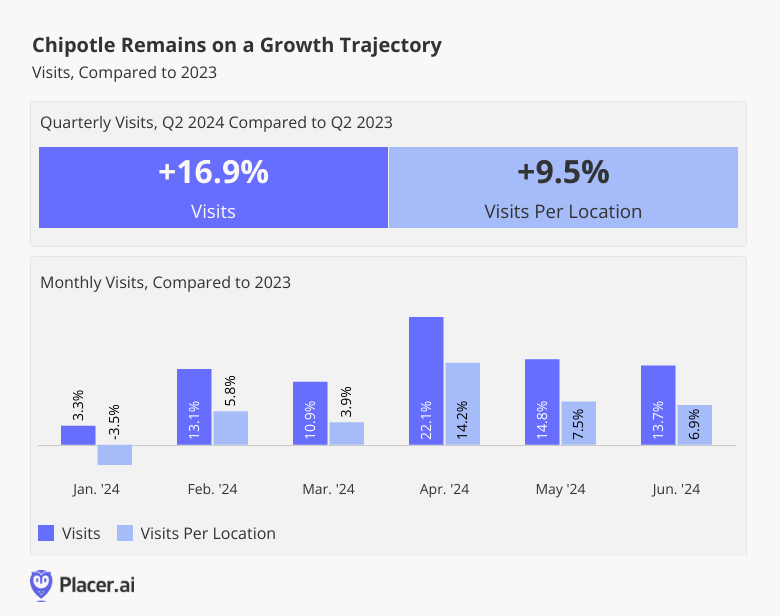
- In Q2 2024, Chipotle saw year over year (YoY) increases in both overall visits (16.9%) and visits per location (9.5%) – outperforming the wider fast-casual segment on both metrics.
- Chipotle’s growth is likely due in part to the growing loyalty of its customer base – which has increased significantly each year since 2019.
- Sweetgreen also performed exceptionally well in Q2 2024, with visits and visits per location up a respective 19.9% and 5.9%.
- Sweetgreen is finding success by leaning into what it does best – drawing the weekday lunchtime crowd.
Chipotle Rocks Q2 2024
In the first quarter of 2024, Chipotle reported a 14.1% YoY increase in total revenue, and a 7.0% increase in comparable restaurant sales. And the chain isn’t showing any signs of slowing down. In Q2 2024, Chipotle saw YoY chain-wide foot traffic growth of 16.9%. And while some of this increase was undoubtedly due to the chain’s continued expansion – Chipotle added some 247 U.S. restaurants over the past year – the average number of visits to each of Chipotle’s restaurants also increased by an impressive 9.5%. By way of comparison, fast-casual restaurants experienced average quarterly YoY visit growth of just 4.2%, and visit-per-location growth of 2.9%.
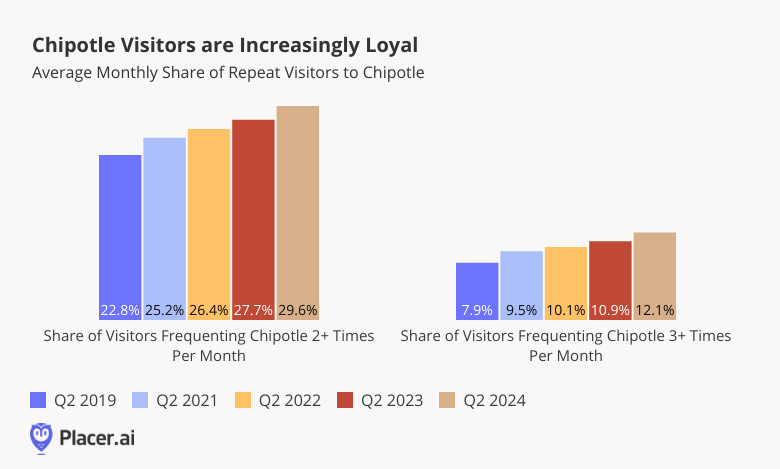
Leaning Into Loyalty
One factor that appears to be contributing to Chipotle’s remarkable visit growth is its repeat customer base – which is growing more loyal with every passing year. Between Q2 2019 and Q2 2024, the share of visitors frequenting a Chipotle at least twice a month increased from 22.8% to 29.6%, while the share of visitors frequenting a Chipotle at least three times a month grew from 7.9% to 12.1%.
This rise in loyalty has taken place against the backdrop of Chipotle’s growing loyalty program – Chipotle Rewards – which launched in Q1 2019 and today boasts more than 40 million members. The program, which lets members earn points for every dollar spent, offers diners access to personalized deals and a range of special promotions – like free delivery on National Burrito Day. (Before you ask, foot traffic data shows that National Burrito Day, which fell on Thursday, April 4th, 2024 wasn’t just a day for ordering online: It was Chipotle’s busiest Thursday of the year so far, with visits up 19.7% compared to a regular Thursday). This April, Chipotle also partnered with Tekken 8 to offer diners in-game currency in exchange for orders – with special perks for Rewards members.
Sweetgreen’s Growing Momentum
Another eatery that has been performing remarkably well in 2024 is sweetgreen – the fast-casual restaurant known for its healthy, fresh food. During Q2 2024, visits to sweetgreen were up a remarkable 19.9% YoY, a reflection of the chain’s growing footprint. But foot traffic data shows that there is more than enough demand to sustain sweetgreen’s accelerated expansion – over the analyzed period, the average number of visits to each sweetgreen location also increased by 5.9%.

A Lunchtime Fave
A look at the hourly distribution of visits to sweetgreen shows that though the chain has made inroads into the dinner daypart, lunchtime remains its prime time to shine – especially on weekdays.
During the first half of 2024, 24.9% of weekday visits to sweetgreen took place between noon and 2:00 PM – compared to just 21.7% for the wider fast-casual category. But while sweetgreen, popular among the in-office crowd, drew a greater share of lunchtime visitors on weekdays, the fast-casual segment as a whole drew a greater share of lunchtime visitors on the weekends. Indeed, on Saturdays and Sundays, the share of lunchtime sweetgreen visitors dropped to 22.7%, while the share of fast-casual lunchtime visitors increased to 22.2%.
Still, suppertime is also a popular daypart for the salad chain on weekdays – with 20.0% of Monday - Friday visits taking place between 6:00 and 8:00 PM. As sweetgreen continues to lean into steaks and other dinner fare, it will be interesting to see if the restaurant begins to capture even more evening traffic.

Looking Ahead
Chipotle’s and sweetgreen’s strong quarter positions them well for further growth as the year wears on. Will Chipotle’s loyalty continue to increase? And will sweetgreen double down on dinner?
Follow Placer.ai’s data-driven restaurant analyses to find out.

How did Petco and PetSmart, the two big-box leaders of the pet sector, fare in early 2024? We dove into the data to find out.
Key Takeaways
- Petco has been outperforming PetSmart in year-over-year (YoY) visits since January 2024. Both brands finished off Q1 (January - March 2024) with minor YoY visit lags of 0.8% and 2.8%, respectively. But in May, visits to the two brands began to perk up – with Petco experiencing a 3.7% YoY foot traffic boost and PetSmart seeing a slight uptick of 0.6%.
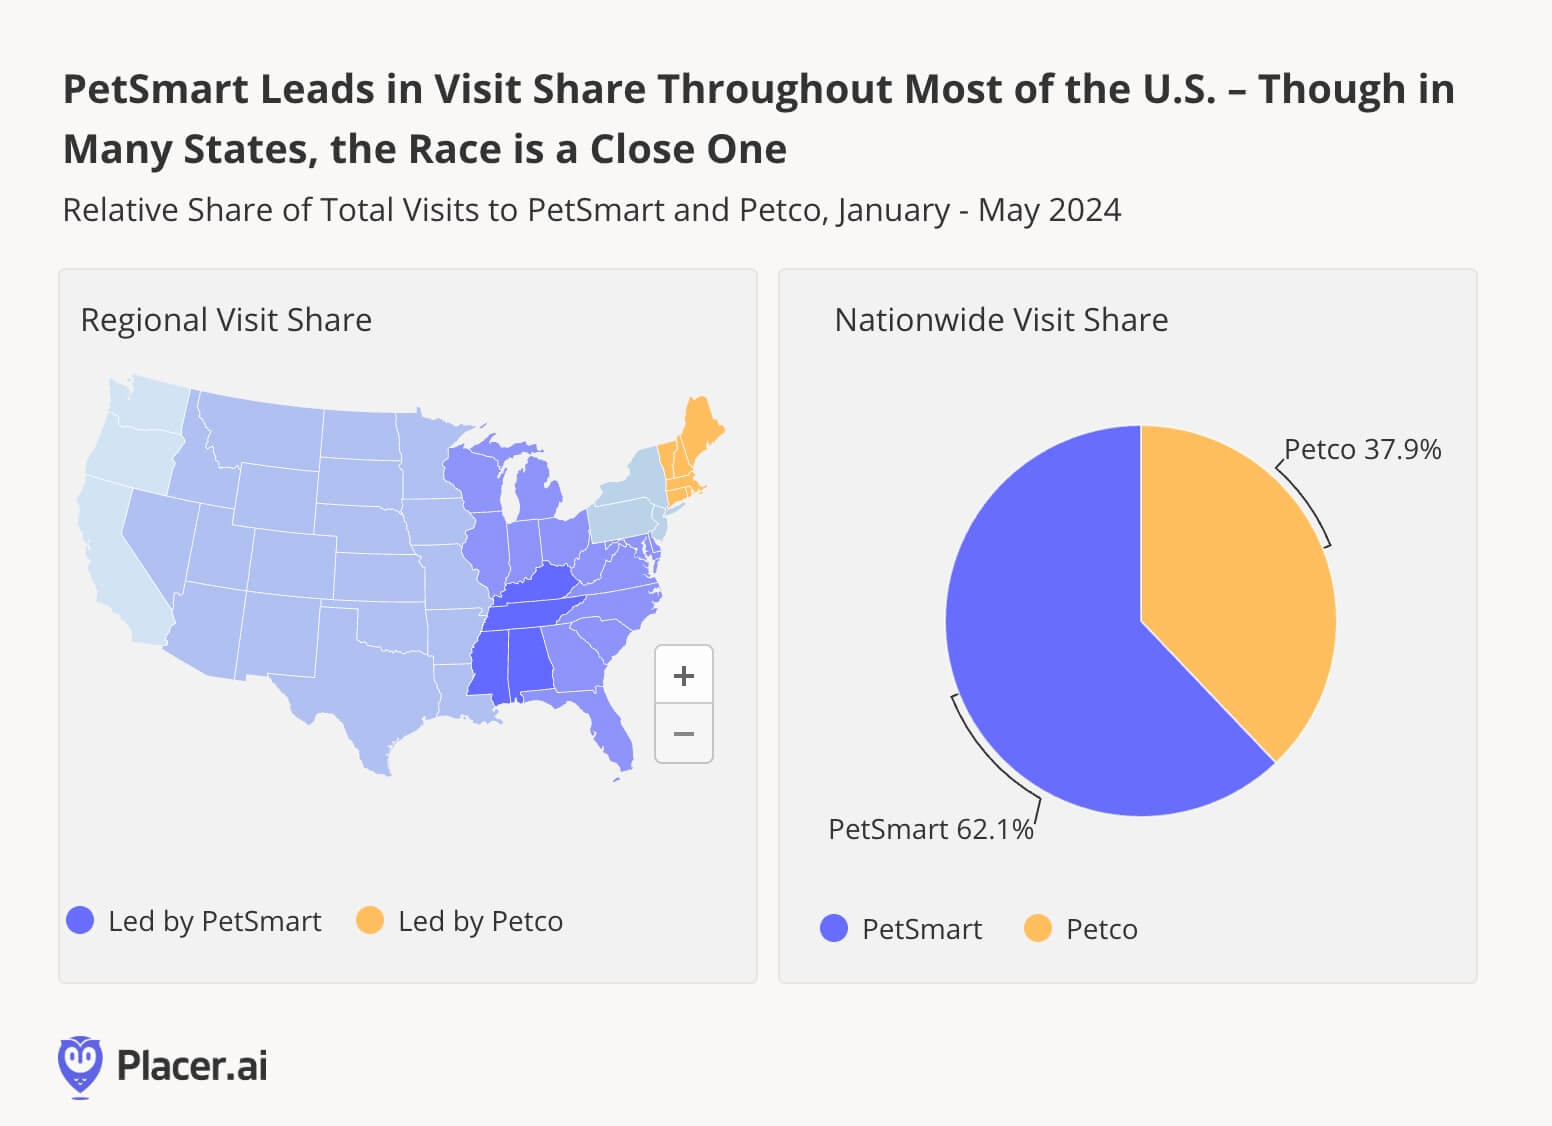
- Still, PetSmart draws more overall visits than Petco: Between January and May 2024, PetSmart drew 62.1% of total foot traffic to the two category leaders, while Petco drew 37.9%.
- Though PetSmart’s greater visit overall share is partially due to its larger fleet, visitation data shows that the chain also boasts a particularly loyal customer base.
Dogged Determination
In recent months, Inflation and sagging consumer confidence have taken their toll on the pet supplies industry, which relies at least partially on discretionary spending, and in its Q1 2024 earnings report, Petco reported a minor YoY drop in revenue. But while Petco saw YoY visit dips in January and April – softened by minor upticks in February and March – visits increased 3.7% YoY in May.
PetSmart, for its part, experienced even more consistent YoY visit lags in early 2024. But like its competitor, the pet supplies giant also saw signs of a potential softening or even reversal of this trend in May. And for both chains, May’s positive showing may be a sign of even better things to come heading into summer.

PetSmart: The Top Dog Nationwide
But while Petco led PetSmart in YoY visit performance in early 2024, PetSmart hasn’t relinquished its position as the most-visited pet store chain in the country. Between January and May 2024, 62.1% of total foot traffic to the two chains went to PetSmart, compared to just 37.9% for Petco, and PetSmart was the top-visited chain in most regions nationwide.
Still, drilling down into statewide-level data reveals a more complex picture. In New England, Petco was the dominant player in early 2024. And in the Pacific region, the two chains were neck in neck.
PetSmart’s visit share lead is partially driven by its larger fleet. But foot traffic data shows that other factors are likely at play as well.
PetSmart Leads in Loyalty
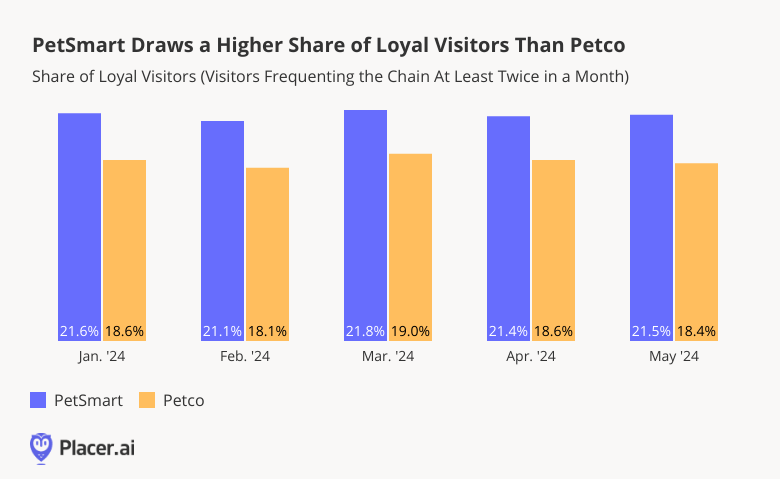
Indeed, though both chains boast loyal visitor bases, PetSmart customers generate more repeat visits than Petco ones – a factor likely further contributing to PetSmart’s increased visit share.
During the first part of 2024, some 21.1% to 21.8% of PetSmart visitors visited the chain at least twice each month – compared to 18.1% to 19.0% for Petco. PetSmart’s enhanced loyalty may be driven in part by the greater selection in-house pet services offered by the chain.
Cool Cats Heading Into Summer
Pet store visits tend to be seasonal – December is generally the industry’s busiest month of the year, followed by March and July. Do Petco’s and PetSmart’s May upticks herald strong July peaks this year?
Follow Placer.ai’s data driven retail analyses to find out.

In June 2024, Placer.ai released three white papers: Unlocking Potential in Underserved Grocery Markets, Brewing Success: Winning Strategies for Coffee Chains, and Advantages of New Players in the Retail Media Space.
Below is a taste of our findings from Brewing Success: Winning Strategies for Coffee Chains – which dove into the data to see how leading coffee chains including Starbucks, Dunkin’, Dutch Bros., and BIGGBY COFFEE are driving coffee visits in 2024.
Coffee on the Rise
Everybody loves coffee. And with some 75% of American adults indulging in a cup of joe at least once a week, it’s no wonder the industry is constantly on an upswing.
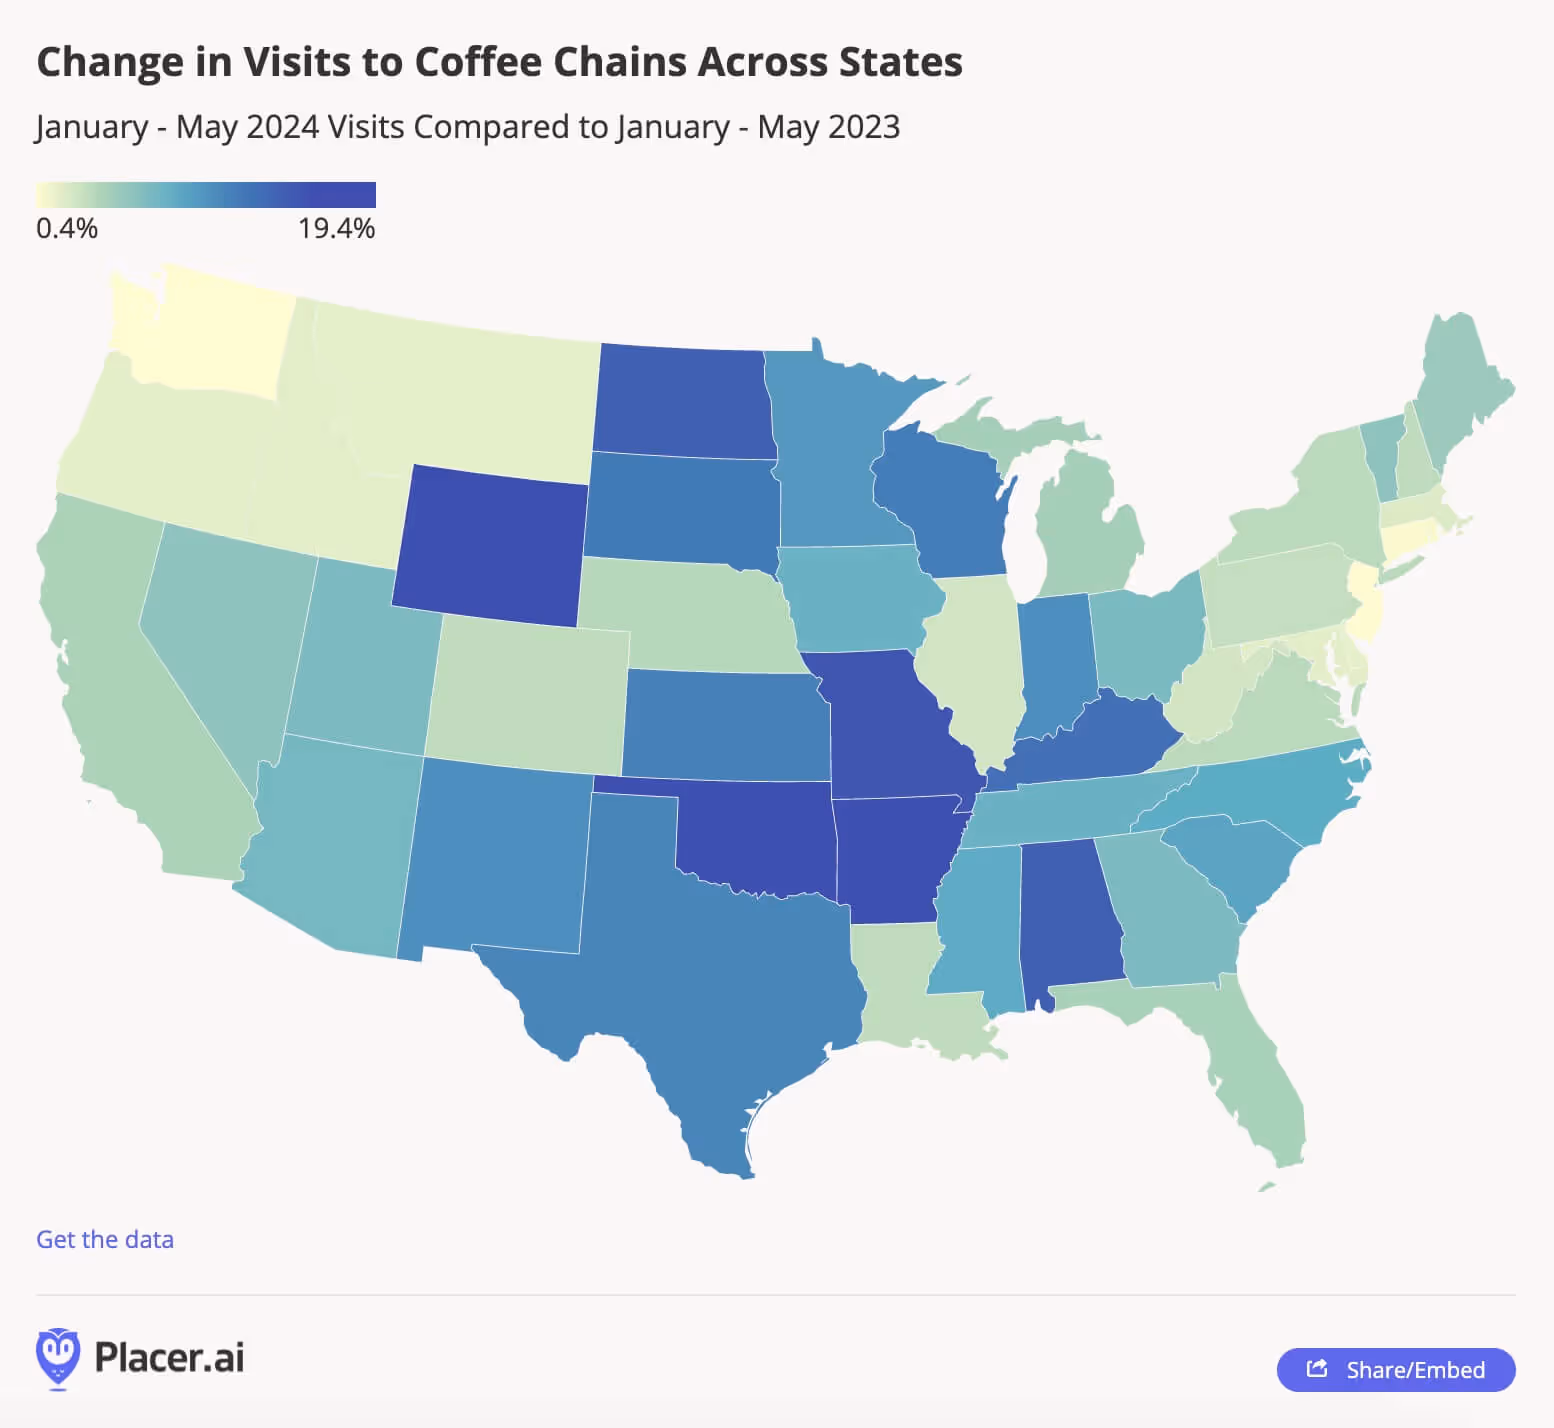
In early 2024, year-over-year (YoY) visits to coffee chains increased nationwide – with every state in the continental U.S. experiencing year-over-year (YoY) coffee visit growth. The most substantial foot traffic boosts were seen in smaller markets like Oklahoma (19.4%), Wyoming (19.3%), and Arkansas (16.9%), where expansions may have a more substantial impact on statewide industry growth. But the nation’s largest coffee markets, including Texas (10.9%), California (4.2%), Florida (4.2%), and New York (3.5%), also experienced significant YoY upticks.
Expanding to Meet Growing Demand
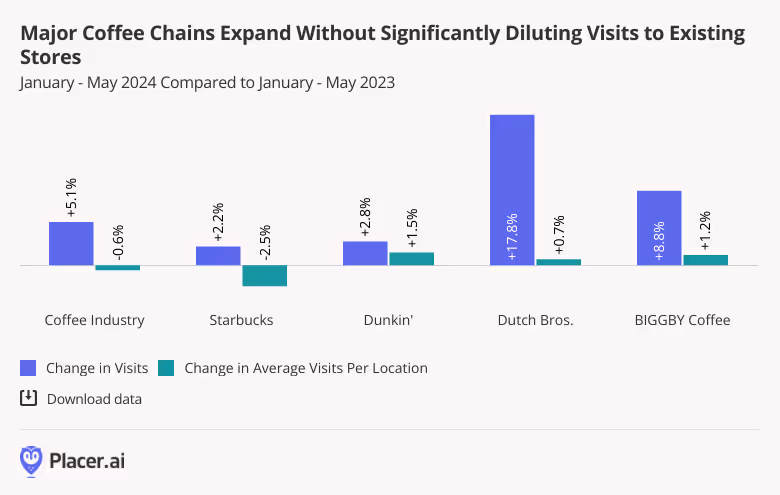
The nation’s coffee visit growth is being fueled, in large part, by chain expansions: Major coffee players are leaning into growing demand by steadily increasing their footprints. And a look at per-location foot traffic trends shows that by and large, they are doing so without significantly diluting visitation to existing stores.
On an industry-wide level, visits to coffee chains increased 5.1% YoY during the first five months of 2024. And over the same period, the average number of visits to each individual coffee location declined just slightly by 0.6% – meaning that individual stores drew just about the same amount of foot traffic as they did in 2023.
Drilling down into chain-level data shows some variation between brands. Dutch Bros., BIGGBY COFFEE and Dunkin’ all saw significant chain-wide visit boosts, accompanied by minor increases in their average number of visits per location.
Starbucks, for its part, which reported a YoY decline in U.S. sales for Q2 2024, maintained a small lag in visits per location. But given the coffee leader’s massive footprint – some 16,600 stores nationwide – its ability to expand while avoiding more significant dilution of individual store performance shows that Starbucks’ growth is meeting robust demand.
Read the full report here to discover more coffee insights. For more data-driven consumer research, visit our resource library.

