


.svg)


A Slow Q3 Amid Industry Headwinds
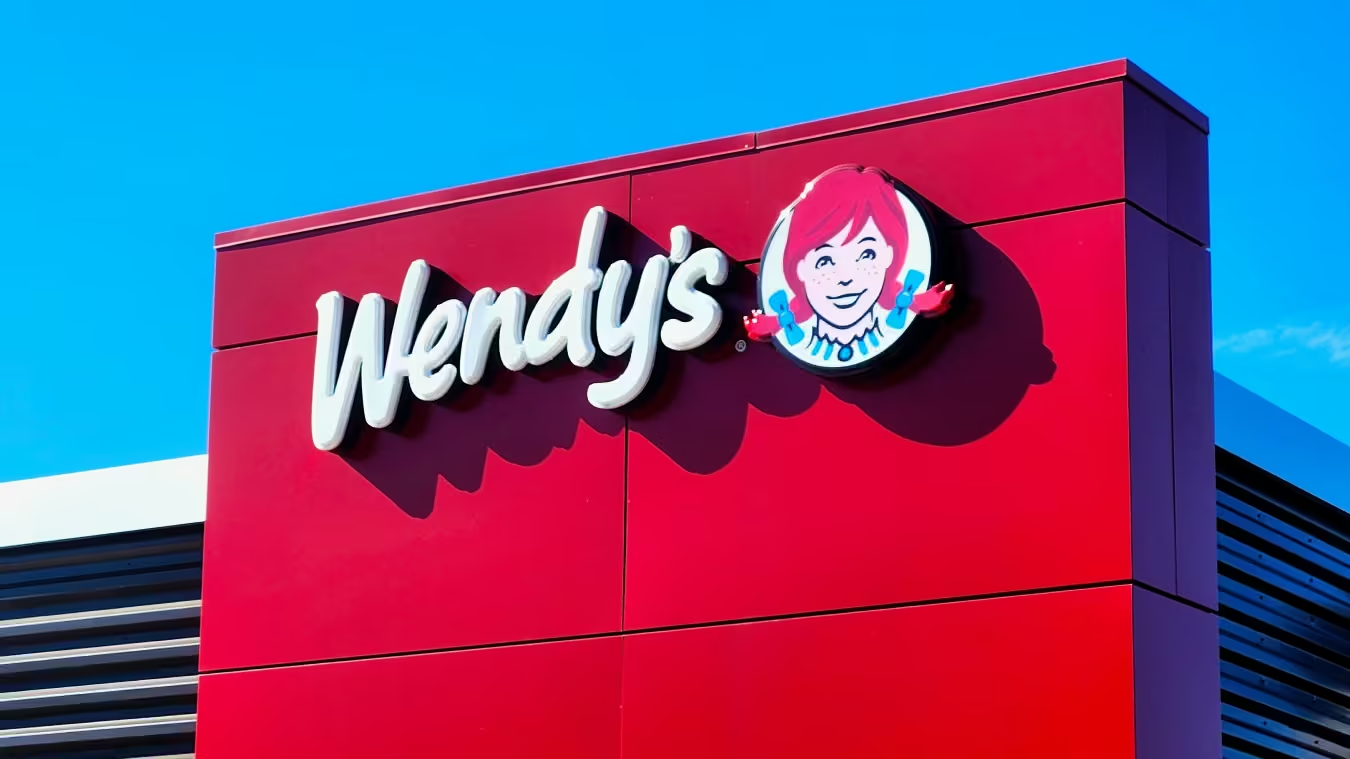
Cautious consumer spending and aggressive discounting across the dining industry have made it increasingly difficult for fast-food brands to sustain steady foot traffic in 2025. And against this challenging backdrop, Wendy’s saw same-store visits decline 6.3% year over year (YoY) in Q3 – with the steepest drop-off occurring in September. Looking ahead, the brand faces an even tougher YoY comparison in October 2025, when it will lap the highly successful Krabby Patty Kollab that fueled an exceptional traffic surge in October 2024.
Focused Specials Showing Promise
On the company’s latest earnings call, executives acknowledged that an overload of overlapping deals had left customers confused. Interim CEO Ken Cook said seeing “eight different deals at point of purchase” made it unclear what guests were coming for. The company has since adopted a “less-is-more” approach, simplifying its promotional calendar to focus on a few high-impact offerings.
And despite the continued slowdown, this simplified approach is showing early promise. On July 14th, 2025, Wendy’s introduced a can’t-miss $1 breakfast biscuit deal that let guests purchase up to five biscuits per morning with no sign-up or purchase requirements. The limited-time offer ran through late August – and even as traffic softened during other dayparts, breakfast visits between 6:00 and 10:00 AM rose 0.9% YoY in Q3, with a sharp 11.6% surge in August. Though the promotion has since ended, its success provides a blueprint for the company as it heads into the last quarter of the year.
Looking Forward
By simplifying its value message, Wendy’s aims to ease decision fatigue and re-energize consumers around clear, compelling offers. And the success of the chain’s summer breakfast promotion suggests that this focused strategy could help restore traffic momentum in the months ahead.
For more data-driven QSR insights, explore Placer.ai's free Industry Trends tool.
Placer.ai leverages a panel of tens of millions of devices and utilizes machine learning to make estimations for visits to locations across the US. The data is trusted by thousands of industry leaders who leverage Placer.ai for insights into foot traffic, demographic breakdowns, retail sale predictions, migration trends, site selection, and more.

Las Vegas has long been a tourism mecca, attracting domestic and international travelers eager to partake of the city’s iconic offerings. However, as economic uncertainty weighs heavily on many would-be vacationers' minds, visits to the city have slowed. We examined H1 2025 data for the city and its legendary Las Vegas Strip (just outside the city limits) to see how domestic tourism slowdowns are impacting the city.
Slowing Travel Nationwide – and in Vegas
Las Vegas, with its iconic vistas, casinos, entertainment options, and convention centers, has long been a favorite domestic tourism destination. But travel patterns have slowed nationwide, and the downturn hasn’t spared the Entertainment Capital of the World. Foot traffic data for out-of-market domestic visitors to Vegas – defined here as those coming from at least 50 miles away – shows a notable decline in tourist visits to the city.
Visits to the city of Las Vegas have dropped consistently since the pandemic, hitting a low in Q1 2025 when out-of-market traffic fell 4.0% YoY. The Las Vegas Strip, which hosts most of the area’s marquee attractions and drives substantial revenue, fared even worse with a 10.6% YoY decline in Q1.
Still, visits to both the city and the Strip picked up somewhat in Las Vegas’ traditionally stronger Q2, a positive sign for the city and perhaps an indication of better things to come.
Vegas High Rollers
Economic uncertainties are likely one of the main reasons for the slowing visits to Las Vegas. And analyzing median household income (HHI) data for the areas supplying out-of-market visitors to the city highlights the economic pressures at play.
In Q2 2019, both the city of Las Vegas and the Strip drew visitors from areas with median HHIs of about $83.0K, with only a slight gap in favor of the Strip. But since then, median HHI trends have shifted, with Las Vegas seeing a subtle but steady rise in median HHI to $88.8K, and the Strip seeing a much more substantial increase to $99.4K.
The steeper climb in median HHI for the Strip’s visits, coupled with its larger visit gaps, suggests that as prices for tourist attractions climb, more budget-conscious visitors may be opting to explore beyond the Strip. Hotel and casino operators, seeing spending on leisure activities soften, are now offering steep discounts to attract additional travel. For local stakeholders, this poses both opportunities and potential downsides: While higher-income visitors may spend more, opening up ample opportunities for operators and retailers, middle-income-focused properties and storefronts face mounting risks. Developing “on-ramps” for value-conscious travelers will be critical to maintaining wide-ranging appeal and driving continued tourism growth.
What’s Next for Vegas?
The shifting profile of visitors presents Las Vegas with both challenges and opportunities. City leaders and industry stakeholders must juggle catering to a more affluent crowd while remaining accessible to budget-minded travelers. Ultimately, the city’s resilience will hinge on a balanced approach – welcoming high-rollers while ensuring that Las Vegas remains a destination for everyone.
Visit Placer.ai/anchor for the latest data-driven travel & leisure insights.

Choppy Discretionary Waters
The past few years have been challenging for many retail categories, particularly those reliant on discretionary spending. For top athletic retailers like DICK'S Sporting Goods, Academy Sports + Outdoors, and lululemon athletica, this has translated into sustained pressure on physical store visits.
Yet Q2 2025 visit results, when viewed against the backdrop of recent earnings reports, tell a more nuanced story. Rather than succumbing to headwinds, these brands are leveraging strategies from expansion to experiential retail – to weather the storm and position themselves for long-term growth.
DICK’s: Experiential Formats to Convert Trips, Not Just Clicks
DICK’S Sporting Goods provides a case study in mitigating traffic declines through higher ticket sizes, digital acceleration, and a pivot toward destination retail. In Q2 2025, overall visits to the company’s flagship chain declined -5.3% YoY and same-store visits fell -4.5%. Monthly performance was volatile: February and June saw the steepest visit gaps – driven partly by calendar effects (February vs. leap year, June 2025 with one fewer Saturday) and compounded by disruptive weather in both months, from winter storms in February to record heat and flooding in the Northeast in June. Meanwhile, as shown in the graph below, foot traffic in March, May, and July was just below 2024 levels.
Despite these ongoing foot traffic headwinds, DICK'S delivered impressive comp sales last quarter, driven by a 3.7% increase in average ticket size and a 0.8% uptick in total transaction – with e-commerce outpacing overall company growth. The company is also taking proactive steps to shore up its brick-and-mortar appeal, expanding its experiential House of Sport and Field House concepts to make its stores destinations in their own rights. And DICK’s recent Foot Locker acquisition appears to serve the same strategy, leaning into categories where in-person trial and discovery are central to purchase decisions.
Academy Sports: New Stores Cushion Visit Softness
Academy Sports + Outdoors also saw same-store visit declines in Q2 2025 (-5.1%), with similar calendar and weather-driven monthly variations. But thanks to strategic fleet expansion, overall quarterly traffic remained relatively stable (-0.9% YoY), with monthly visits even exceeding 2024 levels in May and then again in July.
Online sales (about 10% of the company’s business) also rose 10.2% during the company’s fiscal Q1 (ending May 3rd, 2025), helping offset in-store sales dips and contributing to a 3.7% YoY decline in comps. Academy’s balanced strategy of combining physical expansion with e-commerce strength is enabling the chain to maintain momentum even in a tougher environment.
While Academy widened its guidance range last quarter to reflect macroeconomic risks such as tariff impacts, its continued expansion signals confidence in its long-term trajectory.
Lululemon: Strengths Amidst U.S. Traffic Slowdown
Premium athletic retailer lululemon athletica also continues to face consistently lower same-store visits compared to 2024, with overall visits only moderately better.
Like its peers, the brand’s strength lies beyond foot traffic. Growth in direct-to-consumer (DTC) and digital channels paired with higher transaction values allowed lululemon to deliver Americas comps of -2.0% YoY last quarter – a modest decline given traffic headwinds. At the same time, lululemon is expanding its fleet and accelerating international growth, adding further levers for resilience.
Still, the brand’s challenge is clear: to reignite in-store demand by ensuring its locations serve as premium destinations that justify return visits, especially as competition in athleisure intensifies.
A Blueprint for Resilience
Discretionary pullbacks are weighing on athletic retail in 2025. But a closer look at visit data reveals how leading players are adapting.
DICK’S is thriving via ticket growth and digital acceleration, while seeding future trips with its House of Sport/Field House rollout. Academy Sports kept overall visits nearly flat despite a 5.1% same-store traffic dip by leaning into strategic expansion – while also cultivating double-digit online growth. Lululemon has faced the steepest foot traffic drag, but higher transaction values and a bigger DTC mix helped keep domestic (Americas) comps only slightly negative last quarter as the company continues expanding its fleet and growing internationally.
Still, foot traffic remains a critical pillar of long-term growth. Heading into the holiday season, a key test will be whether these retailers can reverse recent visitation trends and draw more consumers back into stores.
Visit Placer.ai/anchor for the latest data-driven retail insights.

A Q2 2025 Performance Snapshot
In a challenging macroeconomic environment, full-service restaurants (FSRs) face mounting pressure to attract and retain diners. Recent foot traffic data underscores a growing divide among top FSR players:
Brinker International (EAT), parent to Chili’s Grill & Bar and Maggiano’s Little Italy, continued its winning streak with double-digit YoY visit growth in Q2.
Texas Roadhouse’s portfolio (TXRH), featuring its flagship steakhouse, Bubba-33, and Jaggers, saw moderate (+4.1%) YoY overall visit gains and slightly increased same-store visits, reflecting steady performance at existing sites amid ongoing expansion.
Bloomin’ Brands (Outback Steakhouse, Carrabba's Italian Grill, Bonefish Grill, and Fleming's Prime Steakhouse & Wine Bar) experienced YoY foot traffic declines. While Bloomin’ narrowed its YoY visit gap in Q2, it remains squeezed between the aggressive value messaging of chains like Chili’s and the focused execution of competitors like Texas Roadhouse.
Chili’s and Texas Roadhouse: A Study in Strategic Simplicity
What lies behind Chili’s and Texas Roadhouse’s standout success in 2025?
Chili’s visits began to surge in Q2 2024 – the result of a turnaround plan executed by CEO Kevin Hochman after he took the helm in 2022. By reducing and refining the menu, boosting efficiency, and focusing on craveable yet affordable dishes, Chili’s cut costs and funneled the savings into compelling promotions. The company also worked to make its brand more fun and buzzworthy, setting the stage for viral TikTok moments amplified by well-coordinated influencer campaigns. Meanwhile, menu innovations – most notably the Big Smash Burger, added to the company’s “3 for Me” value menu in April 2024 – drove a lasting traffic boost that persisted into 2025 as the chain continued updating its value meal.
Texas Roadhouse, by contrast, has pursued steady expansion over the past several years. Like Chili’s, it relies on a focused, core menu to maintain quality and efficiency, but unlike Chili’s it rarely changes up its offerings, sticking instead to consistently excelling at what it does best. The steakhouse chain also famously forgoes nationwide advertising in favor of local engagement and a strong reputation for everyday value. Although per-location visit growth at Texas Roadhouse softened slightly in early 2025 – perhaps reflecting heightened consumer attention to limited-time offers and special promotions – the steakhouse continues to grow its footprint while limiting cannibalization.
Despite following different paths to growth, Chili’s and Texas Roadhouse have both made focused menus a core tenet of their strategies. And with menu simplification proving effective in today’s crowded market, it is no surprise that Bloomin’ Brands has recently outlined its own plans to cut costs and boost consistency by trimming menus – particularly at Outback Steakhouse.
A Battle for Market Share
Ultimately, foot traffic translates into market share, and both Chili’s and Texas Roadhouse have grown their portions of the overall FSR visit pie. While Texas Roadhouse has steadily augmented its reach over several years, Chili’s saw a sharp surge in H1 2025, propelled by its aggressive value-driven initiatives.
Strategic Outlook: Key Imperatives for H2 2025
The varied performances of Brinker, Texas Roadhouse, and Bloomin’ Brands underscore the critical need for a clear, disciplined strategy in today’s competitive casual dining sector. And Chili's and Texas Roadhouse’s successes demonstrate how menu simplicity and operational efficiency can fuel distinct avenues to success.
As these brands head into the second half of 2025, several questions loom large for executives and investors:
- Brinker (EAT): Can Chili’s maintain its brisk pace of visit growth without eroding margins? Balancing aggressive value offers against inflationary pressures will be critical.
- Texas Roadhouse (TXRH): Will the company see renewed per-location visit growth in 2025? Or will persistent deal-seeking behavior among consumers force it to join the value wars with special promotions and limited-time offers?
- Bloomin' Brands (BLMN): Beyond streamlining its menu, Bloomin’ plans to pivot from frequent limited-time offers to “abundant value” regular offerings. Can this approach thrive in a market increasingly geared toward short-term deals?
The coming months will test whether Chili’s and Texas Roadhouse can maintain their winning formulas – and whether Bloomin’ Brands can course-correct through targeted menu reductions and promotional recalibrations.
For more data-driven dining insights, visit placer.ai/anchor.

Slowing Domestic Migration
Following COVID-era highs, domestic migration levels have begun to taper off – with the number of Americans moving within the U.S. hitting an all-time low, according to some sources, in 2023.
To be sure, some popular COVID-era destinations – including Idaho, the Carolinas, and Utah – saw their net domestic migration continue to rise, albeit at a slower pace. But other states which had been relocation hotspots between February 2020 and February 2023, such as Wyoming and Texas, experienced negative net migration between February 2023 and February 2024.
Hotspots in a Cool Market
Analyzing CBSA-level migration data reveals differences and similarities between last year’s migration patterns and COVID-era trends.
Between February 2020 and February 2023, seven out of the ten CBSAs posting the largest population increases due to inbound domestic migration were located in Florida. But between February 2023 and February 2024, the top 10 CBSAs with the largest net migrated percent of the population were significantly more diverse. Only four out of the ten CBSAs were located in Florida, and several new metro areas – including Provo-Orem, UT, Kingsport-Bristol, TN-VA, and Boulder, CO – joined the list.
This white paper leverages a variety of location intelligence tools – including Placer.ai’s Migration Report, Niche Neighborhood Grades, and ACS Census Data location intelligence – to analyze two migration hotspots. Specifically, the report focuses on Daytona Beach, FL, which already appeared on the February 2020 to February 2023 list and has continued to see steady growth, and Boulder, CO, which has emerged as a new top destination. The data highlights the potential of CBSAs with unique value propositions to continue to attract newcomers despite ongoing housing headwinds.
High Tech's New Frontier – Boulder, CO
The Boulder, CO CBSA has emerged as a domestic migration hotspot: The net influx of population between February 2023 and February 2024 (i.e. the total number of people that moved to Boulder from elsewhere in the U.S., minus those that left) constituted 3.1% of the CBSA’s February 2024 population.
The strong migration is partially due to the University of Colorado, Boulder’s growing popularity. But the metro area has also emerged as a flourishing tech hub, with Google, Apple, and Amazon all setting up shop in town, along with a wealth of smaller start ups.
Moving in from Los Angeles & San Francisco – But Also Chicago, Dallas, and New York
Most domestic relocators tend to remain within state lines – so unsurprisingly, many of the recent newcomers to Boulder moved from other CBSAs in Colorado. But perhaps due to Boulder’s robust tech ecosystem, many of the new residents also came from Los Angeles, CA (6.6%) and San Francisco, CA (3.4%) – other CBSAs known for their thriving tech scenes.
At the same time, looking at the other CBSAs feeding migration to the area indicates that tech is likely not the only draw attracting people to Boulder: A significant share of relocators came from the CBSAs of Chicago, IL (6.1%), Dallas , TX (4.9%), and New York, NY (3.9%). The move from these relatively urbanized CBSAs to scenic Boulder indicates that some of the domestic migration to the area is likely driven by people looking for better access to nature or a general lifestyle change.
Boulder’s Quality of Life Attracting Migration
According to the U.S. News & World Report, Boulder ranked in second place in terms of U.S. cities with the best quality of life. Using Niche Neighborhood Grades to compare quality of life attributes in the Boulder CBSA and in the areas of origin dataset highlights some of the draw factors attracting newcomers to Boulder beyond the thriving tech scene.
The Boulder CBSA ranked higher than the metro areas of origin for “Public Schools,” “Health & Fitness,” “Fit for Families,” and “Access to Outdoor Activities.” These migration draw factors are likely helping Boulder attract more senior executives alongside younger tech workers – and can also explain why relocators from more urban metro areas may be choosing to make Boulder their home.
Boulder’s strong inbound migration numbers over the past year – likely driven by its flourishing tech scene and beautiful natural surroundings – reveal the growth potential of certain CBSAs regardless of wider housing market headwinds.
Sun, Sand, and Daytona Beach
Florida experienced a population boom during the pandemic, and several CBSAs in the state – including the Deltona-Daytona Beach-Ormond Beach, FL CBSA – have continued to welcome domestic relocators in high numbers. The CBSA’s anchor city, Daytona Beach – known for its Bike Week and NASCAR’s Daytona 500 – has also seen positive net migration between February 2023 and February 2024.
An Attractive Destination for Older Americans
Americans planning for retirement or retirees operating on a fixed income are likely particularly interested in optimizing their living expenses. And given Daytona’s relative affordability, it’s no surprise that the median age in the areas of origin feeding migration to Daytona Beach tends to be on the older side.
According to the 2021 Census ACS 5-Year Projection data, the median age in Daytona Beach was 39.0. Meanwhile, the weighted median age in the areas of migration origin was 42.6, indicating that those moving to Daytona Beach may be older than the current residents of the city.
Zooming into the migration data on a zip code level also highlights Daytona Beach’s appeal to older Americans: The zip code welcoming the highest rates of domestic migration was 32124, home to both Jimmy Buffet’s Latitude Margaritaville’s 55+ community and the LPGA International Golf Club, host of the LPGA Tour. The median age in this zip code is also older than in Daytona Beach as a whole, and the weighted age in the zip codes of origin was even higher – suggesting that older Americans and retirees may be driving much of the migration to the area.
Daytona’s Migration Draw Factors
Looking at the migration draw factors for Daytona Beach also suggests that the city is particularly appealing to retirees, with the city scoring an A grade for its “Fit for Retirees.” But the city of Daytona Beach is also an attractive destination for anyone looking to elevate their leisure time, with the city scoring higher than Daytona Beach’s cities of migration origin for “Weather,” “Access to Restaurants,” or “Access to Nightlife.”
Like Boulder, Daytona’s scenery – including its famous beaches – is likely attracting newcomers looking to spend more time outdoors and improve their work-life balance. And like Boulder and its tech scene, Daytona Beach also has an extra pull factor – its affordability and fit for older Americans – that is likely helping the area continue to attract new residents, even as domestic migration slows down nationwide.
Opportunities for Growth Amidst Slowing Migration
Although the overall pace of domestic migration has slowed, analyzing location intelligence data reveals several migration hotspots amidst the overall cooldown. Boulder and Daytona Beach each have a set of unique draw factors that seem to attract different populations – and the success of these regions highlights the many paths to migration growth in 2024.

