Heading into the Q3 2024 retailer reporting period, most expected Walmart to continue gaining market share from essentials-focused retailers. In our coverage of Walmart’s Q2 2024 update, we highlighted the chain’s significant disruption in the grocery category, driven by everyday low pricing, Walmart+ store delivery orders, store remodeling efforts, an improved selection of premium merchandise, and a broadened marketplace offering. These strategies notably boosted visits among higher-income households earning $100,000 or more annually.
While Walmart did indeed disrupt essentials retailers this quarter, what stood out even more was its impact across discretionary categories. Management reported low-single-digit comparable sales growth in general merchandise, with mid-single-digit unit growth offsetting low-to-mid single-digit price deflation. Categories like home, toys, and hardlines led this growth, complemented by strength in beauty, fashion, and apparel. Walmart’s marketplace played a key role in this success, offering consumers a broader selection of brands and items than in-store. Marketplace sales in beauty, toys, hardlines, and home each grew by 20% year-over-year.
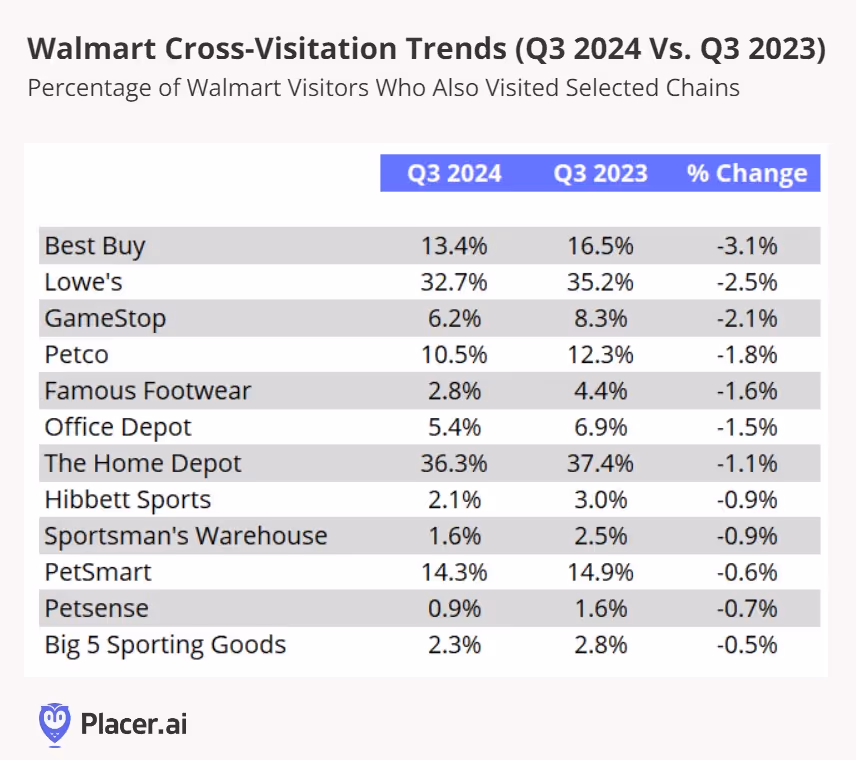
To assess Walmart’s impact on other general merchandise retailers, we analyzed cross-visitation trends. Our data indicates that year-over-year cross-visitation between Walmart and other hardgoods retailers like Best Buy, GameStop, Lowe’s, Home Depot, Hibbett Sports, Sportsman Warehouse, and Big 5—as well as pet retailers like Petco and PetSmart—declined. This suggests a potential shift in consumer behavior, with shoppers consolidating more of their general merchandise purchases at Walmart.
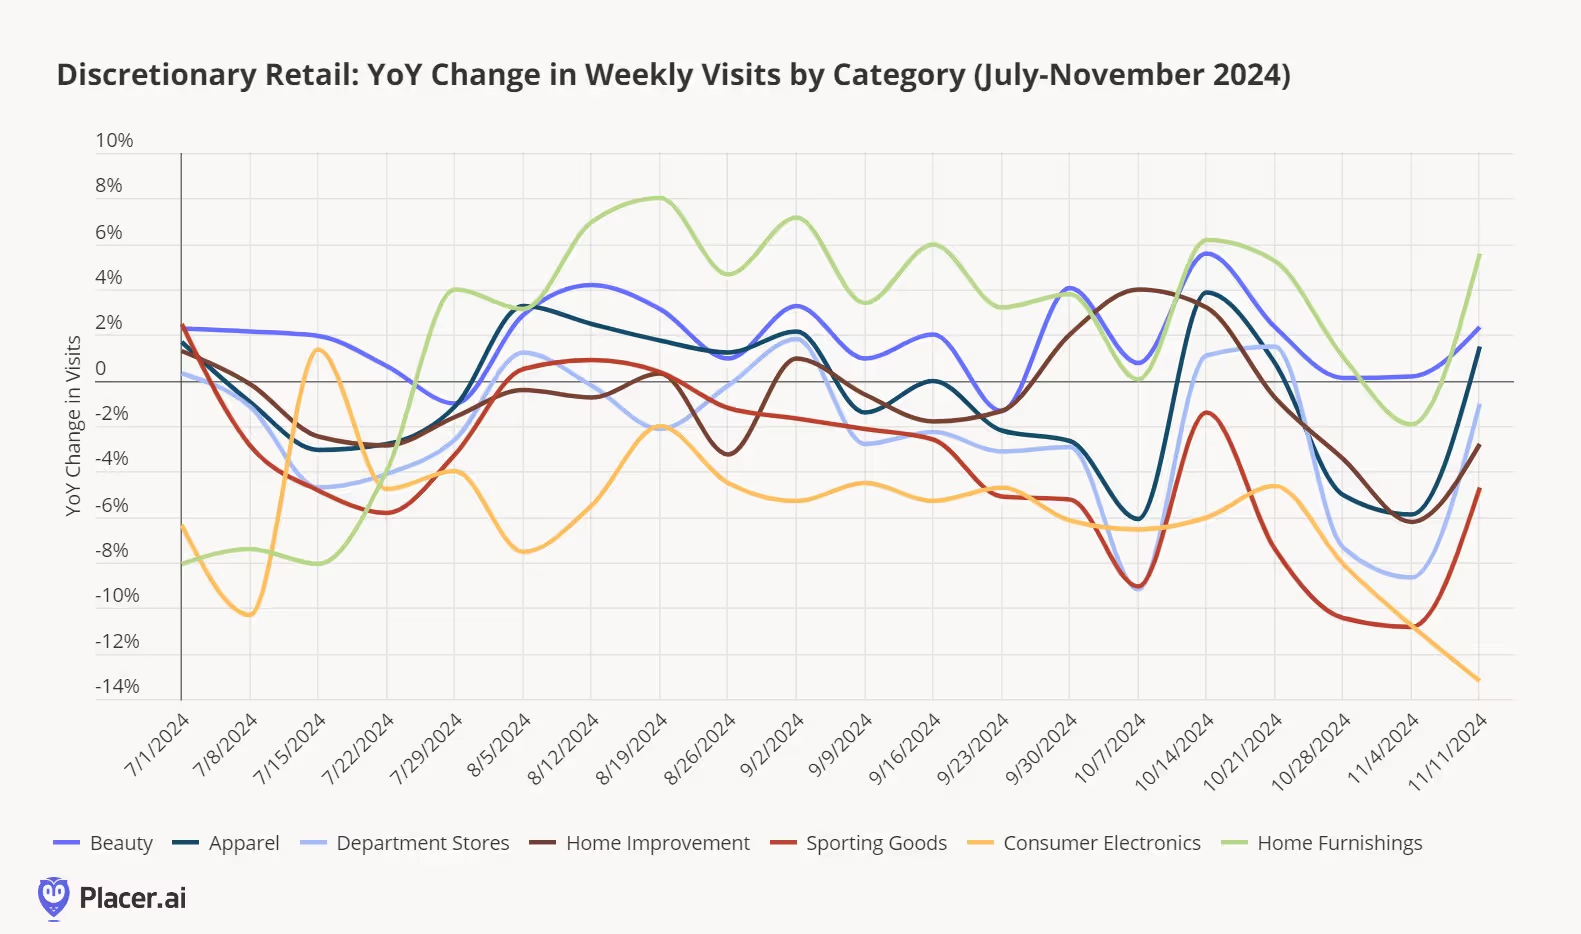
To confirm Walmart's impact on general merchandise, we analyzed visitation trends across several discretionary categories from July to November 2024 (below). With the exceptions of beauty and home furnishings—more on that category in a minute—most categories experienced year-over-year declines throughout much of the August to October quarter. Notably, mid-October brought a temporary improvement in visit trends, coinciding with major promotional events such as Amazon’s Big Deal Days, Walmart’s Holiday Deals Event, and Target’s Circle Week, underscoring how deal-driven consumers are in today’s environment. Following these promotions, shopping activity largely paused until last week, when Black Friday deal announcements began to drive renewed interest.
Home furnishings deserve a closer look. Earlier this year, we noted strong visit trends in housewares retail, and that momentum has largely continued. Mattress retailers, which began the year on a high note, have also maintained positive year-over-year visitation growth in the second half of 2024. Notably, furniture retailers—both value-focused and full-priced—saw year-over-year visitation gains during the quarter, though there was a slight pause in November as consumers waited for Black Friday deals.
These trends align with the third-quarter 2024 update from Williams-Sonoma, where management highlighted improvements in furniture sales at its West Elm and Pottery Barn brands. Additionally, the company cited strength in seasonal items and housewares, suggesting that Walmart’s strong performance in the home category reflects both broader industry trends and its own merchandising improvements. These patterns may also mark the early stages of a new home furnishings cycle as we near the five-year anniversary of the COVID-19 pandemic.
Walmart’s strong performance in discretionary categories serves as a warning to other discretionary retailers to elevate their strategies ahead of the holiday shopping season. With in-store merchandise enhancements and a robust third-party marketplace offering access to over 700 million stock-keeping units (SKUs), Walmart is positioned to be even more competitive this holiday season.
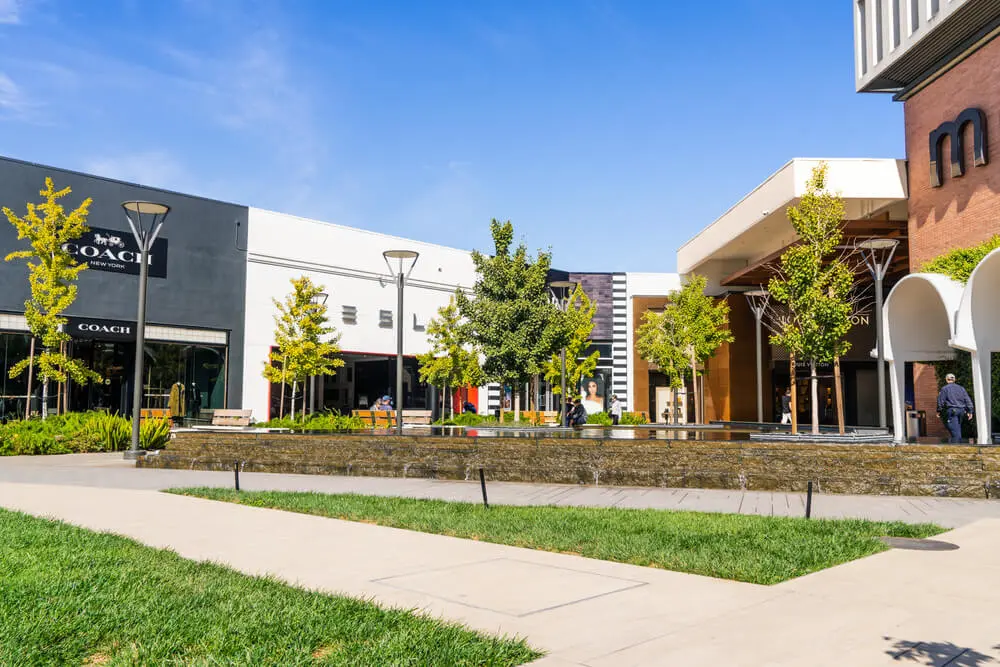
With the rise of hybrid and remote work, we’ve observed a notable shift in everyday consumer behaviors, particularly around fitness, shopping, running errands, and grabbing takeout. Without the need to commute on certain days, it’s easier for consumers to squeeze in a workout or make a quick trip to a store. Local outdoor shopping centers have become prime beneficiaries of this new “pop-in, pop-out” behavior. Here, we explore some of the brands poised to thrive in this evolving landscape.
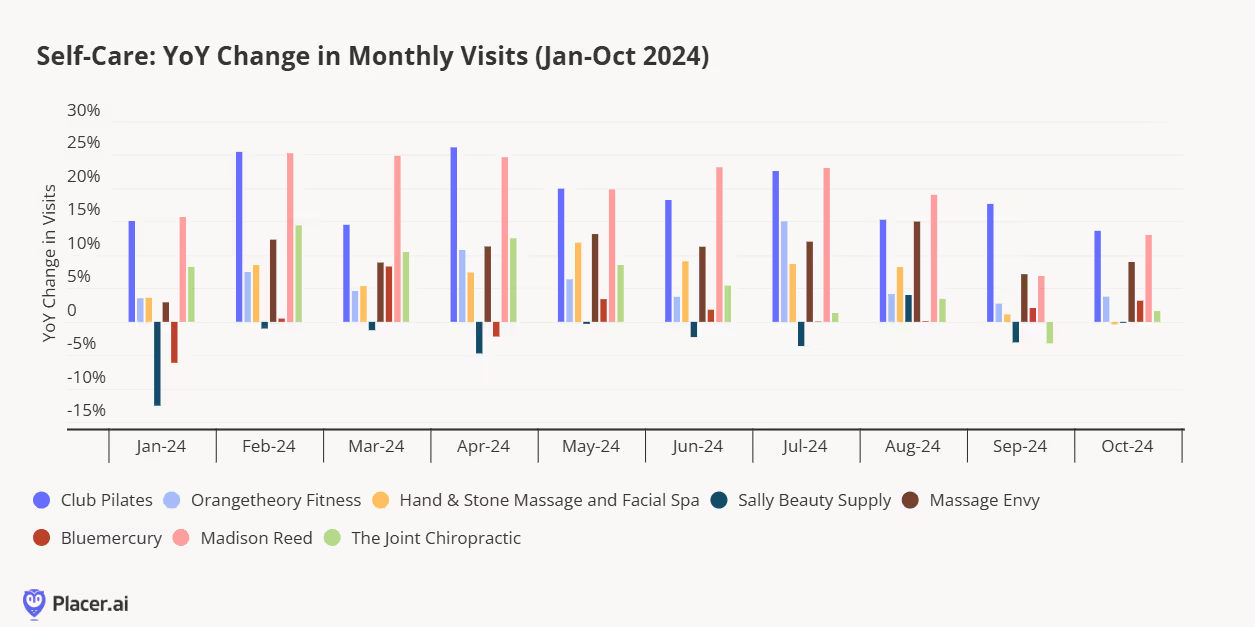
At the start of this year, we predicted that the beauty category boom we witnessed last year would persist, with wellness and self-care becoming integral parts of that definition. For many, self-care includes a good workout, whether low-impact or high-intensity. We've previously highlighted fitness trends, with brands like Club Pilates and Orangetheory Fitness continuing to demonstrate year-over-year growth. A perfect post-workout activity might include a massage or chiropractic session to ease sore muscles or restore alignment—services that have driven increased traffic for brands like Massage Envy and Joint Chiropractic. Another standout is Madison Reed, which offers "salon results without salon cost or time" and continues to expand its footprint.
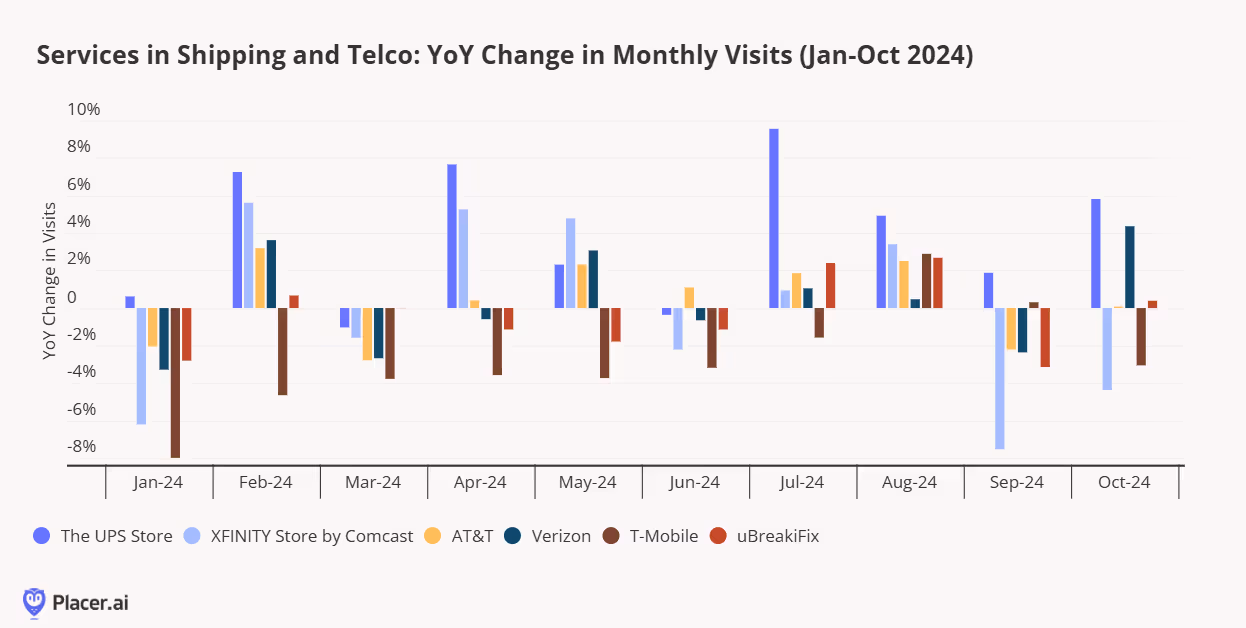
The next group of brands stands out for their ubiquity—you’re likely to find one or more of these stores in any local outdoor shopping center. UPS is indispensable for shipping and returning items, serving as a go-to for everyday logistics. Meanwhile, telecommunications and internet service providers like AT&T, Verizon, T-Mobile, and Xfinity maintain a steady customer base, driven by the regular upgrade cycle for cell phones and service plans.
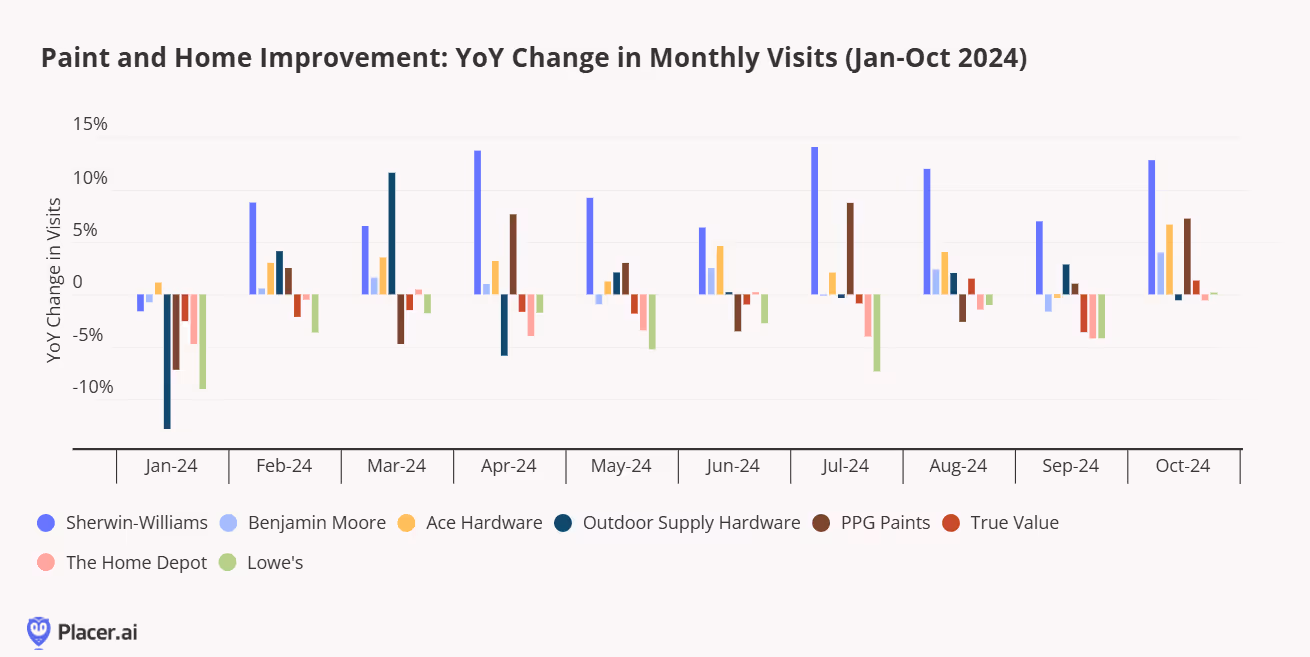
Another home improvement and furnishings replacement cycle may be upon us. Pandemic-driven nesting behaviors accelerated demand in previous years, but now, many consumers are cautiously approaching this phase. Instead of investing in big-ticket items like dining or living room furniture, there’s growing enthusiasm for budget-friendly updates, such as applying a fresh coat of paint. Sherwin-Williams stands out as a key player, experiencing increased foot traffic. This rise in paint store visits could signal a positive trend for future investments in home improvement, redecorating, and refurnishing.
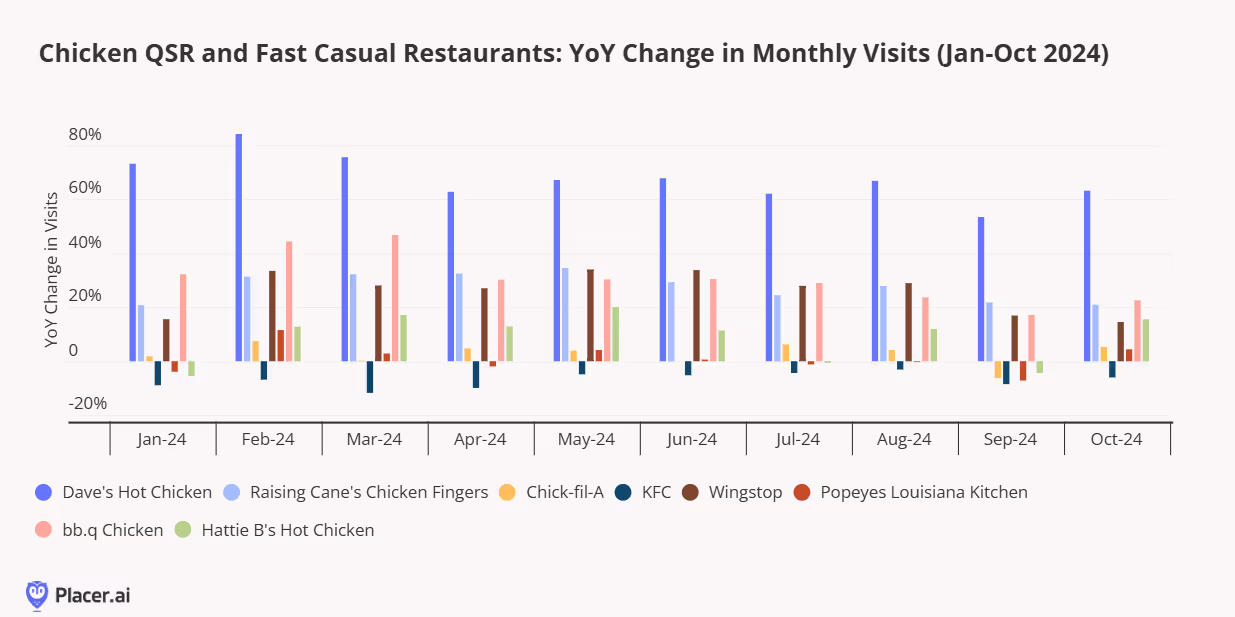
Next, we have some tasty additions perfect for local outdoor shopping centers. Americans’ love affair with chicken shows no signs of slowing down. Dave’s Hot Chicken has developed a cult following for its juicy, flavorful chicken, while Raising Cane’s draws loyal fans for its irresistible tenders and signature sauce. Bb.q Chicken offers a unique twist, boasting over a dozen wing flavors, including Caribbean Spice, Hot Mala, and Cheesling cheese dust.
With Black Friday just a week away, it's the perfect time to reflect on the state of retail and what lies ahead over the next 28 days as consumers prepare for holiday gatherings, celebrations, and gift-giving. The retail industry in 2024 has been anything but consistent—some categories continue to thrive, others have struggled, and a few are clawing their way back to prominence.
This year’s holiday season is likely to follow a similar pattern, but the key differentiator is time. As we highlighted in our TL;DR newsletter on LinkedIn this week, the 2024 holiday shopping period has five fewer days compared to last year, reminiscent of the 2019 vs. 2018 holiday timeline. Holiday shopping kicked off earlier this year, with department stores seeing increased activity in October. With a condensed holiday window, it’s now up to retailers to drive more frequent visits and encourage consumers to linger longer in their stores.
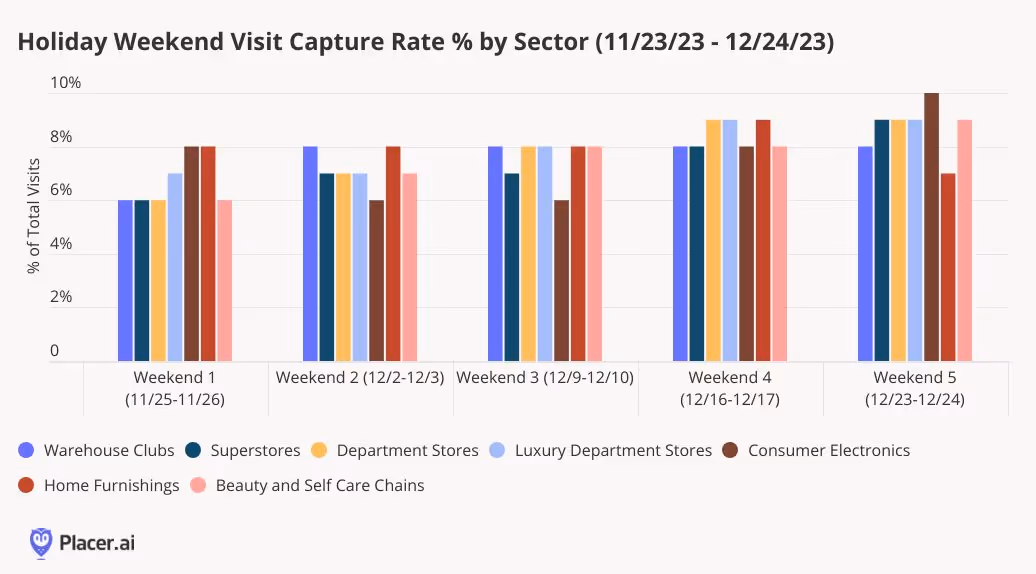
Analyzing daily visits during last year’s holiday season, there were five weekends compared to four this year. Across key holiday gifting retail categories in 2023, those five weekends (Saturday and Sunday combined) accounted for 39% of total holiday season visits, defined as Thanksgiving Day through Christmas Eve. Individually, each weekend contributed between 7% and 9% of total sector visitation, with the last two weekends each capturing 9%. In 2024, each weekend would need to account for approximately 10% of total holiday season visits to match last year’s pace.
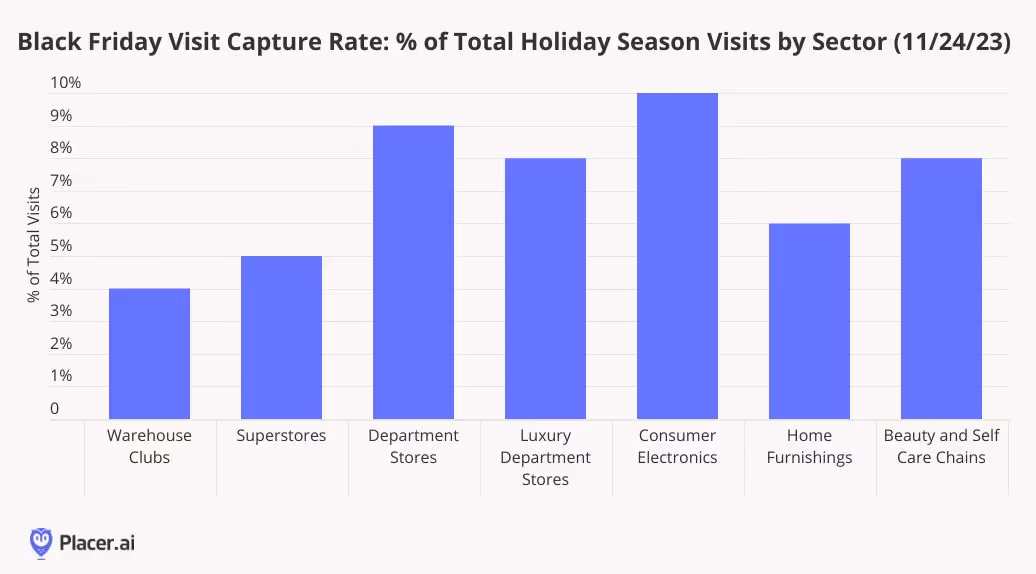
One advantage of having fewer weekends between Thanksgiving and Christmas is the reduction in lull periods, which are traditionally challenging for retailers trying to attract visitors. This year, two of the four weekends include Black Friday weekend and Super Saturday. In 2023, Black Friday alone accounted for 7% of total holiday visitation across the analyzed sectors, meaning a strong Black Friday could help offset the impact of having fewer weekends. By sector, Black Friday holds particular importance for department stores and consumer electronics retailers, as they typically see a higher share of visits on that day compared to other categories.
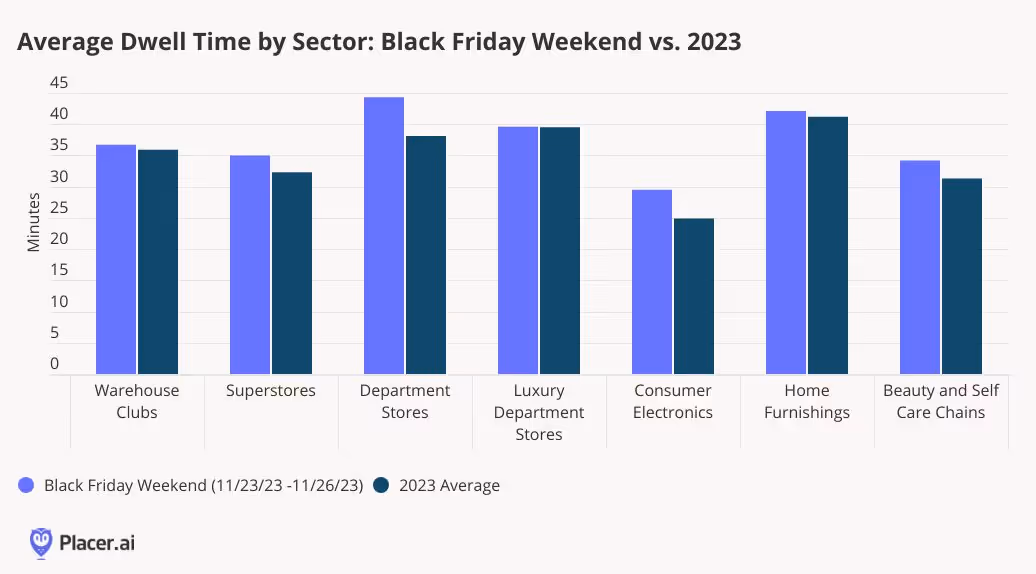
Another way to offset the five fewer shopping days? Increasing the time consumers spend in stores. In 2023, dwell times during Black Friday weekend (Thursday–Sunday) were, on average, three minutes longer than the full-year average across the analyzed sectors. Department stores had the largest gap, with visitors staying six minutes longer than average on Black Friday, followed by consumer electronics, superstores, and beauty retailers. These sectors are among the most popular for holiday shoppers during Black Friday weekend, making it encouraging that visitors stayed longer while seeking holiday deals.
A final advantage for physical retail is that fewer shopping days mean a shorter delivery window for e-commerce. With less time to shop, the holidays could sneak up on consumers, potentially driving more visitors into stores this year. While this is purely speculative, our enthusiasm for physical retail at Placer compels us to make at least one bold prediction!
Over the past few years, discount retailers Five Below and Ollie’s Bargain Outlet have grown both their footprints and audiences. How did they fare in Q3 2024, and what might they expect this holiday season? We took a look at the data to find out.
Lila Margalit
Nov 21, 2024
4 minutes
The past several years have been a boom period for affordable indulgences – with consumers tightening their purse strings and finding inexpensive ways to treat themselves. Against this backdrop, discount specialty retailers Five Below and Ollie’s Bargain Outlet have been growing their footprints – and their audiences. But have the two chains reached their growth ceilings? How did they fare in Q3 2024 – and what can they expect this holiday season?
We dove into the data to find out.
Growing Audiences
Five Below opened a record 205 new stores last year, leaning into growing consumer demand for low-cost toys, decor, and other indulgences. And though the chain announced plans to moderate fleet growth following a below-target Q2 2024, visit data shows that overall, the chain remains well-positioned for continued success. In Q3 2024, Five Below’s growing footprint fueled a 13.8% chain-wide year-over-year (YoY) visit boost. Though the average number of visits to each individual Five Below location remained slightly below 2023 levels, the chain’s visit-per-location gap narrowed to 1.6% from 4.3% in Q2. And in some key growth markets, Five Below saw significant increases in both YoY visits and visits per location: California, one of Five Below’s biggest regional markets and the focus of a major expansion push this year, saw visits per location grow 4.4% amidst a 21.6% overall visit increase.
Ollie’s Bargain Outlet is another value-focused specialty retailer that has benefited from consumer trading down in recent years. And foot traffic data highlights the success of Ollie’s ongoing expansion: In Q3 2024, foot traffic to Ollie’s increased 7.5% YoY, while the average number of visits to each Ollie’s location also increased slightly by 0.9%. Though this represents a smaller visit-per-location increase than that seen in Q2, Ollie’s ability to maintain strong per-location visit levels while increasing its store count shows that the chain’s offerings are still meeting robust demand. And Ollie’s shows no sign of slowing down – snapping up former Big Lots store leases and plotting westward expansion.
What About the Holidays?
Five Below and Ollie’s are both popular holiday shopping destinations. But what can the two retailers expect this year?
Visit data shows that Five Below and Ollies experience holiday milestones somewhat differently. Ollie’s, with its broad selection of deeply discounted high-ticket items, sees a slightly bigger Black Friday spike than Five Below: On November 24th, 2023, visits to Ollie’s surged by 222.9% compared to a 2023 daily average, higher than Five Below’s none-too-shabby 204.1%.
Meanwhile, the run-up to Christmas is is Five Below’s time to shine – with visits slowly increasing throughout December before reaching a crescendo on Super Saturday. In 2023, Five Below’s busiest day of the year was December 23rd, as customers flocked to the chain to pick up stocking stuffers, festive decor, and other inexpensive holiday items. Ollie’s, on the other hand, saw a more moderate 171.7% Super Saturday visit increase. As Five Below continues to expand its pricier “Five Beyond” offerings, Black Friday may take on greater importance for the retailer in coming years.
But while Ollie’s visit peaks were more subdued than those of Five Below throughout most of the holiday season, the chain’s treasure hunt vibe consistently drew longer visitor dwell times. On Black Friday last year, 26.5% of visitors to Ollie’s remained in-store for more than 45 minutes, compared to just 18.3% at Five Below. And despite Ollie’s significantly smaller Super Saturday crowds, customers spent substantially more time browsing its aisles to snag the perfect bargain find.
Looking Ahead
Five Below and Ollie’s both appear poised to enjoy a busy holiday season. Will the retailers deliver?
Follow Placer.ai’s data-driven retail analyses to find out.
With its numerous grocery store banners, The Kroger Co. is one of the largest grocery purveyors in the country. We took a look at some of the visitation patterns at its largest chains to see how they have fared over the past few months, and what might lie ahead for them this Thanksgiving.
Bracha Arnold & Lila Margalit
Nov 20, 2024
3 minutes
The Kroger Co. has come a long way from its humble beginnings as a single grocery store in downtown Cincinnati, Ohio, in 1883. Today, the brand operates over 2,700 stores under its numerous grocery store banners.
We analyzed the visitation patterns at some of Kroger’s largest chains to see how these brands have fared over the past few months, and looked at what last year’s visit data can tell us about the upcoming Thanksgiving holiday.
Visits To Kroger Banners Show Stability in Q3
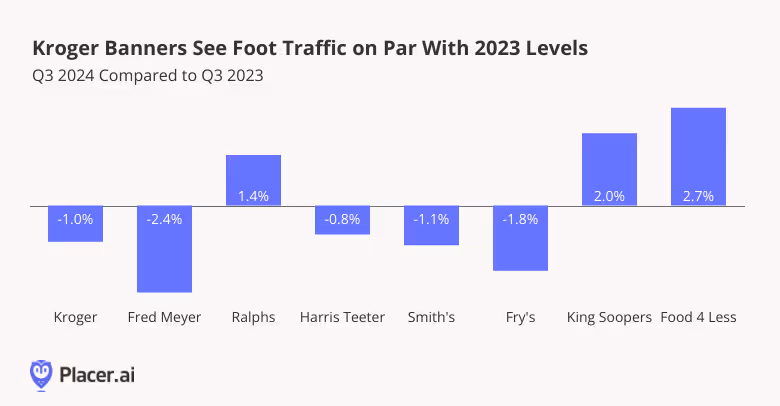
The Kroger Co.’s various grocery banners vary in size and scale, with its eponymous banner Kroger – more than 1200 stores across much of the midwest and south – attracting the largest visit share relative to the company’s full grocery portfolio. Kroger’s other major regional chains, including Harris Teeter (mid and south atlantic states); Ralphs (California), King Soopers (primarily Colorado), Food 4 Less (California, Illinois, and Indiana), Smith’s (Mountain states), Fry’s (Arizona), and Fred Meyer (Pacific northwest), lend the company considerable presence nationwide.
On the whole, visits to the analyzed Kroger chains remained fairly close to 2023’s levels, with visits to Kroger, Fred Meyer, Harris Teeter, Smith’s, and Fry’s sustaining minor YoY visit gaps. No-frills value chain Food 4 Less enjoyed 2.7% YoY visit growth in Q3, likely buoyed by the same trading down behaviors that have propelled growth at other low-cost supermarkets this year. Ralphs and King Soopers also saw YoY visit growth, perhaps aided by California and Colorado’s relatively high median household incomes (HHIs) – $94.1K and $89.1K, respectively, according to data from STI: PopStats, compared to the nationwide baseline of $76.1K.
Shoppers Lingering at Discount, Hypermarket Options
Kroger’s extensive reach allows it to appeal to a wide range of grocery shoppers. The company operates both discount grocery chains, such as Food 4 Less, more upscale ones like Harris Teeter, and everything in between.
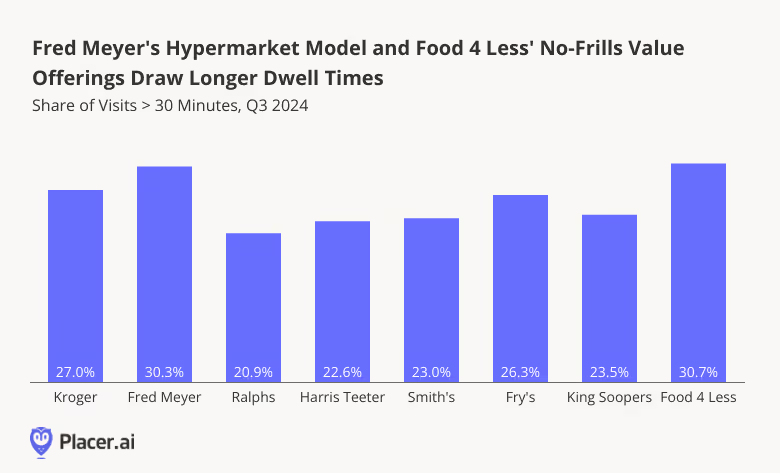
Diving into the share of visits lasting 30 minutes or longer at individual Kroger banners reveals substantial variation, with Fred Meyer and Food 4 Less receiving the highest shares of long visits among the analyzed chains. In Q3 2024, 30.3% of Fred Meyer visits and 30.7% of Food 4 Less visits lasted over 30 minutes – a stark contrast to Ralphs (20.9%), Harris Teeter (22.6%) and King Soopers (23.5%).
This variance in dwell times may reflect the differing offerings of each chain. Hypermarket Fred Meyer provides a wide range of services beyond groceries – including pharmacies, department stores, and jewelry offerings – which could encourage shoppers to spend more time exploring. And Food 4 Less falls squarely into the discount grocery segment, one that often sees customers spending more time in-store searching for the best deals.
Turkey Wednesday Poised to Bring the Crowds
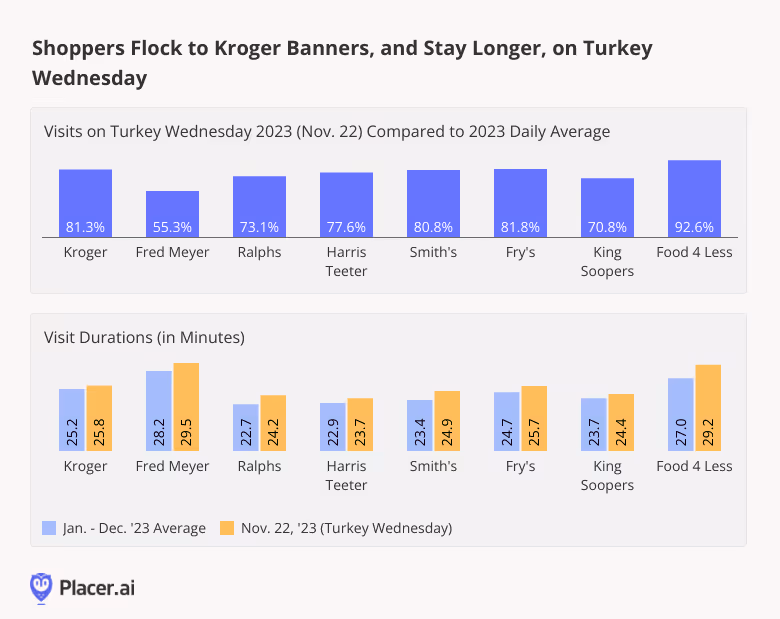
While not (yet!) an official holiday, Turkey Wednesday – the day before Thanksgiving – is one of the most important days of the year for grocers as shoppers flock to stores to pick up last-minute items for their upcoming feasts.
And while Thanksgiving is still over a week away, analyzing trends from previous years can help grocers prepare for the coming frenzy. On November 22nd, 2023 – the day before Thanksgiving – visits across all analyzed Kroger chains shot up between 55.3% and 92.6% compared to the daily visit average for 2023. And visitors at each of the chains stayed longer in-store than they typically did during the rest of the year.
With visits to Kroger’s major banners either nearly on par with or ahead of last year’s levels, the company appears well-positioned to enjoy another year of strong Turkey Wednesday visits.
Final Thoughts
If previous years are any indication, Kroger’s grocery banners should be preparing for a surge in Thanksgiving shopping. Will visits outpace those of last year?
Visit Placer.ai to keep up with the latest data-driven grocery insights.
With the year almost over, we dove into the visitation data for off-price leaders to see how the TJX chains, Burlington, and Ross Dress for Less are positioned ahead of the holidays.
Shira Petrack
Nov 19, 2024
3 minutes
With the year almost over, we dove into the visitation data for off-price leaders to see how the TJX chains, Burlington, and Ross Dress for Less are positioned ahead of the holidays.
Off-Price Still Going Strong
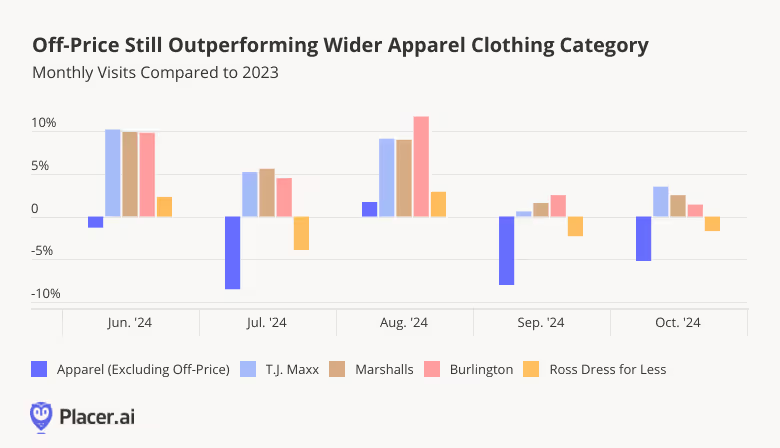
The off-price segment continued to outperform the wider apparel category in recent months as consumers continued favoring budget-friendly retail outlets. Visits to TJX-owned T.J. Maxx and Marshalls as well as to Burlington remained elevated, with the three chains seeing YoY growth of 5.1%, 5.5%, and 6.4% in Q3 2024. And while Ross foot traffic declined slightly relative to 2023 in July, September, and October, the chain’s YoY visit gap remained significantly smaller than that of the wider apparel category.
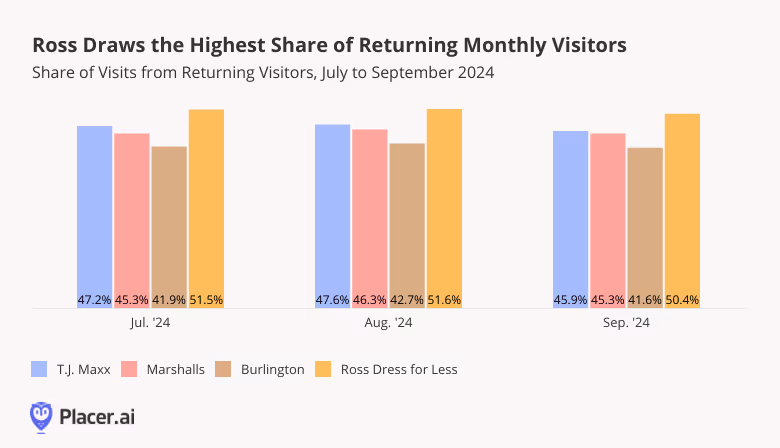
Ross Attracts the Most Loyal Following
And even as Ross lags slightly behind the rest of the off-price space, the chain leads the segment in one metric – the share of returning visitors every month. In Q3 2024, over half of Ross’ monthly visits came from visitors who visited the chain at least twice in the month, compared with 41.9% - 47.6% of visits from returning visitors for the other three off-price leaders.
This data indicates that Ross is already extremely successful at cultivating a loyal clientele that regularly visits the company’s stores – and adding new shoppers to its circle of dedicated customers could drive further YoY visit growth going forward.
Off-Price Leaders Stay True to Their Audience
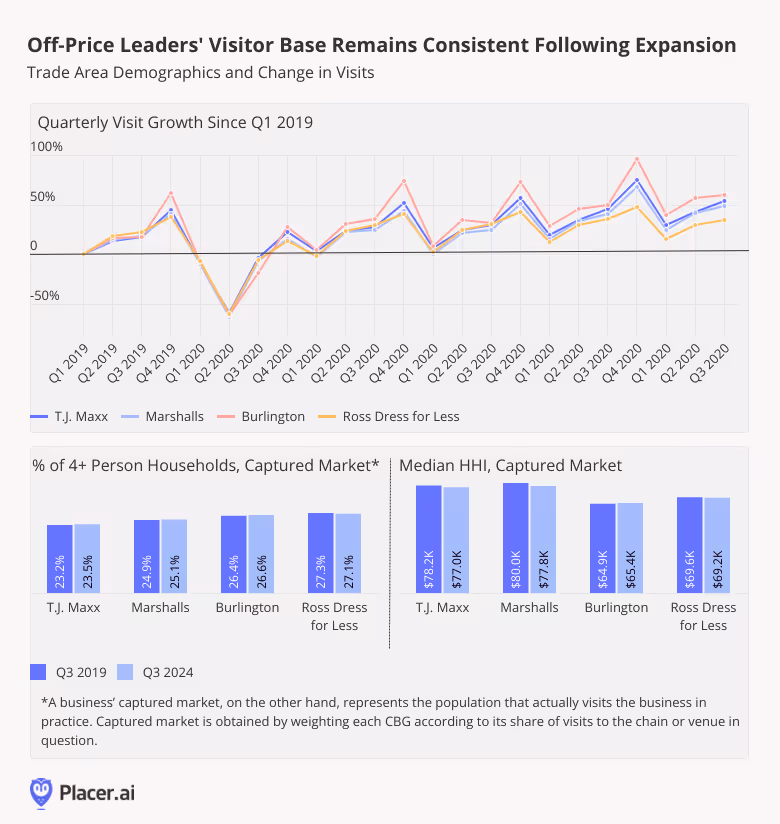
Expansion has been a major driver of off-price growth in recent years. Since 2019, the four off-price chains analyzed have all greatly increased their brick-and-mortar footprints, leading to visit surges nationwide.
And impressively, T.J.Maxx, Marshalls, Burlington, and Ross have all managed to expand their physical reach dramatically without straying from their core audience. Diving into the four chains’ trade area demographics in Q3 2019 and Q3 2024 reveals that, even as the retailers’ store fleet configurations evolved, their trade area demographics remained strikingly consistent.
Since 2019, the share of large households in the retailers’ trade areas has remained remarkably steady – though all four brands have seen a slight increase in the share of 4+ person households. The trade areas’ median household incomes (HHIs) did shift slightly as the chains expanded – falling for T.J. Maxx and Marshalls, and, to a lesser extent, Ross, while increasing somewhat for Burlington – but the change from 2019 has been minimal.
It seems, then, that these four off-price leaders have successfully grown their reach over the past five years while maintaining a strong connection with their core customer base, positioning them for continued sustained success in the competitive retail landscape.
As the holiday season approaches, the off-price retail sector remains resilient. The year-over-year growth and high loyalty rates seen by category leaders along with their success at expanding without alienating their core audiences positions these chains to remain a formidable force within the wider retail landscape.
For more data-driven retail insights, visit placer.ai/blog.
Discover how mall anchors are transforming in 2025 – and how a foot-traffic-focused approach to choosing key tenants can drive visits and shopper engagement.
May 29, 2025
8 minutes
Key Takeaways
1. Experiential and niche retailers can deliver anchor-level traffic. At Towne East Square Mall, the addition of a Scheels in 2023 significantly increased foot traffic and long-distance travelers, while Barnes & Noble at Coronado Center in Albuquerque has become a key driver of both foot traffic and higher-spend demographics.
2. Size isn’t everything – especially for dining venues. At Glendale Galleria and Northridge Fashion Center, smaller restaurants attracted more foot traffic than some traditional anchors.
3. Refocusing on tenants’ actual traffic contributions enables a flexible anchor approach. Balancing weekend draws like Scheels with weekday favorites such as Costco or Chick-fil-A can help maintain steady visitor flow throughout the week. Similarly, onsite fitness clubs can shift traffic to earlier in the day – an opportunity to adjust store hours and capture additional morning shoppers.
4. Temporary pop-ups can form an integral part of a visit-focused anchor strategy. The Barbie Dreamhouse Living Truck Tour generates mall visit spikes well above typical Saturday levels. Operators can integrate these events into their overall anchor strategies, offering preferential terms to high-performing pop-ups.
5. New tenants can boost traffic for existing stores in similar categories. After Aldi joined Green Acres Commons in February 2020, visits to an existing BJ’s Wholesale Club trended upwards. This synergy highlights how overlapping audiences can become a strength, creating a larger overall customer base.
The Retail Comeback Kid
Malls, it seems, are cool once again. After languishing in the wake of the pandemic, shopping centers across the country are thriving – reinventing themselves as prime “third places” where people can hang out, shop, and grab a bite to eat.
One key driver behind this resurgence is a shift in how malls view their anchor tenants. While traditional mainstays like Macy’s and JCPenney still play an important role, specialized offerings – from popular eateries to fitness centers and immersive retailtainment destinations – are increasingly taking center stage. These attractions maximize the experiential value that brick-and-mortar venues can deliver, driving visits and sales for the center as a whole.
Against this backdrop, this report leverages the latest location intelligence data to explore the types of tenants that can function as mall anchors in 2025. Should mall operators still focus on general merchandisers to draw crowds, or can dining chains and more niche retailers also do the job? How important is square footage in identifying the anchor-like tenants in a shopping center? And how can a visit-focused approach help mall operators select effective anchor or anchor-like tenants – whether to fill big-box spaces or to leverage the leasing perks traditionally reserved for major large-format chains?
Out-of-the-(Big)-Box Visit Drivers
One of the most important functions of a mall anchor is to ensure steady visitation – providing its smaller tenants with a constant flow of potential customers. And as the role of the mall continues to evolve, analyzing the actual foot traffic impacts of different types of businesses can help identify the kinds of non-traditional anchors best suited to fulfill that purpose.
The Power of a Well-Placed Scheels
Experiential venues, for example, are particularly well-poised to serve as powerful anchors in today’s retail environment – as illustrated by the visit surge experienced by Towne East Square Mall in Wichita, KS following the addition of a Scheels in July 2023.
By blending traditional retail with immersive experiences, Scheels has emerged as a true experiential destination. And this pull has also helped the mall draw more long-distance visitors willing to travel to enjoy Scheels’ offerings. In 2024, 41.9% of the mall’s customers traveled more than 50 miles to visit, compared to 35.8% back in 2018 when Sears occupied the same lot.
Scheels Anchor Brings Substantial Visit Boost to Towne East Square Mall in Wichita, KS, Attracting Visitors From Further Away
Visits to Towne East Square Mall Compared to Q1 2018 Baseline
Share of Visitors From 50+ Miles Away
Share
Embed:
The Barnes & Noble Effect
Traditionally, anchors aimed to please the widest possible audiences – with department stores, big-box chains, and grocery stores leading the way. But visitation data shows that niche concepts can also deliver anchor-level traffic if they’re compelling enough to attract dedicated fans.
The experience of the Barnes & Noble at Coronado Center in Albuquerque, NM is a case in point. After being written off as all but obsolete, Barnes & Noble has staged an impressive comeback in recent years, finding success through a more curated, localized approach to book selling. And despite not being a formal anchor, the Coronado Center Barnes & Noble accounted for 7.9% of visits to the mall in 2024 – outperforming both Macy’s and JCPenney.
Year-over-year data also shows foot traffic surging at the Coronado Center Barnes & Noble, lifting overall visitation to the mall. And demographic data reveals that the bookstore draws a more affluent audience than either the center as a whole or the two department stores – attracting a crowd with more spending power.
This example also illustrates how smaller tenants can sometimes draw larger crowds. Even though Barnes & Noble occupies a smaller onsite space than either Macy’s or JCPenney, it is proving a powerful visit driver out of proportion to its physical size.
Dining Chains Punching Above Their Size
Dining chains are also adept at punching above their square footage – often attracting crowds disproportionate to their size.
Despite its relatively small footprint, for example, the In-N-Out Burger at Glendale Galleria drew an impressive 8.6% of visits to the mall complex in 2024, outpacing some of the mall’s official anchors like DICK’s Sporting Goods, Macy’s, and JCPenney. Still, the onsite Target drew even larger crowds at 14.4% of visits.
A similar pattern emerged at Northridge Fashion Center, where Porto’s Bakery and Cafe captured a notable 15.6% of visits to the complex in 2024 – more than some of the center’s traditional department stores.
These examples underscore the potential for dining chains, which typically require less space, to serve as micro-anchors by consistently attracting outsized crowds – a key consideration for mall operators looking to sustain visitor traffic.
Choosing a Mall Anchor in 2025
Refocusing on tenants’ actual foot traffic contributions also opens the door to a more flexible and dynamic approach to anchor selection and management – one that considers each venue’s unique visitation patterns.
The Weekend/Weekday Divide
Seasonal factors, for example, can make certain anchors more powerful at specific times of the year, while different venues shine on particular days of the week.
At Jordan Creek Town Center in West Des Moines, Iowa, for instance, Scheels and Costco each delivered just under 20.0% of the complex’s overall visits in 2024. But the two retailers’ daily patterns differed significantly: Scheels saw bigger crowds on weekends, while Costco was the primary weekday destination.
Understanding differences like these can help operators optimize their tenant mix to maintain a balanced flow of shoppers throughout the week.
Another example of the impact of differing weekday traffic patterns is offered by the impact of mall-based Chick-fil-A locations on the distribution of mall visits throughout the week.
Despite its relatively small size, Chick-fil-A draws substantial traffic to malls. And after adding Chick-fil-A locations, both Northridge and Miller Hill Malls saw meaningful drops in the share of visits to the centers taking place on Sundays – even as the wider indoor mall segment saw slight upticks.
Recognizing this trend could prompt mall operators to compensate by adding more weekend-friendly traffic drivers – or to lean into this distinction by taking additional steps to bolster the mall’s role as a go-to weekday destination.
The Early-Morning Fitness Advantage
The power of different mall traffic magnets also varies throughout the day. Increasingly, shopping centers are turning to fitness centers as experiential anchors. And since many people work out early in the morning, these gyms are having a significant impact on the distribution of mall visits across dayparts.
The addition of gyms to Northshore Mall in Peabody, MA and Jackson Crossing in Jackson, MI, for instance, led to a significant rise in visits between 7:00 AM and noon. And though the rest of the stores in these malls typically open at 10:00 or 11:00 AM, this shift presents the centers with a significant opportunity.
By adjusting opening hours to accommodate these early-morning patrons, malls can capitalize on this added traffic, driving up visits and sales for relevant tenants – especially health-focused retailers such as juice bars and sporting goods stores.
Adding Temporary Pop-Ups Into the Mix
Adopting a broader, visit-focused view of anchoring also allows mall operators to apply some of the strategies typically reserved for anchors to non-conventional traffic-generating businesses, to ensure a consistent flow of traffic year-round.
Pop-up stores and events, for example, generally don’t follow the same seasonal trends as other retailers – instead, they generate short-term visit boosts during their runs, whenever in the year that may be. And a visit-focused anchor strategy can leverage some of the perks traditionally reserved for anchor tenants – such as preferential leasing terms – to complement traditional full-time anchors during slower retail periods.
The Barbie Dreamhouse Living Truck Tour is a prime example of a traffic-driving pop-up. By bringing exclusive merchandise to malls across the U.S., the truck generates plenty of buzz, drawing crowds eager to snatch up limited-edition items and immerse themselves in all things Barbie. As a result, malls hosting the tour often see significant visit spikes, with foot traffic surging well above typical Saturday levels. Well-timed pop-ups like these can help balance out traffic throughout the year, offsetting traditional slow periods.
Creating a Bigger Visit Pie
A visit-focused approach to anchor management can also help mall operators assess the potential impact of new tenants on existing stores operating in similar categories. For example, mall owners often worry that new tenants operating in similar categories might cannibalize existing businesses. But a visit-focused anchor approach reveals that a well-chosen addition can sometimes benefit current tenants – especially if they cater to similar audiences.
In February 2020, for instance, value supermarket Aldi opened at Green Acres Commons in Valley Stream, NY – a center that already hosted budget-friendly BJ’s Wholesale Club. While BJ’s visits were relatively flat in 2018 and 2019, they began to rise after Aldi’s opening (and following a pandemic-induced dip). Cross-shopping data also shows that Aldi customers were more likely to visit BJ’s than the average Green Acres patron last year.
This synergy may be due in part to the two retailers’ similar visitor bases: In 2024, the Aldi and BJ’s stores in Green Acres Common drew shoppers with comparable economic profiles. This suggests that overlapping audiences can become a strength if aligned brands attract new shoppers, who then explore multiple stores in the same center.
Visits to BJ's Wholesale Club Took Off After Addition of Aldi to Green Acres Commons – Perhaps Buoyed by Audience Similarity
Visits to Green Acres Commons BJ's Wholesale Club, Compared to Q1 2018 Baseline
Median HHI, 2024*
Cross-Shopping, 2024
*Median HHI based on STI: PopStats dataset combined with Placer.ai data for captured trade areas.
Looking ahead, effective mall anchors will be defined less by physical footprint and more by their capacity to maintain consistent, valuable foot traffic. While traditional department stores remain pivotal, smaller or niche brands can often rival – or surpass – large-format retailers. And by thinking out of the anchor box and choosing tenants that cultivate a balanced visitor flow and align with local preferences, operators can position their centers as true go-to destinations.
Dive into the data to see the trends shaping the grocery space in 2025 and uncover actionable insights for strategic decision-making in the competitive food-at-home market.
May 15, 2025
8 minutes
Key Takeaways:
1. Shoppers are taking more, shorter trips to grocery stores.Over the past 12 months, grocery stores have experienced nearly uniform YoY visit growth. And since COVID, the segment has steadily increased both overall visits and average visits per location – even as average dwell times have consistently declined.
2. Grocery stores are holding ground against fierce competition. Despite growing inroads by discount and dollar stores, wholesale clubs, and general mass retailers like Walmart and Target, grocery stores have maintained their share of the overall food-at-home visit pie over the past several years.
3. Grocery visit share is most pronounced on the coasts. In Q1 2025, grocery stores claimed the majority of food-at-home visits on the West Coast, in parts of the Northeast, Mid-Atlantic, and Mountain Regions, and in Florida and Michigan.
4. Fresh-format, value, and ethnic grocery visit shares are growing at the expense of traditional chains. And in Q1 2025, fresh-format and value grocers outperformed the other sub-segments with positive YoY visit and average visit-per-location growth.
5. Hispanic markets are on the rise. Though the broader ethnic grocery sub-segment was essentially flat YoY in Q1 2025, Hispanic-focused stores recorded increases in both visits and visits per location – and have been steadily growing visits since 2021.
6. Smaller formats for the win. In Q1 2025, smaller-format grocery store locations outpaced mid-sized and larger-format ones, underscoring the power of compact spaces to deliver significant foot traffic gains.
A Study in Resilience
Brick-and-mortar grocery stores face an uncertain market in 2025. Rising food-at-home prices (eggs, anyone?), declining consumer confidence, and increased competition from discounters, superstores, and online shopping channels all present the segment with significant headwinds. Yet even in the face of these challenges, the sector has demonstrated remarkable resilience – growing its foot traffic and holding onto visit share.
What strategies have helped the segment navigate today’s tough market? And how can industry stakeholders make the most of the opportunities in the current market? This report draws on the latest location intelligence to uncover the trends shaping grocery retail in early 2025 – highlighting insights to help key players make informed, data-driven decisions on store formats, product offerings, and more.
Growth in Aisle One
The grocery segment has experienced nearly uniform positive year-over-year (YoY) growth over the last 12 months. This sustained performance in the face of inflation and other headwinds highlights the underlying strength of the category.
Visits Up, Dwell Time Down
What is driving this growth? Since 2022, the grocery segment has seen consistent overall visit growth that has outpaced increases in visits per location – a sign that chain expansion has played a key role in the category’s success. But the average number of visits to each grocery store has also been on the rise, indicating that the segment continues to expand without cannibalizing existing store traffic.
At the same time, visitor dwell times have been steadily dropping since 2021. This shift appears to reflect a trend towards multiple, shorter trips by inflation-wary consumers eager to avoid large, costly carts or cherry pick deals across various retailers. Many shoppers may also be placing more bulk orders online and supplementing those deliveries with brief in-store stops for additional items as needed.
The bottom line: Shoppers are taking more grocery trips overall each year, but spending less time in-store during each visit. Operators can respond to this trend by optimizing layouts and promoting “grab-and-go” areas for an even more efficient quick-trip experience.
Still in Stock
Visit share data also shows that despite fierce competition from discount and dollar stores, wholesalers, and general mass retailers, the grocery segment has steadfastly preserved its share of the overall food-at-home visit pie.
Between Q1 2019 and Q1 2025, wholesale clubs and discount and dollar stores increased their share of total food-at-home visits, gains that have come primarily at the expense of Walmart and Target. Meanwhile, grocery outlets have held firm – despite some fluctuations over the years, their Q1 2019 visit share remained essentially unchanged in Q1 2025.
So even as consumers flock to alternative food purveyors in search of lower prices, grocery stores aren’t losing ground – and on a nationwide level, they remain the biggest player by far in the food-at-home shopping space.
A Coastal Advantage
Still, grocery store visit share varies significantly by region. On the West Coast, in parts of the Northeast, Mid-Atlantic, and Mountain regions, and in Florida and Michigan, grocery stores accounted for the majority of food-at-home visits in Q1 2025. Oregon (61.6%) and Washington (59.6%) led the pack, followed by Massachusetts (59.2%), Vermont (58.5%), and California (57.9%). Meanwhile, in West Virginia, Arkansas, South Dakota, Oklahoma, North Dakota, and Mississippi, less than 30% of food-at-home traffic went to grocery stores, with more shoppers in these regions turning to general mass retailers or discounters.
Grocery store operators in lower-grocery-share regions may choose to focus on price competitiveness and convenient store locations to capture more foot traffic from competitors in the space.
Fresh and Frugal on the Rise
Which types of grocery stores are thriving the most? The grocery segment is diverse, encompassing traditional grocery chains like Kroger, Safeway, and H-E-B; budget-oriented value chains such as Aldi, WinCo Foods, Grocery Outlet Bargain Market, and Market Basket; fresh-format specialty brands like Trader Joe’s, Whole Foods, and Sprouts Farmers Market; and numerous ethnic grocers.
Examining shifts in visit share among these various grocery store segments shows that traditional grocery still dominates, commanding over 70.0% of total grocery store foot traffic.
Still, over the past several years, traditional grocers have gradually ceded ground to other segments – especially value chains. Budget grocers saw a temporary surge in visits during the panic-buying days of early 2020 – and have been more gradually gaining visit share since Q1 2023. . Fresh-format banners, which lost ground in 2021 after a Q1 2020 bump, in the wake of COVID, have also been on the upswing and appear poised to capture additional visit share in the coming months and years. And though ethnic grocers still account for a relatively small portion of the overall market, they have slightly increased their visit share, reflecting heightened consumer interest in these specialized offerings.
The Discount and Premium Edge
Recent performance metrics point to a bifurcation in the grocery market similar to that observed in other retail categories. In Q1 2025, fresh-format and value retailers – which appeal, respectively, to the most and least affluent visitor bases – saw the greatest growth in both overall visits and average visits per location.
This trend highlights the power of both value and health-focused quality to motivate consumers in 2025. And grocery players that can meet these needs will be well-positioned for success in the months ahead.
WFH Fresh-Format Lunch Crunch
One factor fueling fresh-format’s success may be its role as a convenient, relatively affordable midday lunch destination for the remote work crowd.
In Q1 2025, consumers working from home accounted for 20.2% of fresh-format grocery stores’ captured market – a significantly higher share than any other analyzed grocery segment. These stores also tended to be busier midday than the other segments. Remote workers may be stopping by to grab a quick bite – and some may be choosing to do their grocery shopping during their lunch break when stores are less crowded.
This finding suggests an opportunity for grocery operators across all segments to develop or enhance in-store salad bars and quick-serve sections to tap into the lunch rush. Likewise, CPG companies may benefit from developing more ready-made, nutritious meal options that align with these midday dining habits.
Salsa Surge
Though the broader ethnic grocery category remained essentially flat in Q1 2025, Hispanic-focused grocers emerged as a sub-segment to watch. Both overall visits and average visits per location to these stores have been on the rise since 2021.
This robust demand presents an opportunity for CPG brands and grocers across segments to expand Hispanic-focused offerings, capturing a slice of this growing market.
Less is More
Finally, store size matters more than ever in 2025. During the first quarter of the year, smaller format grocery store locations (locations under 30K square feet, across different chains) outpaced larger stores with a 3.2% YoY jump in visits, showing that bigger isn’t always better in the grocery store space.
This pattern aligns with the decrease in dwell times noted above – shoppers may be making shorter trips to smaller, more convenient grocery store locations. These quick errands are ideal for picking up a few items to supplement online orders, shopping multiple deals, or sourcing specialty products unavailable at larger grocery destinations. And to lean into this trend, grocery operators might consider testing neighborhood “micro-store” concepts, focusing on curated selections, and offering convenient parking or pickup to match consumer preferences for targeted purchases and quicker trips.
Final Thoughts
Location intelligence reveals a growing, dynamic grocery landscape which is holding its ground in the face of increased competition. Shorter trips, busier lifestyles, and changing work routines are reshaping in-store experiences. And grocery players that refine their store formats, target both lunch and on-the-go shoppers, and adapt to shifting demographics can position themselves to thrive in this competitive sector. As the market continues to evolve, continuous attention to these changing patterns will be key to maintaining and expanding market share.
Dive into the data to explore recent visitation patterns and consumer trends in the fitness space - and uncover potential keys to success, rooted in location intelligence.
May 5, 2025
8 minutes
Key Takeaways
1. Elevated visitor frequency could mean that gym-goers are getting more value out of their memberships and are therefore more likely to stay signed up. Between January and March 2025, all of the gym chains analyzed had a higher share of frequent visitors (those who visited about once a week) than in the equivalent month of 2024.
2. Fitness chains at all price tiers need to be strategic about the value they offer and the amenities that can engage budget-conscious consumers. Between Q1 2022 and Q1 2025, the captured trade area median HHI increased for all fitness subsegments – value-priced, mid-range, and high-end – suggesting that consumers swapped pricier gym memberships for more affordable options.
3. Close attention should be paid to how long visitors spend at fitness chains in order to reduce crowding and bottlenecks. Between Q1 2022 and Q1 2025, the average visit length increased at value-priced, mid-range, and high-end gyms. Floorplan and equipment improvements could be considered, as well as having trainers available to help gym-goers streamline workouts.
4. Gyms can use hourly visit data to better serve their members or use promotions to stabilize facility usage throughout the day. In Q1 2025, high-end chains received a larger share of morning visits while value-priced and mid-range fitness chains received larger shares of evening visits.
Fitness Flexes Its Muscles
Like many industries in recent years, the fitness sector has experienced significant shifts in consumer behavior. From the rise in home workouts during the pandemic to the strain of hyper-inflation, foot traffic trends to gyms and health clubs have been as dynamic as the consumers they serve.
This report leverages location analytics to explore the consumer trends driving visitation in the fitness space and provides actionable insights for industry stakeholders.
Back in Shape: The COVID Recovery
The pandemic drove several shifts in the fitness space. Widespread gym closures led consumers to embrace home-based workouts, while demand for all things fitness increased due to an emphasis on overall health and wellness. This subsequently drove a renewed interest in gym-based workouts as restrictions lifted – even as some consumers remained committed to their home workout routines.
In Q1 2023, visits to fitness chains surpassed Q1 2019 levels for the first time since the onset of the pandemic, a sign that consumers had recommitted to out-of-home fitness. And in Q1 2024 and Q1 2025, fitness chains saw further growth, climbing to 12.8% and 15.5% above the Q1 2019 baseline, respectively.
Several factors have likely driven consumers’ return to gyms and health clubs, including the desire for both social connection and professional-grade facilities difficult to replicate at home. The steep increase in cost of living has likely also played a role, since consumers cutting back on discretionary spending can enjoy multiple outings and a range of recreational activities at the gym for one monthly fee.
Getting Gains: Strong Q1 ‘25
Zooming in on weekly visits to the fitness space in Q1 2025 reveals the industry’s exceptional strength and resilience in the early part of the year.
The fitness industry experienced YoY visit growth nearly every week of Q1 2025 (and 2.4% YoY visit growth overall) with only minor visit gaps the weeks of January 20th, 2025 and February 17th, 2025 – likely due to extreme weather that prevented many Americans from hitting the gym.
And the fitness industry’s weekly visit growth appeared to strengthen throughout the quarter, defying the typical waning of New Year's resolutions. This could indicate that gym visits haven't plateaued and that consumers are demonstrating greater commitment to their fitness routines compared to last year.
Increasing Reps: Visitor Frequency Up At Leading Chains
Diving into visitation patterns for leading fitness chains highlights how increased visitor frequency drove foot traffic growth in Q1 2025.
Fitness chains tend to receive the most visits during the first months of the year as consumers recommit to health and wellness in their post-holidays New Year’s resolutions. And not only do more people hit the gym – analyzing the data reveals that gym-goers also typically work out more frequently during this period. Zooming in on 2025 so far suggests that consumers are especially committed to their fitness routines this year: Leading gyms saw an increase in the proportion of frequent visitors (4+ times a month) in Q1 2025 compared to the already significant percentage of frequent visitors in the first quarter of 2024.
Elevated visitor frequency could mean that gym-goers are getting more value out of their memberships than last year, and are therefore more likely to stay signed up throughout the year.
At the same time, the data also reveals that – contrary to what may be expected – a fitness chain’s share of frequent visitors appears to be independent of the cost of membership associated with the club: Life Time, a high-end club, and EōS Fitness, a value-priced gym, had the highest shares of frequent visitors between January 2024 and March 2025. This suggests that factors other than cost, such as location convenience, class offerings, community, or individual motivation, might be more influential in driving frequent gym attendance.
Fitness Clubs at Different Price Points
Segmenting the fitness industry by membership price tiers – value-priced, mid-range, and high-end – can reveal further insights on current consumer behavior around out-of-home fitness.
Household Income Bulks Up
In Q1 2025, the captured market* median household income (HHI) was higher than the nationwide median HHI ($79.6K/year) across all price tiers – suggesting that even value-priced fitness chains are attracting a relatively affluent audience. This could indicate that gym memberships are somewhat of a luxury and that consumers from lower-income households gave up their gym memberships altogether as they tightened their purse strings.
Analyzing the historical data since Q1 2022 also reveals that the captured market median HHI has risen consistently over the past couple of years with the largest median HHI increase observed in the captured trade areas of high-end fitness chains. This suggests that middle-income households – that are more sensitive to the rising cost of living – likely swapped pricier gym memberships for more affordable options in recent years.
These metrics indicate that fitness chains at all price tiers need to think strategically about the value they offer and the amenities that can engage budget-conscious consumers who are carefully weighing every expenditure.
*Captured trade area is obtained by weighting the census block groups (CBGs) from which the chain draws its visitors according to their share of visits to the chain and thus reflects the population that visits the chain in practice.
Average Stay Increases
Fitness clubs of all types need to manage their capacity to ensure health and safety standards and a positive experience for members. And understanding the average amount of time visitors spend at the gym can help fitness chains at every price point keep their finger on the pulse of their facilities.
Between Q1 2022 and Q1 2025, the average visit length increased at value-priced, mid-range, and high-end gyms. Value-priced gyms experienced the largest increase in average visit length – from 72.4 minutes in Q1 2022 to 74.0 minutes in Q1 2025 – perhaps due to their relatively lower-income visitors spending more time enjoying club amenities after cutting back on other forms of recreation. Meanwhile, mid-range and high-end gyms experienced relatively modest increases in average visit length, which were higher to begin with – likely due to their ample class and spa offerings and overall inviting, upscale spaces.
Elevated average visit length could mean that visitors are well-engaged and less likely to cancel their memberships. But as overall gym visits are on the rise, fitness chains may want to pay close attention to how long visitors spend at the facility. Floorplan and equipment improvements could be considered in order to reduce bottlenecks, and having trainers available to instruct on equipment usage and workout technique could help gym-goers streamline workouts.
Workouts on a Schedule
Along with average visit length, understanding the daypart in which they receive the most visits is another way that fitness chains can improve efficiency and prevent overcrowding. And analysis of the hourly visits to fitness sub-segments revealed that some fitness segments receive more morning visits while others are more popular in the evenings.
In Q1 2025, high-end chains received a larger share of visits between 6 a.m. and 9 a.m. (19.7%) than value-priced and mid-range fitness chains (11.6% and 11.8%, respectively). Meanwhile, value-priced and mid-range fitness chains received larger shares of visits between 6 p.m. and 9 p.m. (21.9% and 22.2%) than high-end chains (16.5%).
Gyms can leverage this data to better serve members, for instance by scheduling more classes during peak hours. Value-priced and mid-range gyms, which saw a larger disparity between shares of morning and evening visits in Q1 2025, might also consider incentivizing off-peak usage through discounted morning memberships or early-bird snack bar deals.
Fitness Continues to Grow
The fitness space appears to be in good shape in 2025. Visits have made a full recovery from the pandemic era and still continue to grow, indicating strong consumer demand for out-of-home workouts. And using location intelligence to analyze the behavior and demographics of visitors to gyms at different price points can help identify opportunities for driving even greater success.


.svg)