Key Takeaways:
1. Appetite for offline retail & dining is stronger than ever. Both retail and dining visits were higher in H1 2025 than they were pre-pandemic.
2. Consumers are willing to go the extra mile for the perfect product or brand. The era of one-stop-shops may be waning, as many consumers now prefer to visit multiple chains or stores to score the perfect product match for every item on their shopping list.
3. Value – and value perception – gives chains a clear advantage. Value-oriented retail and dining segments have seen their visits skyrocket since the pandemic.
4. Consumer behavior has bifurcated toward budget and premium options. This trend is driving strength at the ends of the spectrum while putting pressure on many middle-market players.
5. The out-of-home entertainment landscape has been fundamentally altered. Eatertainment and museums have stabilized at a different set point than pre-COVID, while movie theater traffic trends are now characterized by box-office-driven volatility.
6. Hybrid work permanently reshaped office utilization. Visits to office buildings nationwide are still 33.3% below 2019 levels, despite RTO efforts.
The first half of 2025 marked five years since the onset of the pandemic – an event that continues to impact retail, dining, entertainment, and office visitation trends today.
This report analyzes visitation patterns in the first half of 2025 compared to H1 2019 and H1 2024 to identify some of the lasting shifts in consumer behavior over the past five years. What is driving consumers to stores and dining venues? Which categories are stabilizing at a higher visit point? Where have the traffic declines stalled? And which segments are still in flux? Read the report to find out.
Retail Outperforming Dining
In the first half of 2025, visits to both the retail and dining segments were consistently higher than they were in 2019. In both the dining and the retail space, the increases compared to pre-COVID were probably driven by significant expansions from major players, including Costco, Chick-fil-A, Raising Cane's, and Dutch Bros, which offset the numerous retail and dining closures of recent years.
The overall increase in visits indicates that, despite the ubiquity of online marketplaces and delivery services, consumer appetite for offline retail and dining remains strong – whether to browse in store, eat on-premises, collect a BOPIS order, or pick up takeaway.
Product and Brand Focused Consumers Bypass Convenience
A closer look at the chart above also reveals that, while both retail and dining visits have exceeded pre-pandemic levels, retail visit growth has slightly outpaced the dining traffic increase.
The larger volume of retail visits could be due to a shift in consumer behavior – from favoring convenience to prioritizing the perfect product match and exhibiting a willingness to visit multiple chains to benefit from each store's signature offering. Indeed, zooming into the superstore and grocery sector shows an increase in cross-shopping since COVID, with a larger share of visitors to major grocery chains regularly visiting superstores and wholesale clubs. It seems, then, that many consumers are no longer looking for a one-stop-shop where they can buy everything at once. Instead, shoppers may be heading to the grocery stores for some things, the dollar store for other items, and the wholesale club for a third set of products.
This trend also explains the success of limited assortment grocers in recent years – shoppers are willing to visit these stores to pick up their favorite snack or a particularly cheap store-branded basic, knowing that this will be just one of several stops on their grocery run.
Value-Oriented Categories Fuel Retail Growth
Value-Forward Retail Categories Still Growing
Diving into the traffic data by retail category reveals that much of the growth in retail visits since COVID can be attributed to the surge in visits to value-oriented categories, such as discount & dollar stores, value grocery stores, and off-price apparel. This period has been defined by an endless array of economic obstacles like inflation, recession concerns, gas price spikes, and tariffs that all trigger an orientation to value. The shift also speaks to an ability of these categories to capitalize on swings – consumers who visited value-oriented retailers to cut costs in the short term likely continued visiting those chains even after their economic situation stabilized.
Some of the visit increases are due to the aggressive expansion strategies of leaders in those categories – including Dollar General and Dollar Tree, Aldi, and all the off-price leaders. But the dramatic increase in traffic – around 30% for all three categories since H1 2019 – also highlights the strong appetite for value-oriented offerings among today's consumers. And zooming into YoY trends shows that the visit growth is still ongoing, indicating that the demand for value has not yet reached a ceiling.
Value Alone Doesn't Drive Success
While affordable pricing has clearly driven success for value retailers, offering low prices isn't a guaranteed path to growth. Although traffic to beauty and wellness chains remains significantly higher than in 2019, this growth has now plateaued – even top performers like Ulta saw slight YoY declines following their post-pandemic surge – despite the relatively affordable price points found at these chains.
Some of the beauty visit declines likely stems from consumers cutting discretionary spending – but off-price apparel's ongoing success in the same non-essential category suggests budget constraints aren't the full story. Instead, the plateauing of beauty and drugstore visits while off-price apparel visits boom may be due to the difference in value perception: Off-price retailers are inherently associated with savings, while drugstores and beauty retailers, despite carrying affordable items, lack that same value-driven brand positioning. This may suggest that in today's market, perceived value matters as much as actual affordability.
Traffic to Chains Selling Big-Ticket Products Significantly Below 2019 Levels
Another indicator of the importance of value perception is the decline in visits to chains selling bigger-ticket items – both home furnishing chains and electronic stores saw double-digit drops in traffic since H1 2019.
And looking at YoY trends shows that visits here have stabilized – like in the beauty and drugstore categories – suggesting that these sectors have reached a new baseline that reflects permanently shifted consumer priorities around discretionary spending.
Bifurcation of Consumer Behavior
Mid-Market Apparel Underperforms Luxury & Off-Price
A major post-pandemic consumer trend has been the bifurcation of consumer spending – with high-end chains and discount retailers thriving while the middle falls behind. This trend is particularly evident in the apparel space – although off-price visits have taken off since 2019 (as illustrated in the earlier graph) overall apparel traffic declined dramatically – while luxury apparel traffic is 7.6% higher than in 2019.
Bifurcated Dining Behavior
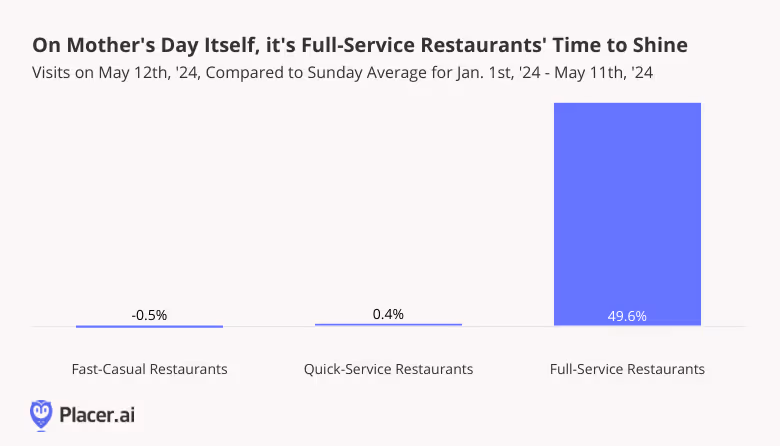
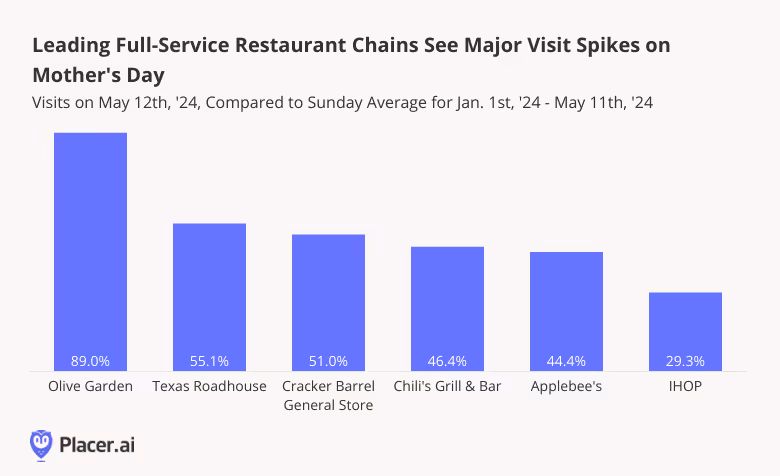
Dining traffic trends also illustrate this shift: Categories that typically offer lower price points such as QSR, fast casual, and coffee have expanded significantly since 2019, as has the upscale & fine dining segment. But casual dining – which includes classic full-service chains such as Red Lobster, Applebee's, and TGI Fridays – has seen its footprint shrink in recent years as consumers trade down to lower-priced options or visit higher-end venues for special occasions.
Chili's has been a major exception to the casual dining downturn, largely driven by the chain's success in cementing its value-perception among consumers – suggesting that casual dining chains can still shine in the current climate by positioning themselves as leaders in value.
Are Consumers De-Prioritizing Experiences?
Consumers' current value orientation seems to be having an impact beyond the retail and dining space: When budgets are tight, spending money in one place means having less money to spend in another – and recent data suggests that the consumer resilience in retail and dining may be coming at the expense of travel – or perhaps experiences more generally.
While airport visits from domestic travelers were up compared to pre-COVID, diving into the data reveals that the growth is mostly driven by frequent travelers visiting airports two or more times in a month. Meanwhile, the number of more casual travelers – those visiting airports no more than once a month – is lower than it was in 2019.
This may suggest that – despite consumers' self-reported preferences for "memorable, shareable moments" – at least some Americans are actually de-prioritizing experiences in the first half of 2025, and choosing instead to spend their budgets in retail and dining venues.
Stability and Volatility in the Entertainment Space
The out of home entertainment landscape has also undergone a significant change since COVID – and the sector seems to have settled into a new equilibrium, though for part of the sector, the equilibrium is marked by consistent volatility.
Museums & Eatertainment Reach New Set Point
Eatertainment chains – led by significant expansions from venues like Top Golf – saw a 5.5% visit increase compared to pre-pandemic levels, though YoY growth remained modest at 1.1%. On the other hand, H1 2025 museum traffic fell 10.9% below 2019 levels with flat YoY performance (+0.2%). The minimal year-over-year changes in both categories suggest that these entertainment segments have found their new post-COVID equilibrium.
The rise of eatertainment alongside the drop in museum visits may also reflect the intense focus on value for today's consumers. Museums in 2025 offer essentially the same value proposition that they offered in 2019 – and for some, that value proposition may no longer justify the entrance fee. But eatertainment has gained popularity in recent years as a format that offers consumers more bang for their buck relative to stand-alone dining or entertainment venues – which makes it the perfect candidate for success in today's value-driven consumer landscape.
But movie theaters traffic trends are still evolving – even accounting for venue closures, visits in H1 2025 were well below H1 2019 levels. But compared to 2024, movie traffic was also up – buoyed by the release of several blockbusters that drove audiences back to cinemas in the first half of 2025. So while the segment is still far from its pre-COVID baseline, movie theaters retain the potential for significant traffic spikes when compelling content drives consumer demand.
The blockbuster-driven YoY increase can perhaps also be linked to consumers' spending caution. With budgets tight, movie-goers may want to make sure that they're spending time and money on films they are sure to enjoy – taking fewer risks than they did in 2019, when movie tickets and concession prices were lower and consumers were less budget-conscious.
Office Traffic Slowly Inching Up
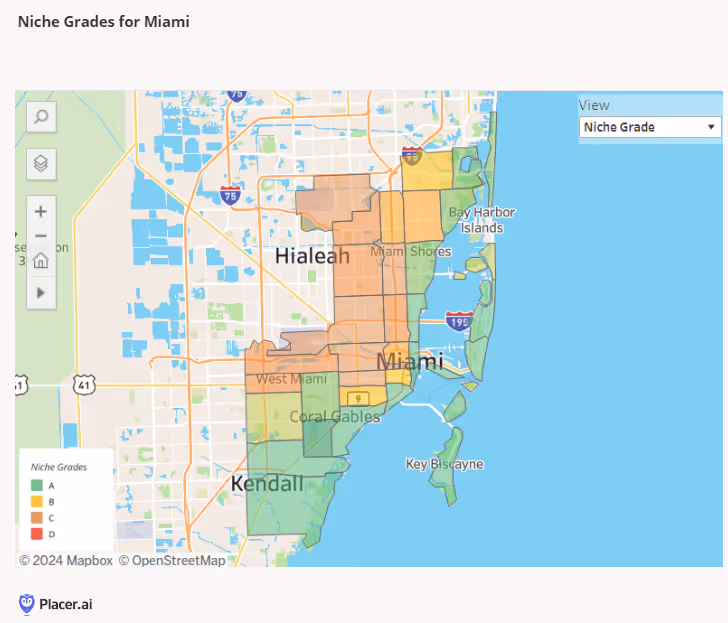
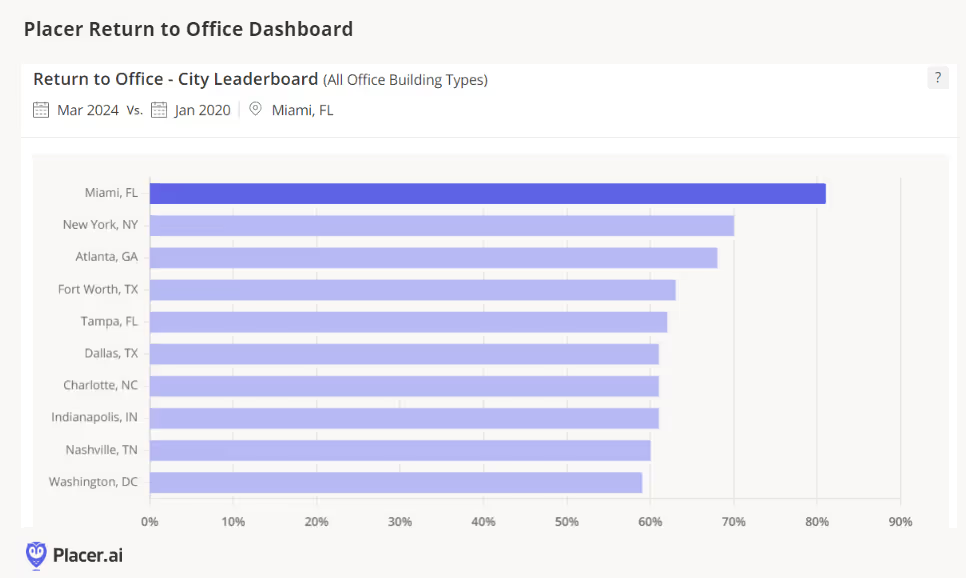
H1 2025 also brought some moderate good news on the return to office (RTO) front, with YoY visits nationwide up 2.1% and most offices seeing YoY office visit increases – perhaps due to the plethora of RTO mandates from major companies. But comparing office visitation levels to pre pandemic levels highlights the way left to go – nationwide visits were 33.3% below H1 2019 levels in H1 2025, with even RTO leaders New York and Miami still seeing 11.9% and 16.1% visit gaps, respectively.
So while the data suggests that the office recovery story is still being written – with visits inching up slowly – the substantial gap from pre-pandemic levels suggests that remote and hybrid work models have fundamentally reshaped office utilization patterns.
Post-COVID Stabilization of Consumer Behavior
Five years post-pandemic, consumer behavior across the retail, dining, entertainment, and office spaces has crystallized into distinct new patterns.
Traffic to retail and dining venues now surpasses pre-pandemic levels, driven primarily by value-focused segments. But retail and dining segments that cater to higher income consumers –such as luxury apparel and fine dining – have also stabilized at a higher level, highlighting the bifurcation of consumer behavior that has emerged in recent years. Entertainment formats show more variability – while eatertainment traffic has settled above and museums below 2019 levels, and movie theaters still seeking stability. Office spaces remain the laggard, with visits well below pre-pandemic levels despite corporate return-to-office initiatives showing modest impact.
It seems, then, that the new consumer landscape rewards businesses that can clearly articulate their value proposition to attract consumers' increasingly selective spending and time allocation – or offer a premium product or experience catering to higher-income audiences.


.svg)