

.svg)


Thank you! Your submission has been received!
Oops! Something went wrong while submitting the form.
0
0
0
0
----------
0
0
Articles
.avif)
Article
Retail Corridors Emerge as Evening Destinations in 2026US retail corridor traffic stalled in early 2026 as weekday daytime visits lagged, while Friday and Saturday evenings fully recovered past 2019 levels.
Ezra Carmel & Lila Margalit
Jul 9, 2026
3 minutes
%20(1).avif)
Article
Placer.ai June 2026 Mall Index: Momentum Heading Into H2 2026Placer.ai's June 2026 Mall Index finds sustained foot traffic growth across all mall formats, with open-air centers leading and shopper demographics broadening heading into H2 2026.
Shira Petrack
Jul 8, 2026

Article
What Prime Week 2026 Reveals About Today's ShopperConsumer sentiment may be low, but Prime Week 2026 showed shoppers still respond to compelling deals. See how Walmart, Target, Best Buy, and Kohl's performed.
Shira Petrack
Jul 7, 2026
3 minutes
Article
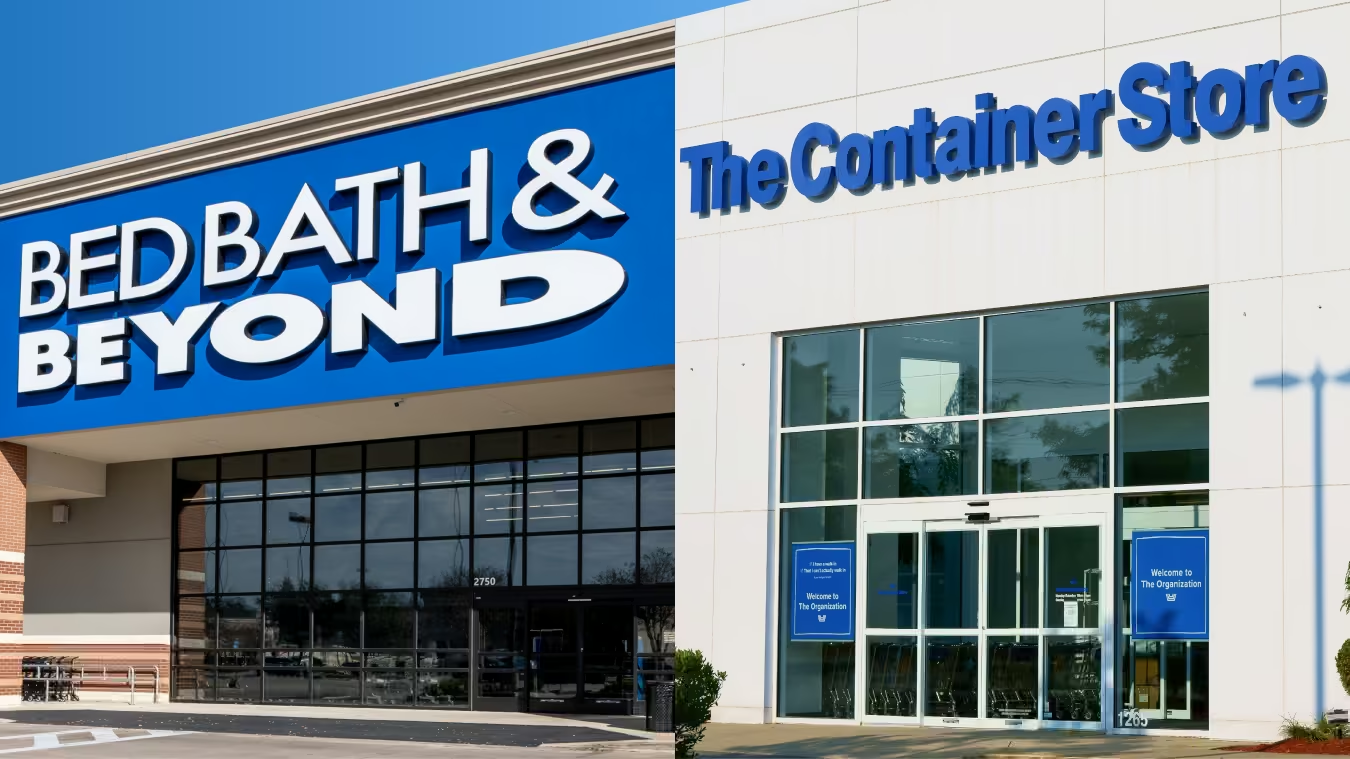
Can Bed Bath & Beyond Make A Comeback? Bed Bath & Beyond is returning to stores through Kirkland's and The Container Store. Here's what foot traffic data reveals about its comeback strategy.
Shira Petrack
Jul 6, 2026
5 minutes

Article
Can Endless Shrimp Fuel Red Lobster's Recovery?Red Lobster's weekly per-location visits swung from -8.7% to +24.3% YoY after Endless Shrimp returned April 20, 2026, holding double-digit gains into June.
Lila Margalit
Jul 2, 2026
.avif)
Article
Anchored Ep 7: The Data-Driven Customer EracubeiQ's Zora Sentat on first-party data, retail media's untapped potential, and why human expertise still matters in an automated world.
Rebecca Bleier
Jul 1, 2026
2 minutes
Reports

INSIDER
Report
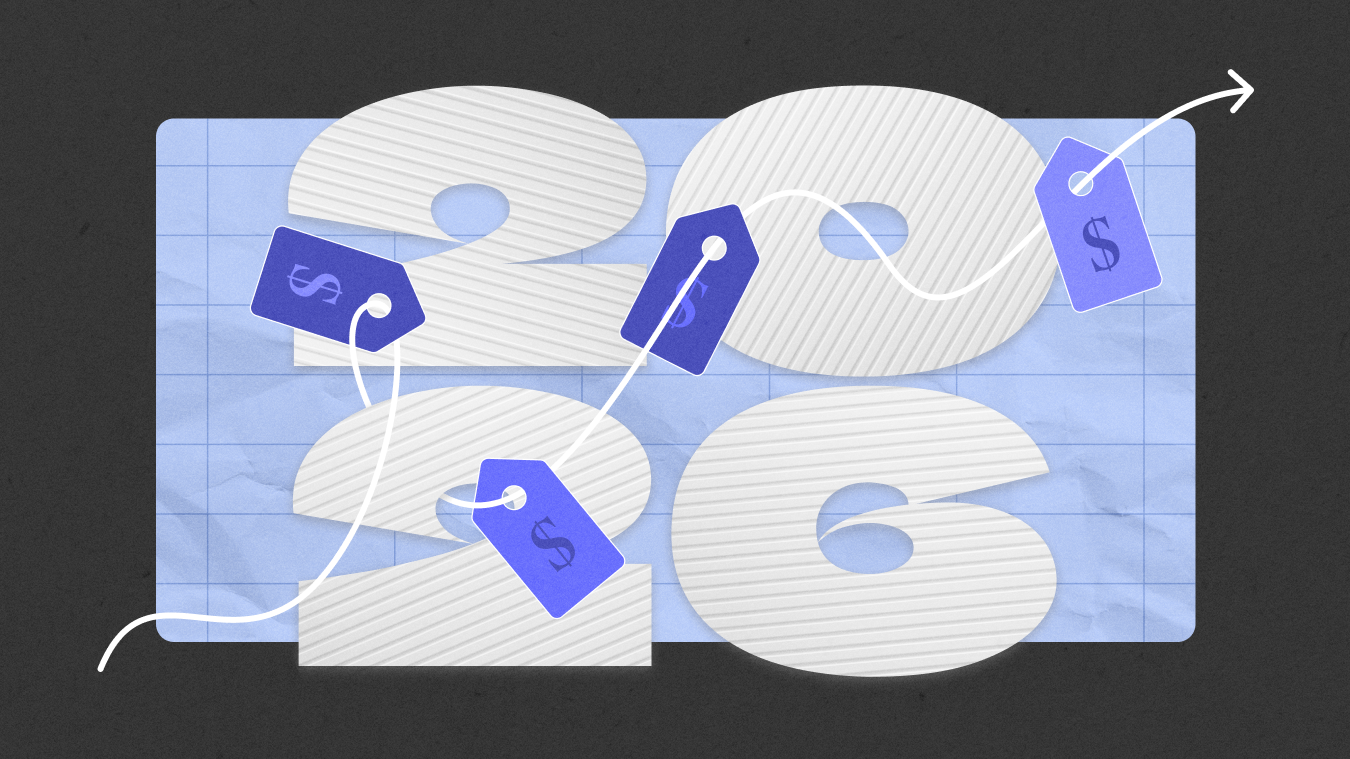
5 Markets to Watch in 2026Find out why Salt Lake City, Reno, Indianapolis, Raleigh, and Tampa are Placer.ai's markets to watch in 2026.
December 5, 2025
INSIDER
Report
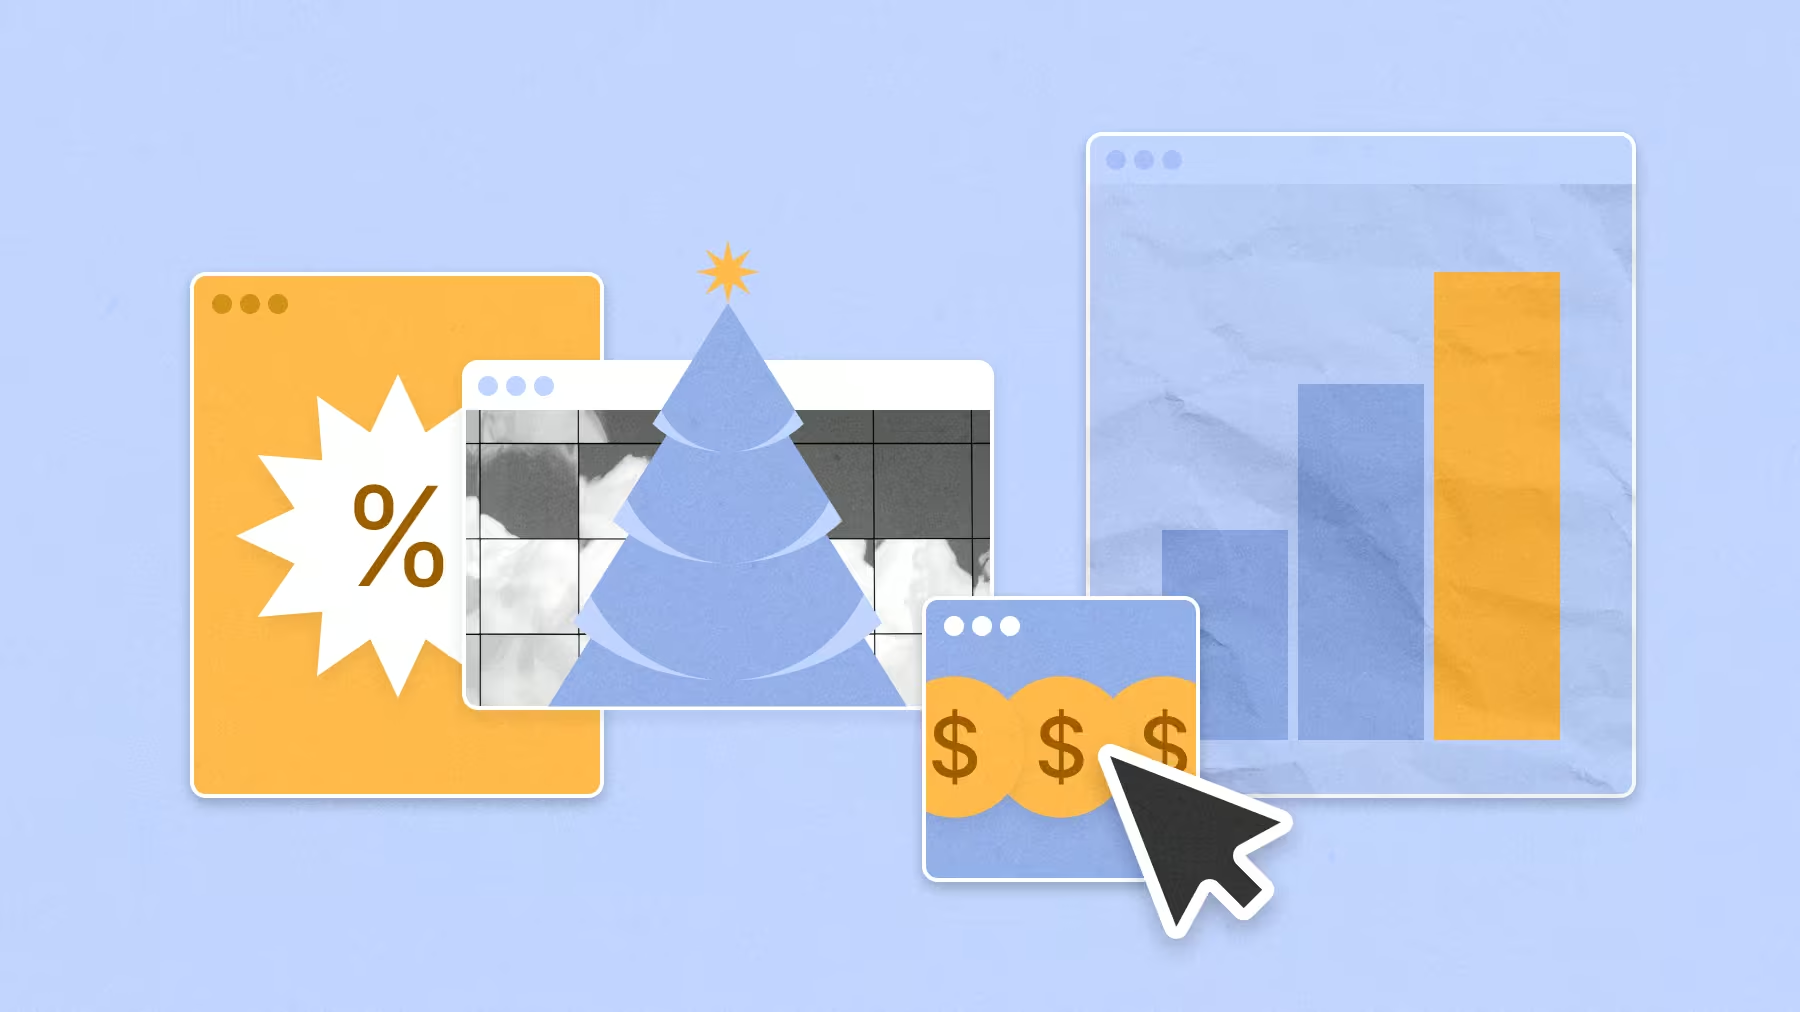
Retail Trends to Watch in 2026Which retail trends are set to define 2026? Using location intelligence, we explore the shifting patterns that could shape the retail landscape in the year ahead.
November 14, 2025
INSIDER
Report
Winning Holiday Shoppers in 2025: Key Insights for Advertisers and RetailersDive into the data to uncover the retail categories, audiences, and timing strategies poised to deliver high-impact campaigns this holiday season.
October 30, 2025
Loading results...
We couldn't find anything matching your search.
Browse one of our topic pages to help find what you're looking for.
For more in-depth analyses on a variety of subjects, explore Reports.
For more in-depth analyses on a variety of subjects, explore Reports.

INSIDER
Stay Anchored: Subscribe to Insider & Unlock more Foot Traffic Insights
Gain insider insights with our in-depth analytics crafted by industry experts
— giving you the knowledge and edge to stay ahead.

