

.svg)


Thank you! Your submission has been received!
Oops! Something went wrong while submitting the form.
0
0
0
0
----------
0
0
Articles
Article
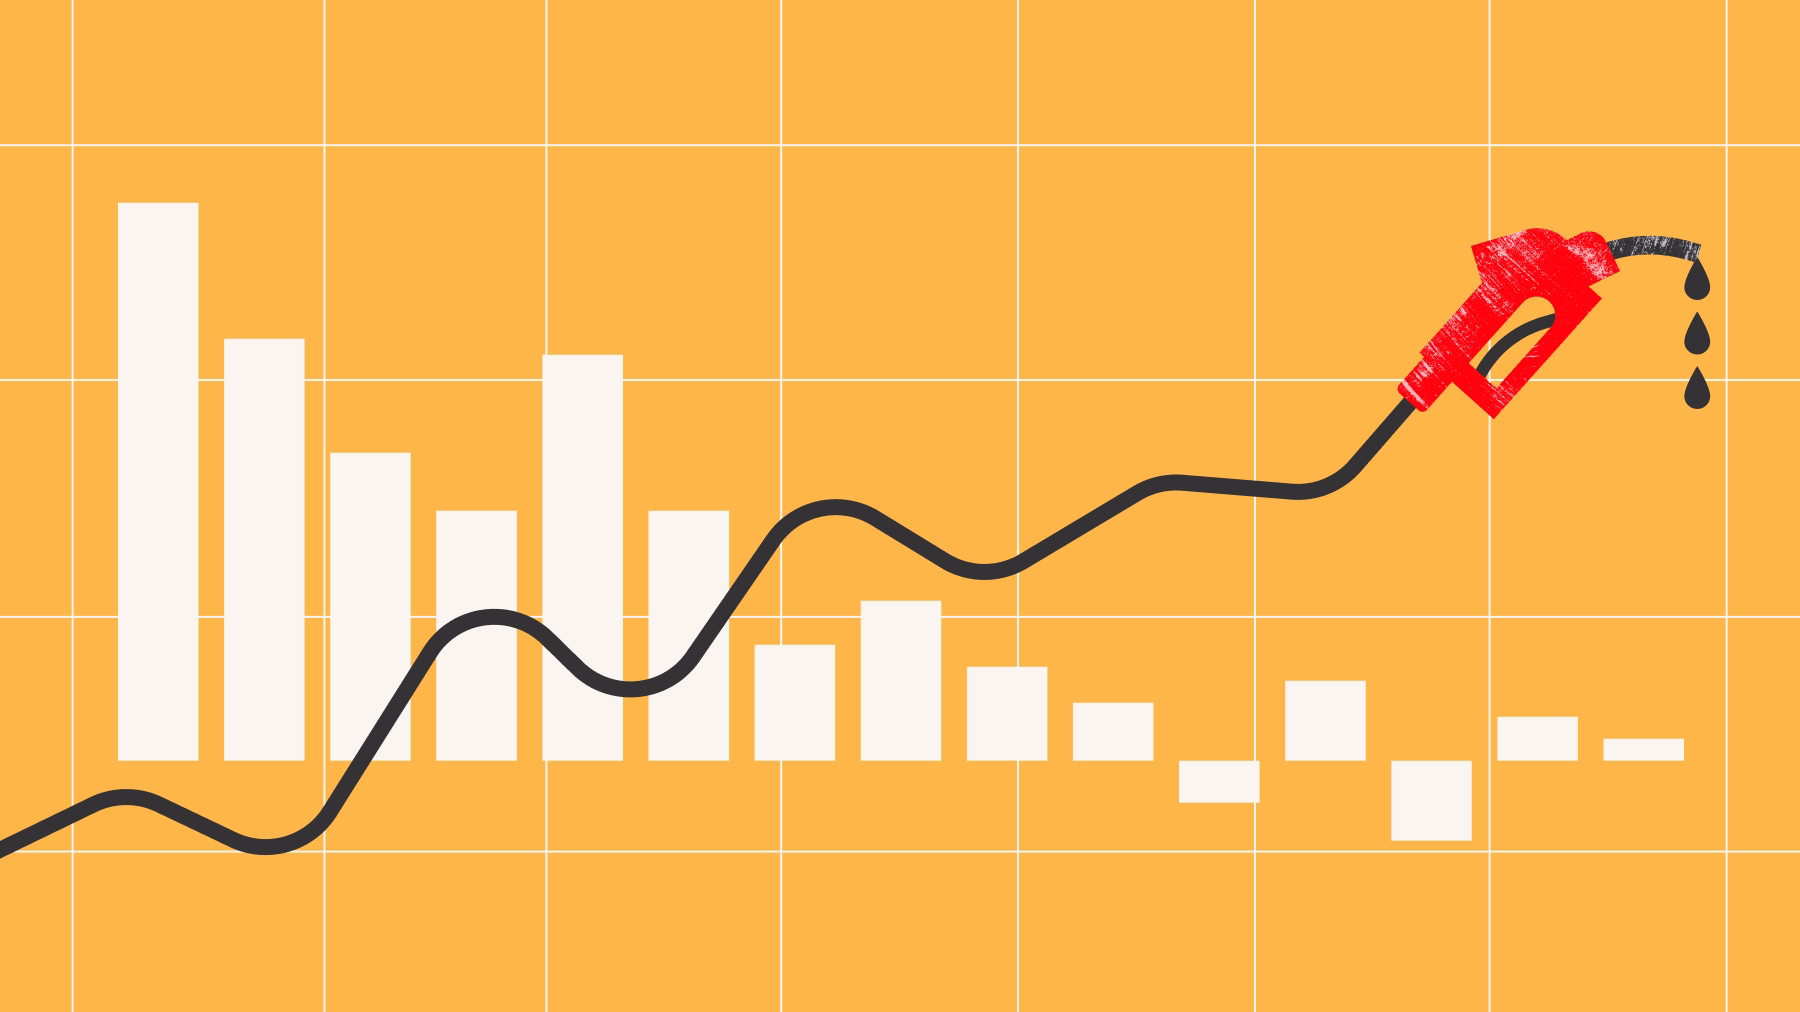
Rising Gas Prices Are Changing How America Fills Up – And ShopsGas prices climbed nearly 60% in early 2026 — and foot traffic data shows consumers are finally changing how they fill up and shop. See what the numbers reveal.
Ezra Carmel
Jun 3, 2026
4 minutes

Article
Consumer Desire for Small Indulgences Boosts Hobby RetailConsumers are embracing hobbies like book clubs, crafting, Mahjong, and journaling as affordable indulgences, boosting traffic to retailers including Barnes & Noble (BKS), Michaels, and Paper Source.
Elizabeth Lafontaine
Jun 1, 2026
3 minutes
Article
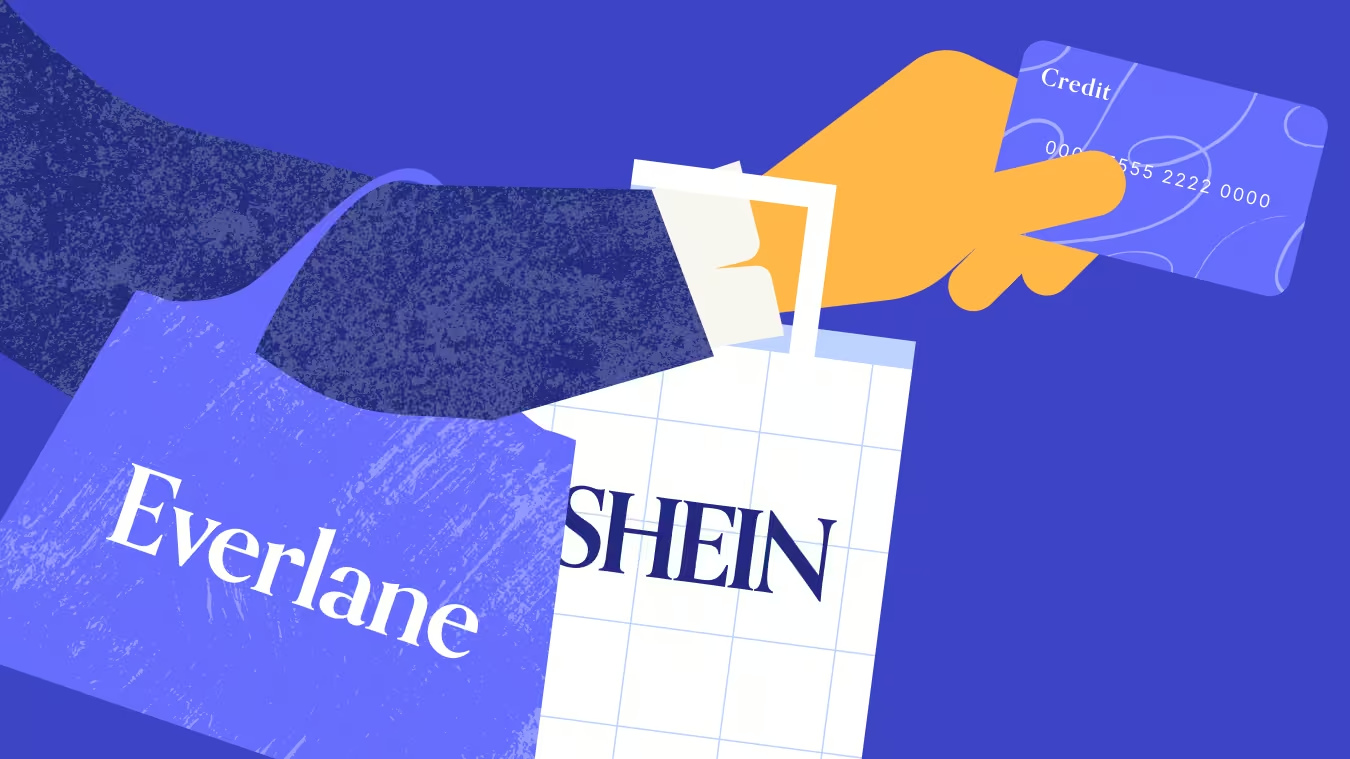
What Shein Is Really Buying with EverlaneShein’s reported $100M acquisition of Everlane is about more than a sustainability halo – it’s also a bid for direct access to the high-income, urban consumers the fast-fashion giant has long struggled to reach.
Lila Margalit
May 29, 2026
3 minutes
Article
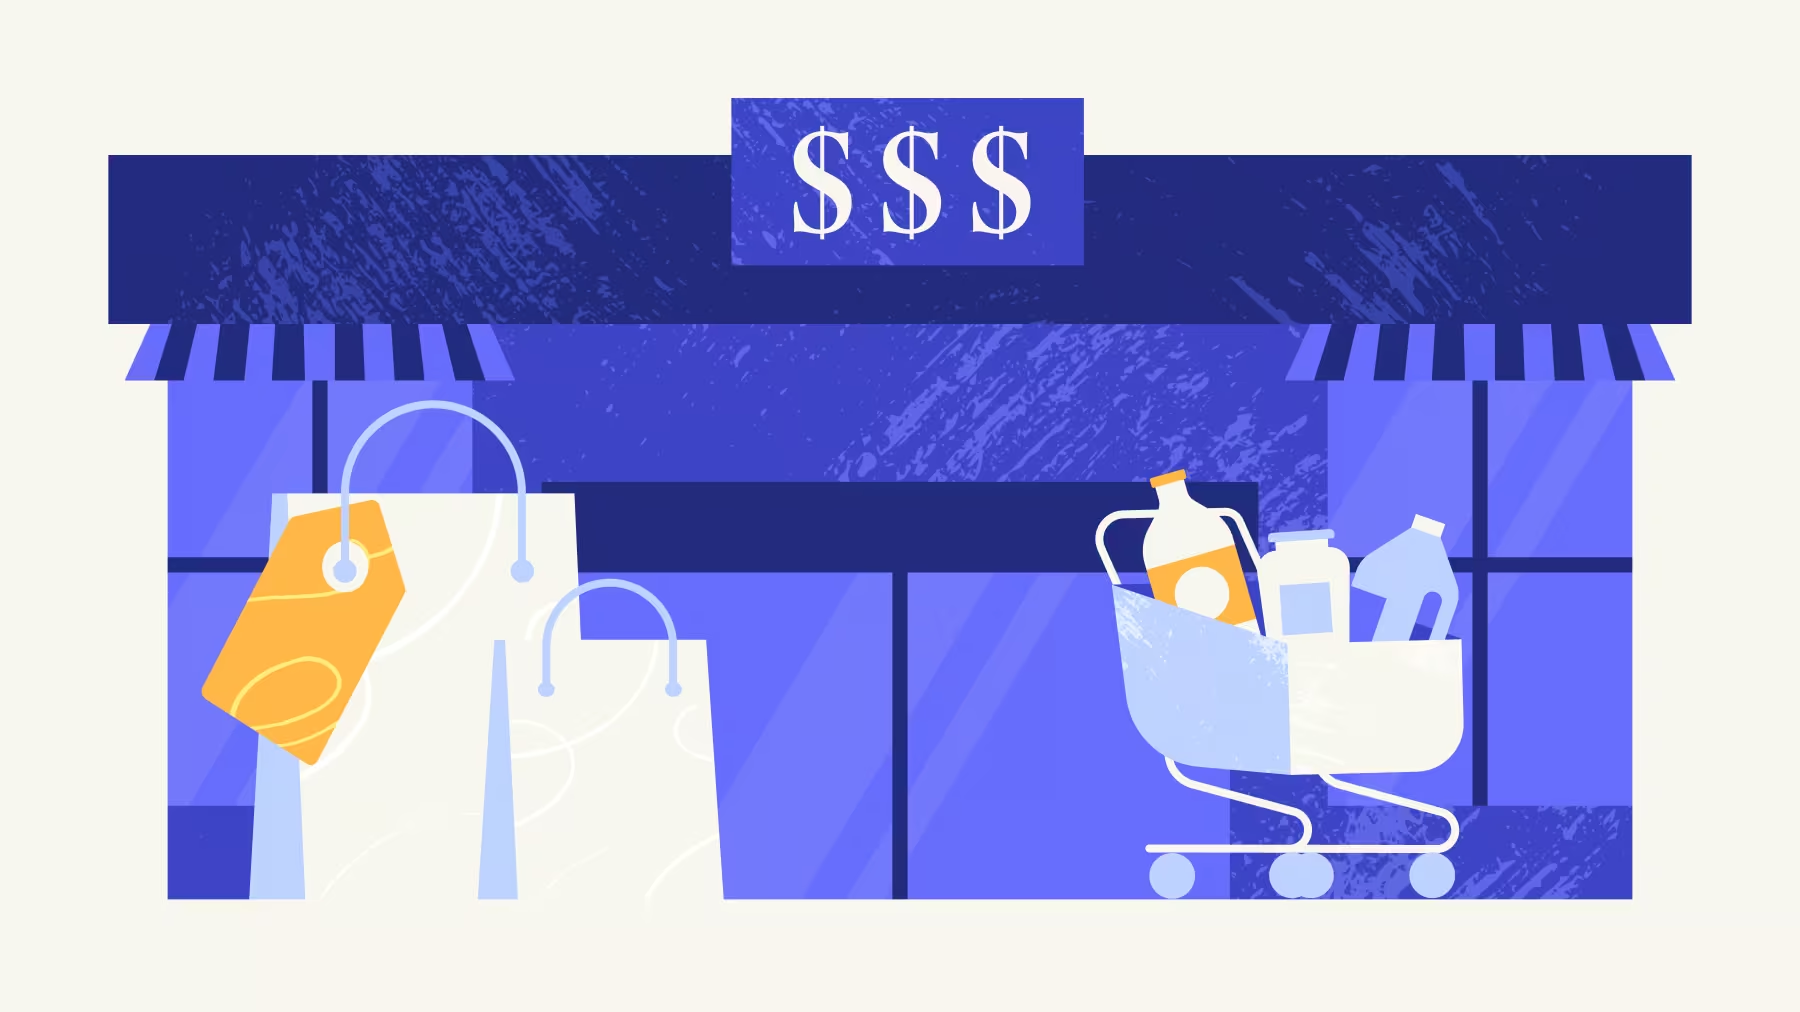
Why Dollar General Is Outpacing Dollar Tree in Early 2026Dollar General is outperforming Dollar Tree in early 2026 as stronger traffic trends, consumables demand, and operational momentum help drive an edge in the discount retail space.
Lila Margalit
May 28, 2026
3 minutes

Article
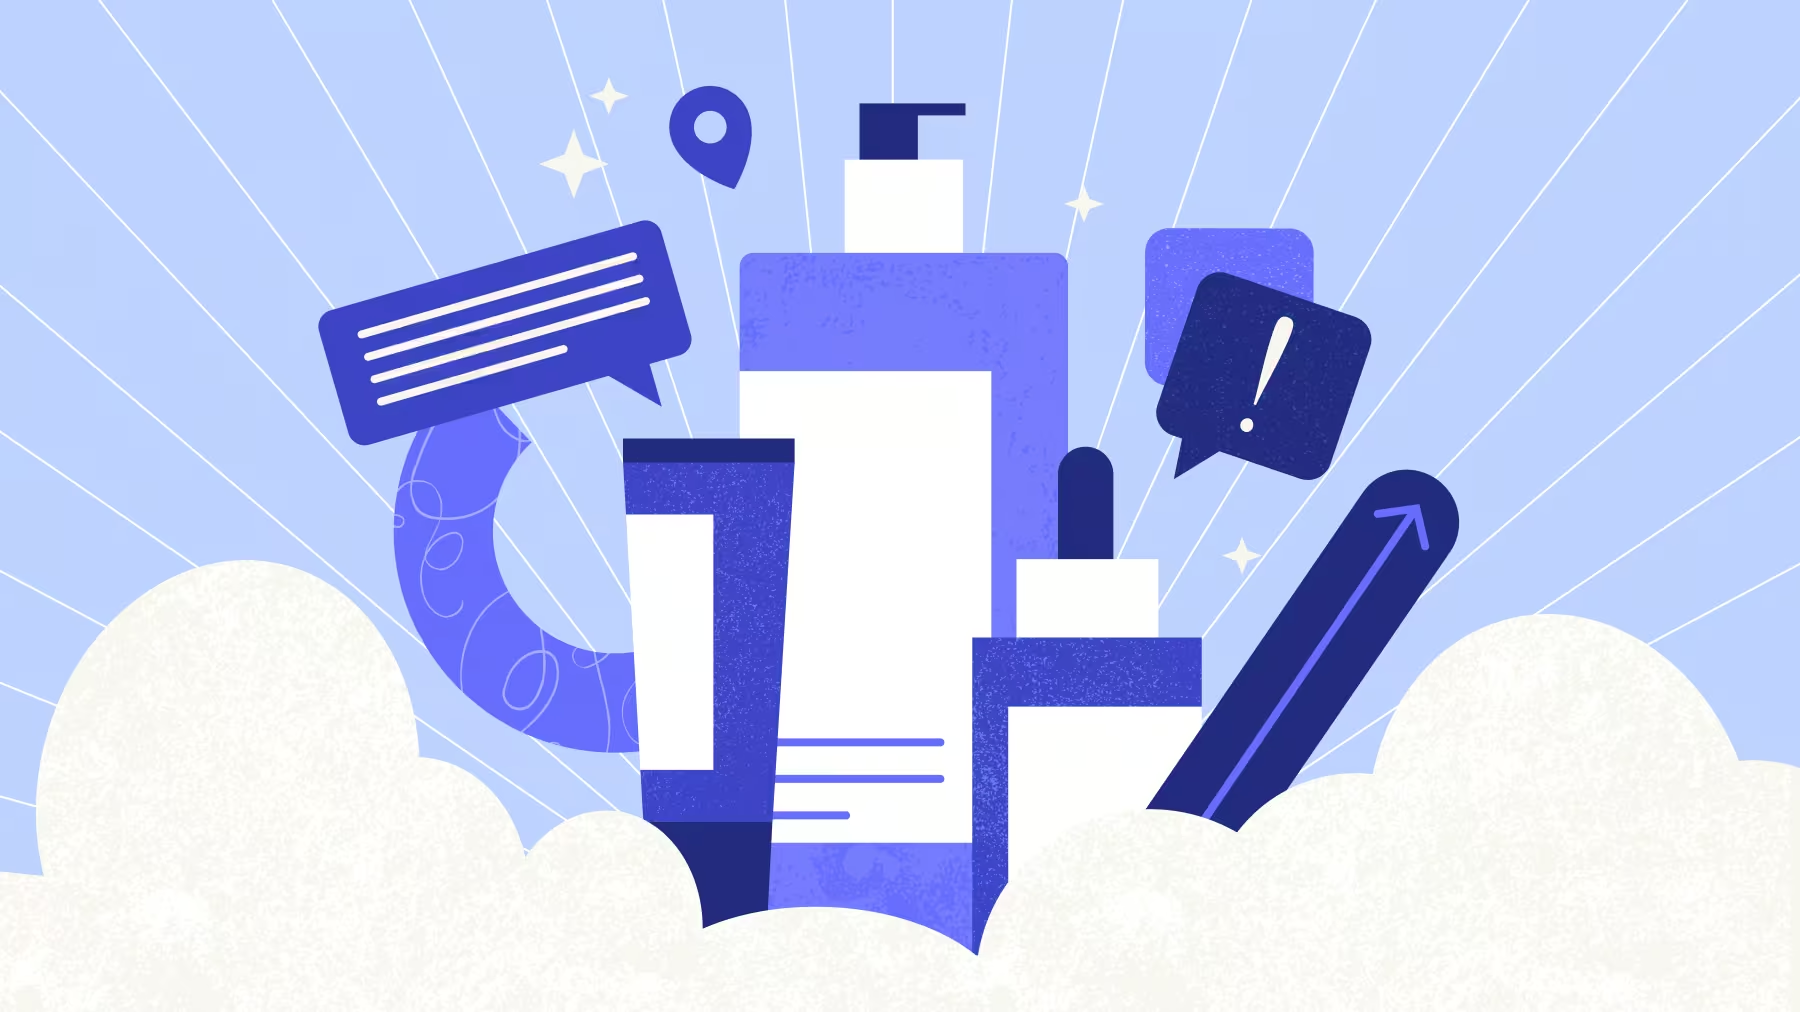
Beauty and Wellness’ Reinvention Era: Inside Ulta and Bath & Body Works’ Growth StrategiesUlta Beauty and Bath & Body Works are redefining beauty retail growth through loyalty programs, digital expansion, and immersive store experiences. See what foot traffic and dwell-time data reveal about consumer engagement in 2026.
Ezra Carmel
May 26, 2026
5 minutes
Reports
INSIDER
Report
Five Ways Retailers Can Leverage AI Without Losing What WorksRead the report to learn how AI is changing store roles, operations, marketing, and fleet strategy – and how to apply it without undermining what already works.
January 29, 2026
INSIDER
Report
10 Top Brands to Watch in 2026Meet the ten retail and dining powerhouses, including H-E-B, Walmart, and Dave’s Hot Chicken, redefining success and winning consumer loyalty in 2026.
January 12, 2026
.avif)
INSIDER
Report
6 Coffee-Inspired Strategies That Can Reshape Dining in 2026Dive into the data to see how coffee became one of this year’s strongest dining performers – and explore strategies that can drive restaurant success across concepts in 2026.
December 18, 2025
Loading results...
We couldn't find anything matching your search.
Browse one of our topic pages to help find what you're looking for.
For more in-depth analyses on a variety of subjects, explore Reports.
For more in-depth analyses on a variety of subjects, explore Reports.

INSIDER
Stay Anchored: Subscribe to Insider & Unlock more Foot Traffic Insights
Gain insider insights with our in-depth analytics crafted by industry experts
— giving you the knowledge and edge to stay ahead.

