Key Takeaways
1. Retail is deeply divided. Visits to value and luxury apparel segments grew YoY in 2025 while traffic to mid-tier retailers flagged.
2. Upscale dining momentum reflects similar bifurcation. More resilient, affluent consumers are bolstering fine-dining traffic.
3. Authenticity is key. Brands successfully executing on a clear sense of purpose – from community-driven grocers to bookstores – are driving consistent visit growth.
4. Online and offline retail are converging into a seamless ecosystem. As consumers seek online value and in-person convenience, AI fulfillment, dark stores, and local pickup are accelerating.
5. Digitally native brands expanding into physical retail are redefining omnichannel. These chains provide a blueprint for merging digital efficiency with personalized in-store experiences.
6. Traditionally urban brands are shifting to suburbia to capture new audiences. With consumers rooted in hybrid lifestyles and growing suburban demand, chains that adapt their footprints drive fresh traffic.
7. Expansion into college markets and celebrity pop-ups are helping retailers and malls connect with younger consumers. Brands that grew their footprints in college towns or on campuses increased their Gen Z traffic, as did malls that hosted celebrity or influencer activations.
2025 Set the Trends
Retail and dining faced another complex year in 2025. Persistent economic headwinds and uncertainty surrounding tariffs intensified consumers’ focus on value, even as affluent shoppers continued to indulge in luxury brands and upscale dining experiences.
Yet the year also revealed behavioral shifts that extended beyond price sensitivity. Shoppers increasingly prioritized brands that convey authenticity and a clear sense of purpose – those that deliver value not only through price, but through omnichannel convenience, product quality, and brand ethos.
For their part, retailers and malls continued to evolve, adopting strategies to capture both the expanding suburban market and a rising generation of younger consumers emerging as a defining force in retail.
How have these trends evolved, and how will they shape the retail landscape in 2026? We dove into the data to find out.
Bifurcation in Apparel and Dining
Off-Price, Thrift, and Luxury Lead in Apparel’s Widening Divide
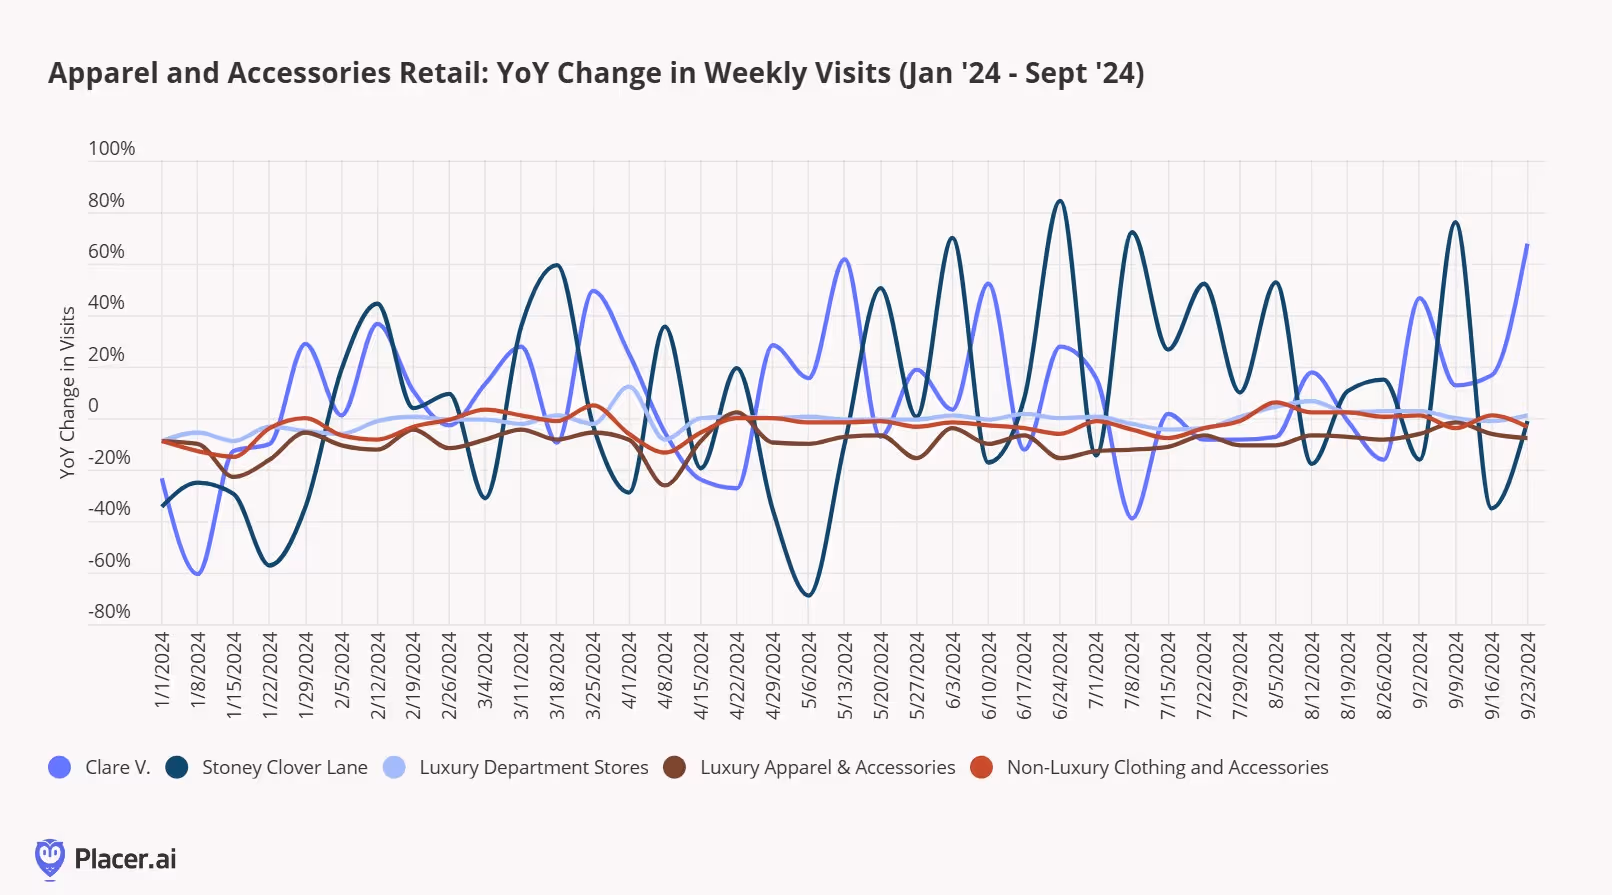
The first three quarters of 2025 underscored a widening divide in the apparel sector, with strength at both ends of the price and income spectrums.
Off-price retailers and thrift stores, which draw shoppers from lower- and middle-income trade areas, gained significant ground – reflecting consumers’ ongoing search for value and treasure-hunt experiences that feel both economical and rewarding. At the same time, luxury maintained modest growth, showing that high-income shoppers remain resilient and willing to spend on premium experiences. Meanwhile, traditional apparel and mid-tier department stores continued to see visit declines, signaling further pressure on the retail middle. Retailers such as Target and Kohl’s, traditional staples of this middle segment, are contending with the challenge of defining their identity to consumers in a market increasingly split between value and luxury.
Looking ahead to 2026, mid-tier retailers will need to navigate a complex and polarized landscape. Without the clear positioning enjoyed by value and luxury players, success will require sharper differentiation and disciplined execution. But though the middle remains a tough place to compete, it still holds potential: Brands that can redefine relevance – something many of these same chains achieved just a few years ago – stand to capture consumers with spending power.
Fine Dining and Fast Casual Succeed in a Bifurcated Landscape
A similar bifurcation dynamic is also unfolding in the dining sector.
Upscale full-service restaurants (FSRs) are outperforming their casual dining counterparts, as higher-income consumers – and those dining out for special occasions – seek elevated experiences at fine-dining chains.
At the same time, more cost-conscious diners are trading down from casual dining FSRs to fast-casual chains, which continue to outperform the casual dining segment. Fast-casual brands are also benefiting from trading up within the limited-service segment, as consumers who choose to eat out – rather than eat at home or grab a lower-cost prepared meal at a c-store or grocery – opt for more experiences that feel more premium yet remain accessible.
Brands Executing on Authenticity and Purpose
Across both retail and dining, bifurcation doesn’t tell the whole story. Even as spending concentrates at the high and low ends of the market, a growing number of brands are succeeding by delivering an experience that feels intentional, distinctive, and true to their identity. These concepts share a clear raison d’être – a sense of purpose that resonates with consumers – as well as successful execution. The data shows that brands providing this kind of “on-point” experience are driving consistent visit growth in 2025, signaling that authenticity may be important retail currency in 2026.
Barnes & Noble, Trader Joe’s, and Sprouts Stay True to Communities and Themselves
Trader Joe’s sustained momentum reflects its ability to make shopping feel like discovery. The chain’s locally-inspired assortments, roughly 80% private-label mix, and steady rotation of seasonal products keep visits fresh and engagement high.
Sprouts, for its part, continues to benefit from a sharpened identity centered on freshness, sustainability, and health. Its smaller-format stores, curated product mix, and messaging around healthy living have helped it build a loyal base of wellness‐oriented shoppers.
Meanwhile, Barnes & Noble’s transformation offers a compelling case study in the power of experience. Its strategy of empowering local managers to curate store selections and host community events has turned stores into cultural touchpoints – driving increased visits and dwell times.
All three brands derive their strength from their clarity of purpose – illustrating how authenticity and intentionality are becoming meaningful factors shaping consumer engagement.
Regional Players Tap Into Local Identity
Authenticity isn’t limited to national names. Regional players such as H-E-B and In-N-Out Burger demonstrate how deeply ingrained local identity can translate into sustained growth.
H-E-B’s community-driven ethos, local sourcing, and operational excellence have built trust across Texas markets, helping it remain one of the country’s most beloved grocery chains, with high rates of shoppers visiting multiple times a month. And in the quick-service category, California-native In-N-Out Burger stands out for its quality, nostalgia, and mystique, as the chain continues to attract visitation trends that exceed national QSR benchmarks.
These brands demonstrate that authenticity can have a local element. Their success reflects not just product strength or efficiency, but a deeper connection to the communities they serve.
The Convergence of Online and Offline
While regional and experience-driven brands continue to build deep consumer connections, the broader retail landscape is also being reshaped by operational innovation. As technology and infrastructure improve, retailers are finding new ways to merge digital efficiency with convenient physical touchpoints.
Demand for Online Shopping and Local Pick-Up
E-commerce growth and in-store activity are increasingly interconnected. Visits to ecommerce distribution centers* climbed steadily between October 2021 and September 2025, while the share of short, under-10-minute trips to big-box chains Target, Walmart, BJ’s Wholesale Club, and Sam’s Club also increased. Together, these patterns suggest that while online shopping continues to expand, consumers remain highly engaged with physical locations through buy-online-pick-up-in-store (BOPIS) and same-day fulfillment channels – combining the value of online deals with the convenience of quick, local pickup.
This trend also reflects ongoing advancements in AI-driven fulfillment and Walmart’s testing of dark stores – retail spaces converted into local fulfillment hubs that accelerate delivery and enable quick customer pickup. These innovations are shortening fulfillment windows while optimizing store networks for hybrid demand.
As retailers continue to blur the boundaries between digital and physical commerce in 2026, expect them to become increasingly complementary parts of a single, omnichannel ecosystem.
*The Placer.ai E-commerce Distribution Center Index measures foot traffic across more than 400 distribution centers nationwide, including facilities operated by leading retailers such as Amazon, Walmart, and Target. Designed as a barometer for U.S. e-commerce activity, the index captures two key audiences: employees, estimated through dwell-time patterns, and visitors, who often represent logistics partners delivering raw materials, moving in-process goods, or collecting finished products.
Digitally Native Brands Re-Engage Offline
The resurgence of digitally native brands embracing physical retail underscores how online and offline strategies are converging into an integrated model, combining digital efficiency with the benefits of a physical presence.
Framebridge, a DTC custom framing brand, offers a clear example of this trend. As the brand has expanded its footprint, the average number of monthly visits to each of its locations rose sharply throughout 2025.
Framebridge’s success lies in its well-executed omnichannel model. Customers can place orders online or in store, with the option to ship directly to their homes or pick up in person.
But for Framebridge, physical locations aren’t just about convenience. Art and memories are often one of a kind, so having knowledgeable staff in store and the opportunity to engage with materials firsthand transforms a transaction into a personalized, consultative experience.
Framebridge exemplifies how digitally native brands are merging the ease of online shopping with physical spaces that provide a personal touch. And more digitally native brands, like Gymshark, are looking to bring their business offline with the hope of adding value for consumers.
Suburban Investment Drives Growth
As retailers advance their omnichannel strategies, another enduring shift is reshaping the retail map post-pandemic – the continued rise of suburban traffic. Brands that entered the pandemic with strong suburban footprints were among the first to benefit as in-person activity rebounded, while urban-focused chains that expanded outward have met migrating consumers and captured new audiences anchored in hybrid lifestyles and local shopping routines.
Strategic Pivots Towards Suburbia
Large-format and drive-thru focused brands like Costco, Cava, and Dutch Bros. entered the pandemic era from a position of strength as they are traditionally situated in suburban and exurban areas. As consumers spent more time close to home and away from urban centers, these chains captured heightened local demand and saw visits rebound rapidly once in-person shopping resumed.
And as the pandemic reshaped consumer traffic patterns, brands like Shake Shack and Chipotle quickly recognized emerging opportunities in suburban markets and adjusted their strategies to capture this shifting demand. For Shake Shack – a brand once defined by its urban storefronts – the shift toward suburban drive-thrus and stand-alone locations represented a significant pivot. Chipotle followed a similar path, accelerating its suburban expansion through the rollout of “Chipotlane” drive-thru lanes.
Arriving somewhat later to the suburban landscape, sweetgreen, once synonymous with its urban footprint, opened its first drive-thru in 2022, and by 2024 had made suburban markets a core pillar of its growth strategy.
These real estate moves positioned all three brands to capture demand from remote and hybrid workers, helping sustain visit growth well above pre-pandemic baselines.
As suburban demand continues to grow, the suburbs will likely remain a critical growth frontier for many brands in the year ahead.
Strategy That Drives Traffic From Key Demographics
Investment in suburban markets underscores how changing market conditions and strategy adaptation can allow brands to meet consumers where they are. And a parallel trend is unfolding in college towns and youth-dense trade areas, where brands are channeling investment to capture rising Gen Z spending power.
Expansion in college-anchored markets, paired with celebrity and influencer-driven pop-ups, is helping retailers build cultural relevance and increase engagement with this emerging consumer base.
College Town Expansions Attract Gen Z Audiences
The graph below underscores how targeted expansion into college-anchored markets can meaningfully shift audience composition. Over the last several years, many brands have expanded their near-campus footprints – and in turn, attracted a higher share of the Spatial.ai:PersonaLive “Young Urban Singles” segment, one highly aligned with Gen Z consumers.
CAVA’s rapid unit growth, including openings near major universities and in college towns, helped the brand increase its share of “Young Urban Singles” within its captured trade areas between October 2018-September 2019 and October 2024-September 2025. Meanwhile, Panda Express and Raising Cane's, which already had relatively large shares of the segment six years ago, have also invested in college-adjacent locations, lifting their “Young Urban Singles” audience share.
Even legacy mass retailer Target benefited from small-format and large store expansions near universities – growing its captured market share of “Young Urban Singles”.
These shifts suggest that college towns will continue to be strategic growth markets, including for luxury brands like Hermès. By making inroads in college towns and with Gen Z shoppers, brands can strengthen loyalty early and build durable market share that remains as these young adults move on from campus life.
Influencer and Celebrity Pop-Ups Increase Gen Z Engagement
As Gen Z’s influence expands beyond campus borders, retail engagement is increasingly driven by cultural moments that resonate with this cohort. And malls are finding that temporary pop-ups including influencer collaborations and celebrity-led activations can attract these young consumers.
At The Grove, the Pandora pop-up with brand ambassador girl-group Katseye in October 2024 led to a modest but significant increase in the Gen Z-dominant “Young Professionals” and “Young Urban Singles” segments within the mall’s captured trade area during the first week of the activation – compared to the average for the last twelve months.
Similarly, at Westfield Century City, the Taylor Swift x TikTok activation from October 3rd-9th, 2025 – which allowed fans to immerse themselves in the sets from the viral “The Fate of Ophelia” music video boosted the shares of “Young Urban Singles” and Young Professionals”, underscoring the star power of everything Taylor Swift.
And at American Dream, the pattern extended beyond younger audiences. On September 5th and 6th, 2025, Ninja Kidz attended the grand opening of their Action Park while Salish Matters made an appearance at the mall on September 6th for her skincare pop-up – which drew such large crowds that it had to be shut down. During these two event days, the mall’s shares of both “Young Professionals” and “Ultra-Wealthy Families” increased substantially, highlighting that pop-up events can draw young and affluent family audiences.
Together, these examples reinforce that, in 2026, the integration of short-term pop-ups will continue to be a strategy for malls and individual brands to gain relevance for key demographic segments.
What Lies Ahead
2025 reinforced that retail remains as dynamic as ever. Value continues to anchor decisions, but consumers are redefining what value means – blending price sensitivity with expectations for authenticity. And in the current retail landscape, online and physical retail are growing more interconnected as consumers demand convenience and experience.
In 2026, adaptability will be retailers’ greatest competitive edge. The next era of retail will belong to brands that can continue to refine their operating strategy – while staying true to a clear brand identity.


.svg)


.avif)