

.svg)


Thank you! Your submission has been received!
Oops! Something went wrong while submitting the form.
0
0
0
0
----------
0
0
Articles
.avif)
Article
Frozen Yogurt's Comeback Is More Than NostalgiaFrozen yogurt is making a comeback, with visitation trends suggesting the category is benefiting from viral momentum and changing consumer habits.
Elizabeth Lafontaine
Jul 28, 2026
1 minute
Article
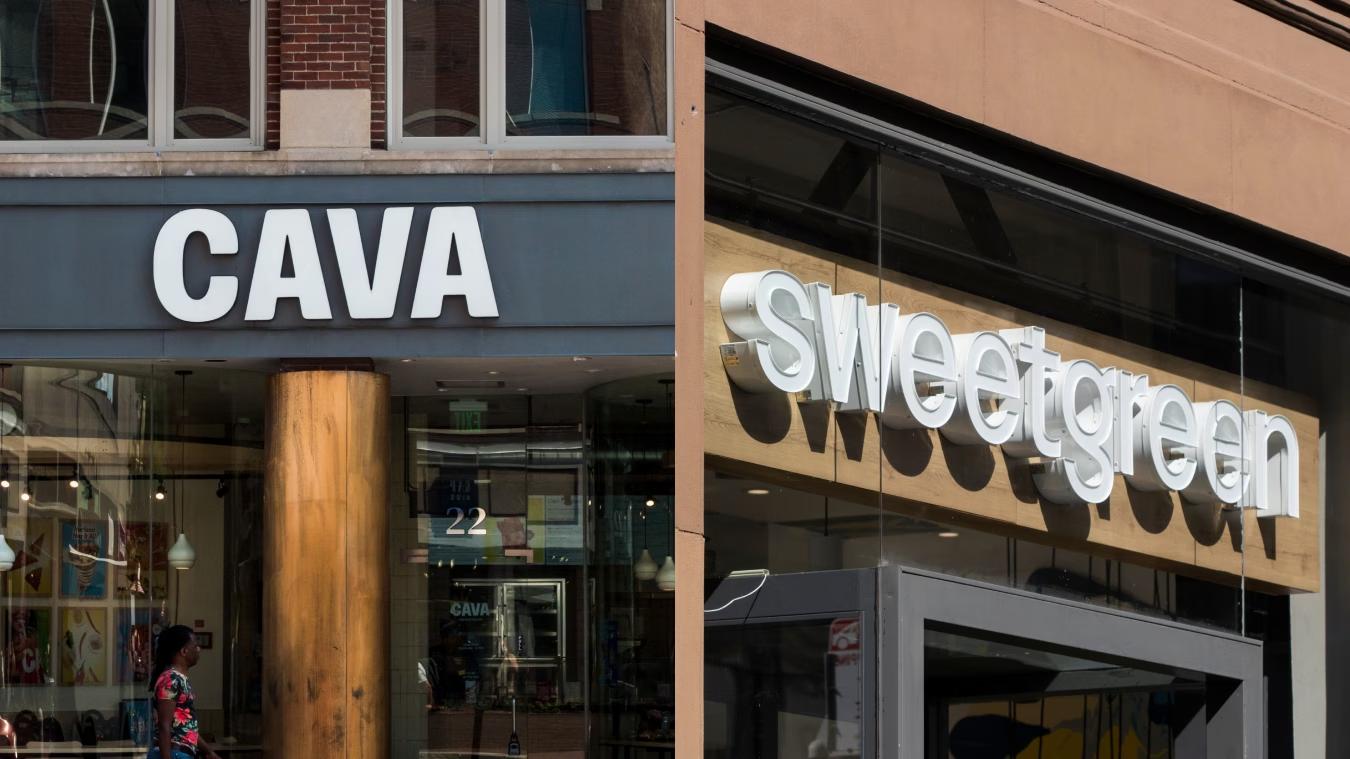
Sweetgreen Rebounds & CAVA Keeps ClimbingQ2 2026 visitation trends suggest that CAVA continues to sustain exceptional growth while sweetgreen's turnaround efforts are beginning to gain traction.
Shira Petrack
Jul 27, 2026
2 minutes
Article
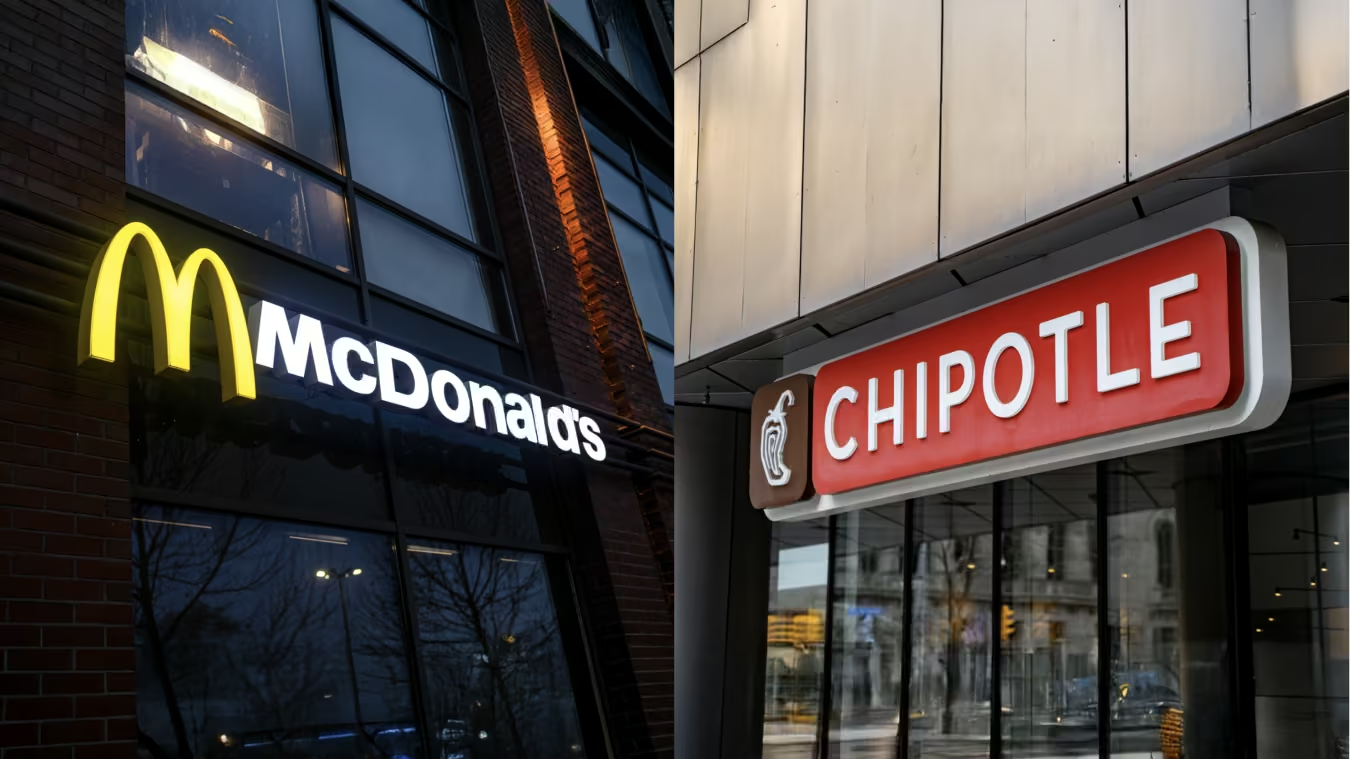
Why Chipotle and McDonald's Took Different Paths in Q2 2026Visitation data suggests customer demographics helped Chipotle outperform McDonald's in Q2 2026.
Shira Petrack
Jul 24, 2026
2 minutes
Article
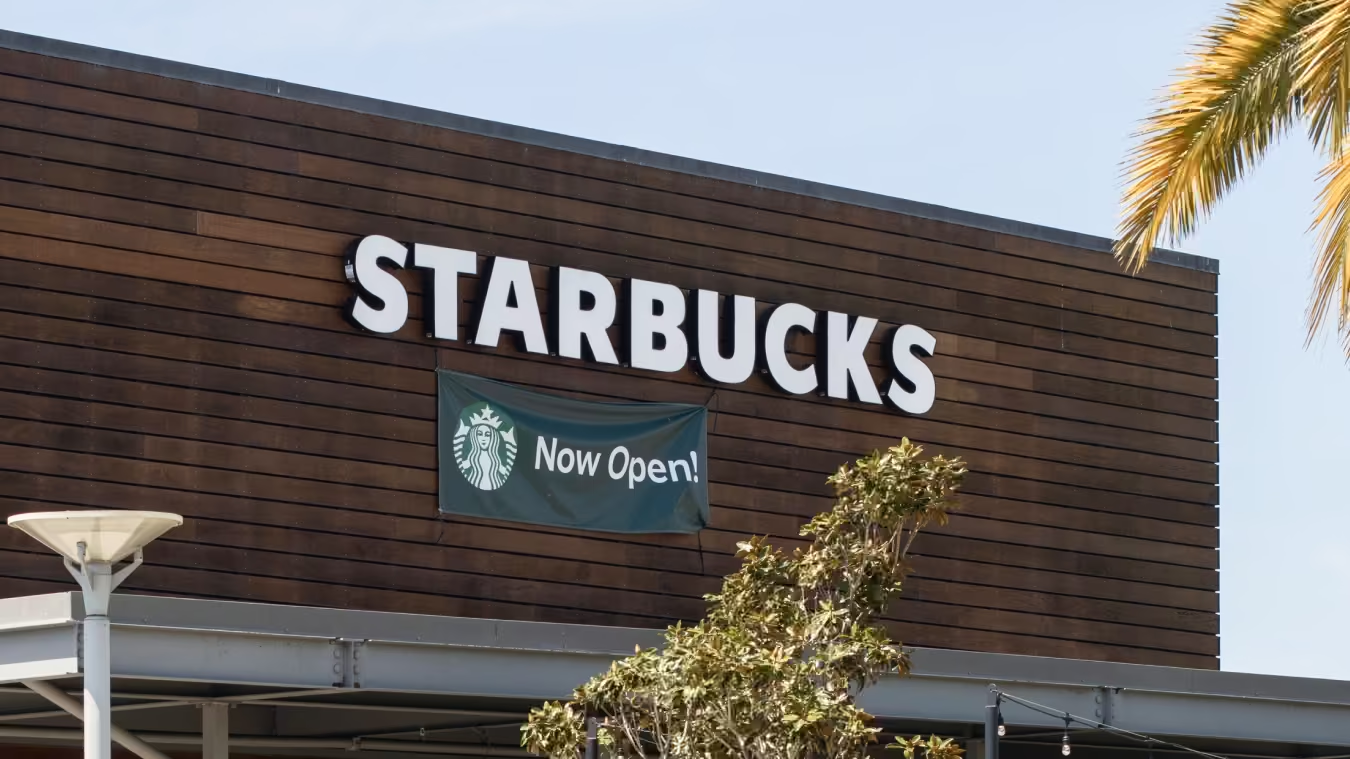
Traffic Data Suggests Starbucks' Turnaround Is Gaining Traction Traffic data suggests Starbucks' turnaround is gaining traction as visits and repeat customer frequency improve under the Back to Starbucks strategy.
Shira Petrack
Jul 23, 2026
Article
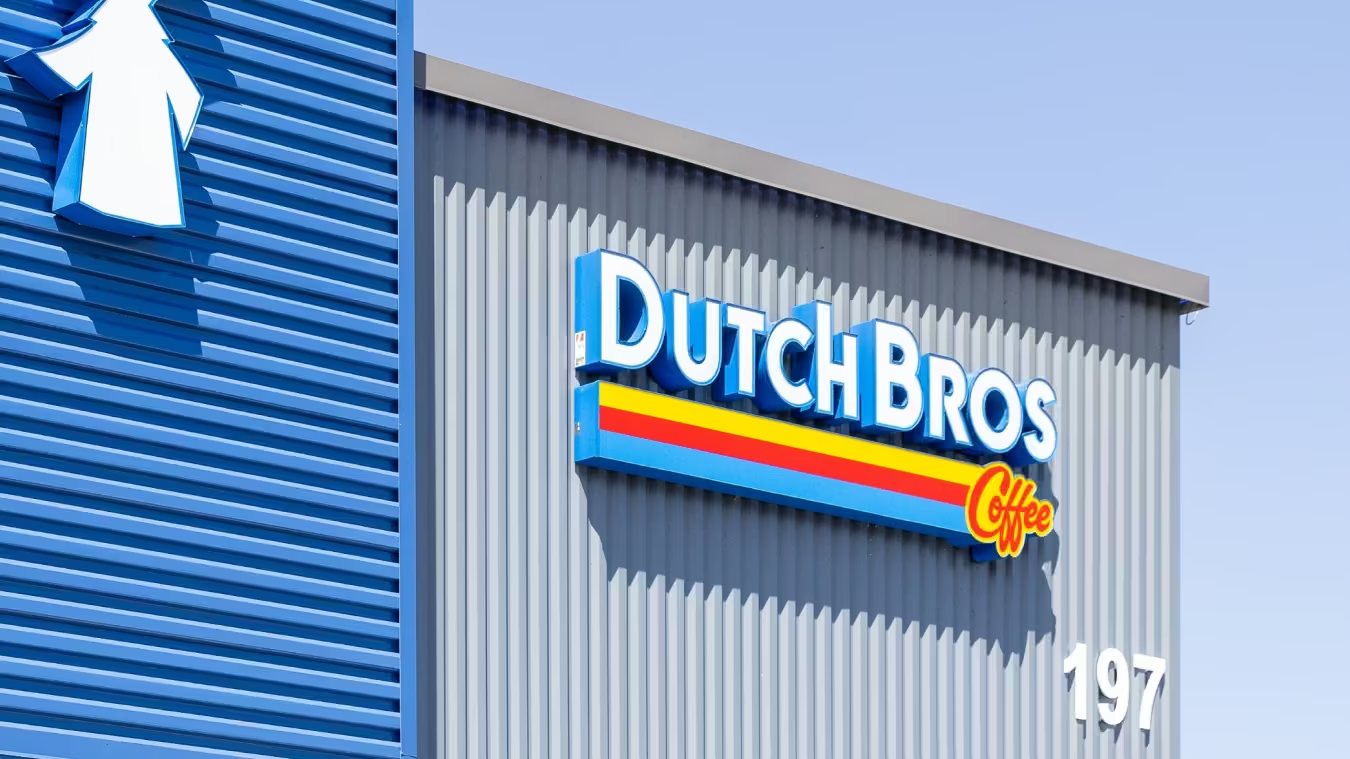
Dutch Bros' Traffic Trends Suggest the Growth Story Remains IntactDutch Bros' latest visitation data suggests that growing morning traffic and continued expansion helping offset softer same-store trends.
Shira Petrack
Jul 22, 2026
2 minutes
%20IPO.avif)
Article
How Tailored Brands Went From Bankruptcy to IPOExplore how Tailored Brands rebounded from bankruptcy to IPO, with Men's Wearhouse and Jos. A. Bank outperforming the apparel category ahead of its public debut.
Shira Petrack
Jul 21, 2026
2 minutes
Reports
INSIDER
Report
Five Ways Retailers Can Leverage AI Without Losing What WorksRead the report to learn how AI is changing store roles, operations, marketing, and fleet strategy – and how to apply it without undermining what already works.
January 29, 2026
INSIDER
Report
10 Top Brands to Watch in 2026Meet the ten retail and dining powerhouses, including H-E-B, Walmart, and Dave’s Hot Chicken, redefining success and winning consumer loyalty in 2026.
January 12, 2026
.avif)
INSIDER
Report
6 Coffee-Inspired Strategies That Can Reshape Dining in 2026Dive into the data to see how coffee became one of this year’s strongest dining performers – and explore strategies that can drive restaurant success across concepts in 2026.
December 18, 2025
Loading results...
We couldn't find anything matching your search.
Browse one of our topic pages to help find what you're looking for.
For more in-depth analyses on a variety of subjects, explore Reports.
For more in-depth analyses on a variety of subjects, explore Reports.

INSIDER
Stay Anchored: Subscribe to Insider & Unlock more Foot Traffic Insights
Gain insider insights with our in-depth analytics crafted by industry experts
— giving you the knowledge and edge to stay ahead.

