Skip to Main Content
Thank you! Your submission has been received!
Oops! Something went wrong while submitting the form.
0
0
0
0
----------
0
0
Articles
Article
adidas’ World Cup Win: Three Stripes, One Very Good June
Maytal Cohen
Jul 17, 2026
2 minutes

The World Cup Effect

The 2026 FIFA World Cup is already reshaping foot traffic across the country - filling stadiums, lifting restaurant traffic near host venues, and drawing fans to watch parties and festivals. But one of the tournament's clearest retail beneficiaries may be its most visible sponsor: adidas, supplier of the official Trionda match ball and kit provider to national teams from Mexico to Argentina.

From Slump to Surge

Heading into the spring, adidas stores were fighting an uphill battle - weekly visits ran below 2025 levels for most of April, bottoming out at -20.5% YoY the week of April 13th. Traffic gradually stabilized through May, and then the World Cup arrived.

During the week of June 8th – which included the tournament’s June 11th kickoff and the USMNT’s 4-1 opening win over Paraguay at SoFi Stadium – adidas store visits climbed 14.3% YoY. Momentum then accelerated the following week, the first full week of group-stage play, when the USMNT defeated Australia in Seattle and adidas visits surged 44.7% above the same week last year. 

Father’s Day, which fell on June 21st this year, may have contributed to that jump, since the comparison week in 2025 began the day after Father’s Day. But the magnitude of the spike, along with its staying power in subsequent weeks, suggests that tournament-driven excitement was the main driver.

adidas Scores a 44.7% Visit Surge as the World Cup Kicks Off

Weekly YoY Change in Visits to adidas Stores, Nationwide, Apr–Jun 2026

More Than a One-Week Spike

Big temporary visit spikes often fade fast – but this one hasn’t. During the weeks of June 22nd and June 29th, visits remained elevated more than 20% YoY – suggesting that the tournament is driving a sustained shift in demand, not just a burst of opening-week excitement. 

The Takeaway

The World Cup's foot traffic ripple effects extend well beyond the stadiums - into dining, retail, and beyond. And while global sponsorships are usually measured in impressions, location intelligence makes them measurable in visits. For adidas, supplying the match ball and outfitting some of the tournament's biggest teams moved fans into stores, week after week. With knockout rounds running through the July 19th final, the three stripes may not be done running up the score.

For more data-driven retail insights, visit placer.ai/anchor.

Article
Placer Top 5: Cities for Coffee Lovers
Lila Margalit
Jul 16, 2026
2 minutes

The Grounds for Growth

Coffee shops remain one of dining’s most dependable bright spots, as consumers continue to splurge on affordable indulgences even while cutting back on pricier outings. In H1 2026, coffee visits were up 4.1% year over year (YoY), even as overall dining traffic fell 0.4%. But in some metros, the caffeine rush was running much stronger.

This month's Placer 5 highlights the nation’s top five major coffee markets – metro areas that logged upwards of 10 million coffee shop visits in H1 2026, where coffee shops saw the most YoY visit growth. Each one is thriving for its own reasons, and together they show that there are many ways to win at coffee.

Orlando Leads America's Standout Coffee Destinations of 2026

The Top Five CBSAs by Year-over-Year Coffee Shop Visit Growth, H1 2026 vs. H1 2025

Analysis includes CBSAs with at least 10 million coffee visits in H1 2026.

A Different Roast in Every Metro

For many of these metros, coffee visit growth was driven at least in part by fleet expansion. But in all five markets, average visits per coffee shop also rose YoY, suggesting that existing venues are also drawing bigger crowds.

Still, each metro brews its own story.

In inland California’s Riverside and Bakersfield, the surges were powered primarily by Starbucks and Dutch Bros, with Bakersfield – the only analyzed metro without an increase in major coffee chain locations in H1 – seeing traffic at existing coffee shops rise significantly even as the overall store count edged down.

In Indianapolis and Kansas City, meanwhile, coffee visits were propelled in part by the drive-thru coffee wave sweeping the middle of the country – a format with so much momentum that Technomic’s 2026 America’s Favorite Chains ranking featured three drive-thru coffee brands in its top 10 for the first time ever. Alongside new Dutch Bros locations, fast-growing 7 Brew also expanded its footprint in both metros. Their car-friendly layouts make Indianapolis and Kansas City natural magnets for the format – and with per-location visits still climbing, the new stands appear to be filling up as fast as they open.

Orlando, for its part, appears to be riding a more general demand wave. The metro's population grew 1.29% between July 2024 and July 2025 – well ahead of the 0.52% national average – while record tourist visits kept vacation mornings busy. More residents and more visitors translate directly into more lattes – and several major chains added stores to keep pace.

However You Take It

Tourism and population growth in Orlando, a drive-thru boom in the heartland, and steady strength in inland California – the standout coffee metros of 2026 each found their own path to growth. And it's worth noting that all five sit far from Stars Hollow of Gilmore Girls’ fame: the Northeast may claim the diner-counter coffee mystique, but the caffeine craze is a truly national affair. 

The result is a coffee category that remains highly adaptable. Whether fueled by convenience, expansion, tourism, or loyal daily routines, America's coffee shop segment continues to find new ways to keep visits percolating. 

Article
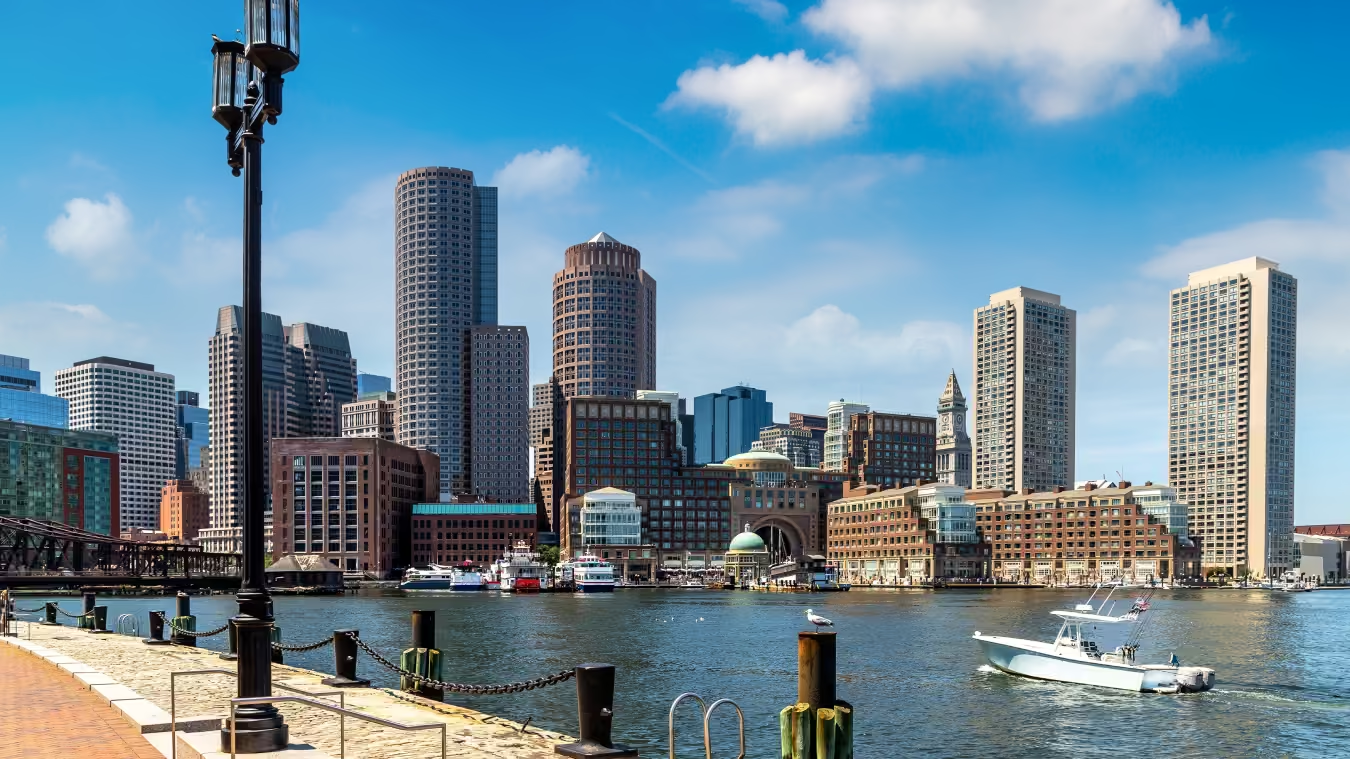
How Placemaking Powers Boston's Seaport
Ezra Carmel
Jul 15, 2026
4 minutes

Beyond the Bricks

Over the past two decades, Boston's Seaport has undergone a remarkable transformation – evolving from an underutilized stretch of waterfront into one of the city's most vibrant mixed-use destinations. The story of Seaport highlights a critical lesson in real estate development: What you build matters, but creating reasons for people to visit, linger, and return matters just as much.

Using AI-powered location intelligence, we explored Seaport's recent growth and the role of community programming, experiential retail, and other placemaking initiatives in making it one of Boston's premier retail corridors.

Seaport’s Rising Tides

Experiences and community have been central to Boston Seaport’s historic revitalization. In the late 2010s, mixed-use development and entertainment anchors helped to establish Seaport as a leisure-time destination, while initiatives like Snowport, Seaport Sweat, and The Current emphasized neighborhood programming and experiential concepts. During this period, visitation consistently peaked in the summer, which remained the corridor’s primary traffic driver.

And although visits to the corridor fell sharply at the onset of the pandemic, Seaport continued to invest in public spaces. When social gatherings resumed, new mixed-use projects like Harbor Way, The Superette, and The Paseo helped to reinforce Seaport as an experience-driven destination and fuel the neighborhood’s foot traffic rebound. 

Since then, expanded seasonal programming has diversified visitation beyond the summer months. The launch of The Holiday Market in 2021 complemented the already popular Snowport activation, creating a new seasonal traffic peak. Since its introduction, December has consistently generated a significant surge in visitation – a pattern that was largely absent before the pandemic.

Still, summer remains Seaport’s peak season, with the fair-weather appeal of its outdoor spaces becoming the backdrop for community and engagement. Seaport’s summer programming continues to expand, and with it, foot traffic to the corridor, which has risen nearly every year since COVID, exceeding pre-pandemic levels in the summer of 2025 and again in May and June 2026. And with new social venues, America 250 events, and World Cup action taking place in Boston and within the Seaport corridor, the stage is set for another robust summer season.

Enhanced Engagement 

While some of Seaport's visitation growth can be attributed to the neighborhood's continued real estate development, a closer look at visitor dwell times provides further evidence that foot traffic is being driven by deeper engagement, not just new construction. 

Extended visits consistently account for a significant share of Seaport’s overall traffic. Between January and June 2026, out-of-market visits lasting more than 150 minutes (excluding local employees) represented 39.7% of total visits to the corridor, up from 38.4% in 2025. And over the past six months, visits exceeding 150 minutes consistently outperformed overall visits year-over-year (YoY) – suggesting that visitors are becoming more engaged with the area's retail, dining, and public spaces. 

Affluent Audience 

Extended visits and increasing foot traffic aren't the only indicators of Seaport's upward trajectory. Audience segmentation suggests that the corridor’s experiential recreation and retail are helping to attract an affluent consumer base – a valuable cohort in today's bifurcated economic environment.

Location intelligence combined with the STI: PopStats dataset reveals that the Seaport retail corridor attracts a relatively affluent audience, with a trade area median household income (HHI) of $131.3K over the past six months, compared to $124.8K for the Boston-Cambridge-Newton, MA-NH CBSA overall. But concepts such as Ballers – a new padel and pickleball venue with social events – and The Current, a seasonal retail pop-up along Seaport's main pedestrian thoroughfare, draw even more affluent audiences. The captured market median HHIs for these venues were $143.6K and $144.1K, respectively.

Further analysis using the Spatial.ai: PersonaLive dataset suggests that Ballers and The Current attract distinct mixes of affluent consumers. The Current attracts a substantially larger share of Ultra Wealthy Families (24.5%) than either Ballers (17.5%) or the Seaport retail corridor overall (19.4%). Meanwhile, Ballers over-indexes for Educated Urbanites – affluent young professionals living in dense urban areas – relative to both The Current and the broader corridor. This suggests that Seaport's growing mix of experiential concepts is deepening the corridor's appeal across multiple affluent audience segments.

The Placemaking Playbook

For retail corridors, creating reasons to visit is just as important as creating places to shop.

Boston's Seaport illustrates how placemaking extends beyond development itself. While new retail, dining, and mixed-use projects have reshaped the neighborhood, the data suggests that ongoing investments in programming, public spaces, and experiential concepts have helped transform the corridor into a destination for community engagement.

As Seaport prepares for another busy summer, pairing physical development with curated experiences is likely to sustain the corridor's momentum.

For more insights, visit Placer.ai/anchor.

Article
Q2 2026 Thoughts
Ethan Chernofsky
Jul 14, 2026
4 minutes

The World Cup’s Retail Impact Begins

Spoiler Alert – one of the key pieces of our look back on Q3 will be a focus on those who benefitted from World Cup visitation. 

But soccer’s quadrennial – yup, it’s a word, I looked it up – kicked off in June, and brands like Chipotle got into the action. The chain's Buy One Get One (BOGO) free campaign on June 11th drove the highest visit count for the entire year, surpassing a former BOGO-driven peak in March. The lesson? Value works, but value plus a buzzy reason to visit works even better.

Home Improvement Latest Obstacle

It does feel like every time the wider home improvement sector is poised to have a breakout period, something happens to dampen the potential. In 2025, just as visits were starting to rise, momentum stalled as consumers faced with the threat of tariffs looked to offset the risk of rising prices by deferring certain purchases. And it happened in the middle of the segment’s seasonal peak.

In 2026, it was rising gas prices – again during the segment’s most highly trafficked period. Year-over-year visits for the sector went from up 3.6% on average for January and February, to being up just 0.4% on average for March, April and May year over year. The same was seen for the sector’s leaders with Home Depot going from average monthly visit increases of 2.7% in January and February to a decline of 0.2% in March and May, and Lowe’s going from 3.0% to up just 0.7% during those same periods.

The takeaway? The home improvement sector – and leaders Home Depot and Lowe’s – are probably in a better position than they are showing. A little bit of luck – or just the removal of bad timing – seems to be all that stands in the way of significant and ongoing visit growth. Just another reason why the segment and these chains in particular are high on our watch list for the second half of 2026.

Shein’s Bold Move

Many pontificated about why the rising retail leader would make a move on Everlane, pointing to the lift received from tapping into a socially conscious retail brand. And while this is very likely a piece of the puzzle, there are elements that should not be overlooked.

Not only does Everlane offer the positive brand lift associated with a player committed to certain values, it also offers more access to key markets and audiences – in this case young, high earning urban shoppers and wealthy families, among others. Shein – via a range of pop up experiments – has already displayed an understanding of the value of physical spaces and the benefits that come from offline touchpoints, especially with the aim of user acquisition. With Everlane, they leverage these touchpoints to bring customers – existing and potential – into an even larger world of apparel options.

And the user acquisition piece is key. The use of spaces as an entry point into the wider Shein ecosystem will offer massive long term potential. 

Gas Prices as a Loss Leader?

One of the more fascinating data points of the year thus far was the incredible correlation between rising gas prices and visits to membership clubs – Costco, BJ’s Wholesale, Sam’s Club – gas locations. 

The takeaway here is absolutely clear – when prices rise these locations are trusted by customers to provide the best possible value. But the really important takeaway is that these ‘shorter term’ swings have significant and long term impacts for these retailers. During the pandemic we saw that visits to locations like these don’t just provide a quick win, they indicate a likelihood that these visitors will now be making membership club locations a larger and ongoing part of their retail patterns.

Providing value amid surging gas prices is just another example of an opportunity these leaders are taking to create a win for customers – something they have proven uniquely capable of turning into long term loyalty.

Blockbuster Summer Trends

Super Mario launched at the very tail end of Q1, but it was the first signal of the huge potential movie theatre traffic would have in 2026. Obviously, the peak summer months of July and August will carry a huge amount of weight in this conversation, but the spikes driven by Toy Story 5 and others in Q2 were the necessary ‘next signal’ that the run of blockbusters scheduled for this year could drive big visits.

The other area to track here is who else benefits. We’ve talked a lot about limited time offers - especially those tied to movie releases or other anchors that create urgency. And with so many movies coming, and so many of these having significant retail and dining tie-ins, the wider impact could be even larger.

ICSC Vegas Takeaways

Every year we gather in Las Vegas for a pulse check on the state of retail real estate. And 2026 continued a trend of clear and significant confidence that the positioning of physical stores and dining locations is in a very strong place.

The big question is now less about how rosy or bleak the segment’s future is, but which players will take advantage of the current state of strength to future proof their portfolios by taking calculated risks on how to up level shopping centers and the retail spaces within them.

Article
June 2026 Placer.ai Office Index: A New Post-Pandemic Attendance High
Lila Margalit
Jul 13, 2026
3 minutes

The Tug-of-War Continues

The return-to-office (RTO) wars are grinding on. Mandates are expanding across the private and public sectors, and employers are getting more serious about enforcement. But even as the share of Fortune 100 companies requiring full-time in-person work has climbed to 55%, employees continue to push back in ways both visible and subtle – from protests and petitions to "hushed hybrid" workarounds and coffee badging – quiet quitting's caffeinated cousin.

So where does actual attendance stand? We dove into the data to find out.

June Sets a New RTO Record

Nationwide office visits in June 2026 jumped 8.5% year over year (YoY) and stood 21.0% below June 2019 levels. But June 2026 also came with a calendar assist: The month had 21 working days, compared to 20 in both June 2025 and June 2019. And Juneteenth fell on a Friday this year, rather than a Thursday as in 2025 – meaning the holiday landed on what is typically the week’s quietest office day, likely blunting its drag on attendance.

On a per-working-day basis, office visits rose a more modest 3.3% YoY, continuing the slow but stubborn climb the index has traced for the past several months. Still,  even when normalizing for business days, June emerged as the single busiest in-office month since COVID began in March 2020.

Adjusted for Working Days, June 2026 Marked a New High for Office Attendance

Nationwide Office Index, June 2026

Total Visits Avg. Visits Per Working Day
Compared to June 2019
Pre-pandemic
21.0%
Compared to June 2019
Pre-pandemic
24.8%
Compared to June 2025
Year over year
8.5%
Compared to June 2025
Year over year
3.3%
📅 June 2026 had 21 working days – versus 20 in both June 2025 and June 2019. That extra business day lifted total visits 8.5% year over year, while on a per-working-day basis office traffic rose 3.3%, continuing the gradual recovery.

Office Visits Indexed to June 2019

Click a key in the legend below to show or hide either line.

Total Visits Avg. per Working Day

Momentum Across the Board

Market-level data shows that many analyzed metros – including Atlanta, Boston, Chicago, Dallas, Houston, Los Angeles, and Miami – reached new post-pandemic office attendance highs in June after adjusting for the number of working days. But Miami was the clear June RTO winner, with office visits surpassing 2019 levels. Critically, this is still an estimation, and it remains to be seen how Miami’s recovery will continue to play out over the long term. Still, the obvious takeaway is that the Florida hub – which has also seen the lowest vacancy rate of any major U.S. office market in recent months – is in an especially strong position as the RTO continues. 

Visits to Miami Offices Exceeded Pre-Pandemic Levels in June 2026

Office Visits by Market, June 2026 vs. June 2019

Per-working-day figures adjust for June 2026's 21 working days versus 20 in June 2019.

Every major market also posted YoY visit growth, with Los Angeles leading the pack. The market was lapping a soft June 2025, when local protests disrupted commuting routines – though L.A.’s solid showing in recent months suggests the jump reflects more than an easy comparison. San Francisco ranked second, continuing the momentum that made it the YoY growth leader in May. And Chicago also logged a substantial YoY gain, moving into the middle of the post-pandemic recovery pack as its downtown office market recorded its first vacancy decline in fifteen quarters in Q2 2026.

Los Angeles and San Francisco Led Year-over-Year Office Visit Growth in June 2026

Office Visits by Market, June 2026 vs. June 2025

Per-working-day figures adjust for June 2026's 21 working days versus 20 in June 2025.

Still Climbing

With California's four-day mandate for state workers taking effect July 1, and full-time office requirements set to roll out this September at employers including Fidelity and TikTok, the second half of 2026 may bring fresh RTO tailwinds. Will these policies push the recovery even further ahead? And will Miami's move above pre-COVID levels hold over time? Time will tell.

For more data-driven RTO insights, visit Placer.ai/anchor

Article
Retail Corridors Emerge as Evening Destinations in 2026
Ezra Carmel & Lila Margalit
Jul 9, 2026
3 minutes

An Urban Bellwether

From Michigan Avenue to Main Street, retail corridors have long served as a barometer of urban vitality – and their post-pandemic trajectory has become one of the most closely watched storylines in retail real estate. We dove into the data to see how these districts are faring in 2026, and what AI-powered location analytics reveal about when, and why, people are showing up.

The Corridor Recovery Takes a Breather

After several years of gradual improvement, the post-pandemic retail corridor recovery stalled in early 2026. Visits remained 12.6% below 2019 levels in Q1 and 12.5% below in Q2, reversing some of the gains made during 2025, when the Q2 gap had narrowed to just 9.5%. The slowdown coincided with a broader cooling in consumer demand, with shoppers growing more selective and trimming discretionary purchases.

Friday and Saturday Nights Are Back

So what's behind the widening recovery gap, and where are the bright spots?

Comparing Q2 2026 visits with Q2 2019 by daypart shows that the largest remaining recovery deficit is concentrated during weekday mornings and afternoons, with Monday through Friday visits between 8 AM and 4 PM still running 20% to 30% below pre-pandemic levels. That pattern closely mirrors office attendance trends, which remained roughly 30% below pre-pandemic levels this spring. With fewer commuters flowing through downtowns, the coffee runs, lunch breaks, and midday errands that once sustained corridor traffic have yet to fully return.

The pattern, however, is markedly different on weekends. Visit gaps on Saturday and Sunday mornings were significantly smaller and narrowed throughout the day before disappearing entirely by evening. Friday visits between 8 PM and 12 AM exceeded Q2 2019 levels by 2.0%, while Saturday evening visits came in 0.7% above the pre-pandemic benchmark. 

In other words, while remote work continues to reshape weekday routines and consumers scale back daytime shopping, retail corridors remain compelling destinations for entertainment, socializing, and dining. The trend aligns with broader consumer spending patterns showing that even budget-conscious households continue to prioritize experiences over goods. It also reflects what's happening on the ground in downtowns nationwide, where restaurants are driving retail leasing activity and cities are increasingly investing in programming that attracts visitors after hours.

Evening Momentum Continues YoY 

Year-over-year data also shows that even though the recovery has stalled, evenings continue to gain momentum. Although overall retail corridor visits fell 3.3% in Q2 2026, nighttime visitation increased across the week. Weekend mornings also proved relatively resilient, while midday shopping hours (12 PM to 4 PM) posted the steepest declines. 

At the same time, average dwell time rose from 118.0 minutes in Q2 2025 to 123.0 minutes in Q2 2026. So while fewer people may be visiting retail corridors overall, those who do visit appear to be staying longer than they did last year – a sign that corridors are increasingly serving as destinations in their own right.

The Night Shift

Retail corridors may still be waiting on the office worker, but they are increasingly winning the off-the-clock hours. As daytime shopping softens, evenings have become the corridors' engine of growth – especially on Fridays and Saturdays – powered by diners, barhoppers, and experience-seekers who keep showing up even as they tighten their belts elsewhere. For retailers, restaurants, property owners, and civic stakeholders, the evening and weekend windows look like the clearest growth opportunities of 2026.

Will nighttime visitation continue gaining momentum in the second half of the year? Or will office recovery finally spark a weekday daytime comeback? Visit placer.ai/anchor to find out.

Reports
INSIDER
Exploring the Car Dealership Space
Dive into the foot traffic and audience segmentation data to find out where the new and used auto dealership space stands in 2023.

Overview 

This report leverages location intelligence data to analyze the auto dealership market in the United States. By looking at visit trends to branded showrooms, used car lots, and mixed inventory dealerships – and analyzing the types of visitors that visit each category – this white paper sheds light on the state of car dealership space in 2023. 

Shifts in Auto Dealerships Visit Trends

Prior to the pandemic and throughout most of 2020, visits to both car brand and used-only dealerships followed relatively similar trends. But the two categories began to diverge in early 2021. 

Visits to car brand dealerships briefly returned to pre-pandemic levels in mid-2021, but traffic fell consistently in the second half of the year as supply-chain issues drove consistent price increases. So despite the brief mid-year bump, 2021 ended with overall new car sales – as well as overall foot traffic to car brand dealerships – below 2019 levels. Visits continued falling in 2022 as low inventory and high prices hampered growth.  

Meanwhile, although the price for used cars rose even more (the average price for a new and used car was up 12.1% and 27.1% YoY, respectively, in September 2021), used cars still remained, on average, more affordable than new ones. So with rising demand for alternatives to public transportation – and with new cars now beyond the reach of many consumers – the used car market took off and visits to used car dealerships skyrocketed for much of 2021 and into 2022. But in the second half of last year, as gas prices remained elevated – tacking an additional cost onto operating a vehicle – visits to used car dealerships began falling dramatically. 

Now, the price of both used and new cars has finally begun falling slightly. Foot traffic data indicates that the price drops appear to be impacting the two markets differently. So far this year, sales and visits to dealerships of pre-owned vehicles have slowed, while new car sales grew – perhaps due to the more significant pent-up demand in the new car market. The ongoing inflation, which has had a stronger impact on lower-income households, may also be somewhat inhibiting used-car dealership visit growth. At the same time, foot traffic to used car dealerships did remain close to or slightly above 2019 levels for most of 2023, while visits to branded dealerships were significantly lower year-over-four-years. 

The situation remains dynamic – with some reports of prices creeping back up – so the auto dealership landscape may well continue to shift going into 2024.

Used Cars Appeal to a Range of Consumers

With car prices soaring, the demand for pre-owned vehicles has grown substantially. Analyzing the trade area composition of leading dealerships that sell used cars reveals the wide spectrum of consumers in this market. 

Dealerships carrying a mixed inventory of both new and used vehicles seem to attract relatively high-income consumers. Using the STI: Popstats 2022 data set to analyze the trade areas of Penske Automotive, AutoNation, and Lithia Auto Stores – which all sell used and new cars – reveals that the HHI in the three dealerships’ trade areas is higher than the nationwide median. Differences did emerge within the trade areas of the mixed inventory car dealerships, but the range was relatively narrow – between $77.5K to $84.5K trade area median HHI. 

Meanwhile, the dealerships selling exclusively used cars – DriveTime, Carvana, and CarMax – exhibited a much wider range of trade area median HHIs. CarMax, the largest used-only car dealership in the United States, had a yearly median HHI of $75.9K in its trade area – just slightly below the median HHI for mixed inventory dealerships Lithia Auto Stores and AutoNation and above the nationwide median of $69.5K. Carvana, a used car dealership that operates according to a Buy Online, Pick Up in Store (BOPIS) model, served an audience with a median HHI of $69.1K – more or less in-line with the nationwide median. And DriveTime’s trade areas have a median HHI of $57.6K – significantly below the nationwide median. 

The variance in HHI among the audiences of the different used-only car dealerships may reflect the wide variety of offerings within the used-car market – from virtually new luxury vehicles to basic sedans with 150k+ miles on the odometer. 

Tesla Leads the Car Brand Dealership Pack

Visits to car brands nationwide between January and September 2023 dipped 0.9% YoY, although several outliers reveal the potential for success in the space even during times of economic headwinds. 

Visits to Tesla’s dealerships have skyrocketed recently, perhaps thanks to the company’s frequent price cuts over the past year – between September 2022 and 2023, the average price for a new Tesla fell by 24.7%. And with the company’s network of Superchargers gearing up to serve non-Tesla Electric Vehicles (EVs), Tesla is finding room for growth beyond its already successful core EV manufacturing business and positioning itself for a strong 2024. 

Japan-based Mazda used the pandemic as an opportunity to strengthen its standing among U.S. consumers, and the company is now reaping the fruits of its labor as visits rise YoY. Porsche, the winner of U.S New & World Report Best Luxury Car Brand for 2023, also outperformed the wider car dealership sector. Kia – owned in part by Hyundai –  and Hyundai both saw their foot traffic increase YoY as well, thanks in part to the popularity of their SUV models.

Diving into Local Markets 

Analyzing dealerships on a national level can help car manufacturers make macro-level decisions on marketing, product design, and brick-and-mortar fleet configurations. But diving deeper into the unique characteristics of each dealership’s trade area on a state level reveals differences that can serve brands looking to optimize their offerings for their local audience. 

For example, analyzing the share of households with children in the trade areas of four car brand dealership chains in four different states reveals significant variation across the regional markets. 

Nationwide, Tesla served a larger share of households with children than Kia, Ford, or Land Rover. But focusing on California shows that in the Golden State, Kia’s trade area population included the largest share of this segment than the other three brands, while Land Rover led this segment in Illinois. Meanwhile, Ford served the smallest share of households with children on a nationwide basis – but although the trend held in Illinois and Pennsylvania, California Ford dealerships served more households with children than either Tesla or Land Rover.  

Leveraging Location Intelligence for Car Dealerships

Leveraging location intelligence to analyze car dealerships adds a layer of consumer insights to industry provided sales numbers. Visit patterns and audience demographics reveal how foot traffic to used-car lots, mixed inventory dealerships, and manufacturers’ showrooms change over time and who visits these businesses on a national or regional level. These insights allow auto industry stakeholders to assess current demand, predict future trends, and keep a finger on the pulse of car-purchasing habits in the United States. 

Loading results...
We couldn't find anything matching your search.
Browse one of our topic pages to help find what you're looking for.
For more in-depth analyses on a variety of subjects, explore Reports.
The Anchor Logo
INSIDER
Stay Anchored: Subscribe to Insider & Unlock more Foot Traffic Insights
Gain insider insights with our in-depth analytics crafted by industry experts
— giving you the knowledge and edge to stay ahead.
Subscribe