

.svg)


Thank you! Your submission has been received!
Oops! Something went wrong while submitting the form.
0
0
0
0
----------
0
0
Articles

Article
Introducing AnchoredDiscover the biggest takeaways from Season 1 of Anchored, featuring expert conversations on retail growth, retail media, consumer behavior, and the future of physical stores.
Rebecca Bleier
Jun 25, 2026
3 minutes
Article
Chipotle's World Cup BOGO Becomes Its Busiest Day of 2026Chipotle's June 11 World Cup jersey BOGO drove visits 57.2% above the 2026 daily average – its busiest day of the year, outpacing March's tattoo promo.
Lila Margalit
Jun 24, 2026
2 minutes
.avif)
Article
Why Darden is Outpacing Full-Service Dining in 2026Foot traffic data shows Darden's visits up 2.4% YoY in Q1 2026 while full-service dining fell. See how LongHorn, Olive Garden, and fine dining drove the outperformance.
Lila Margalit
Jun 23, 2026
3 minutes
Article
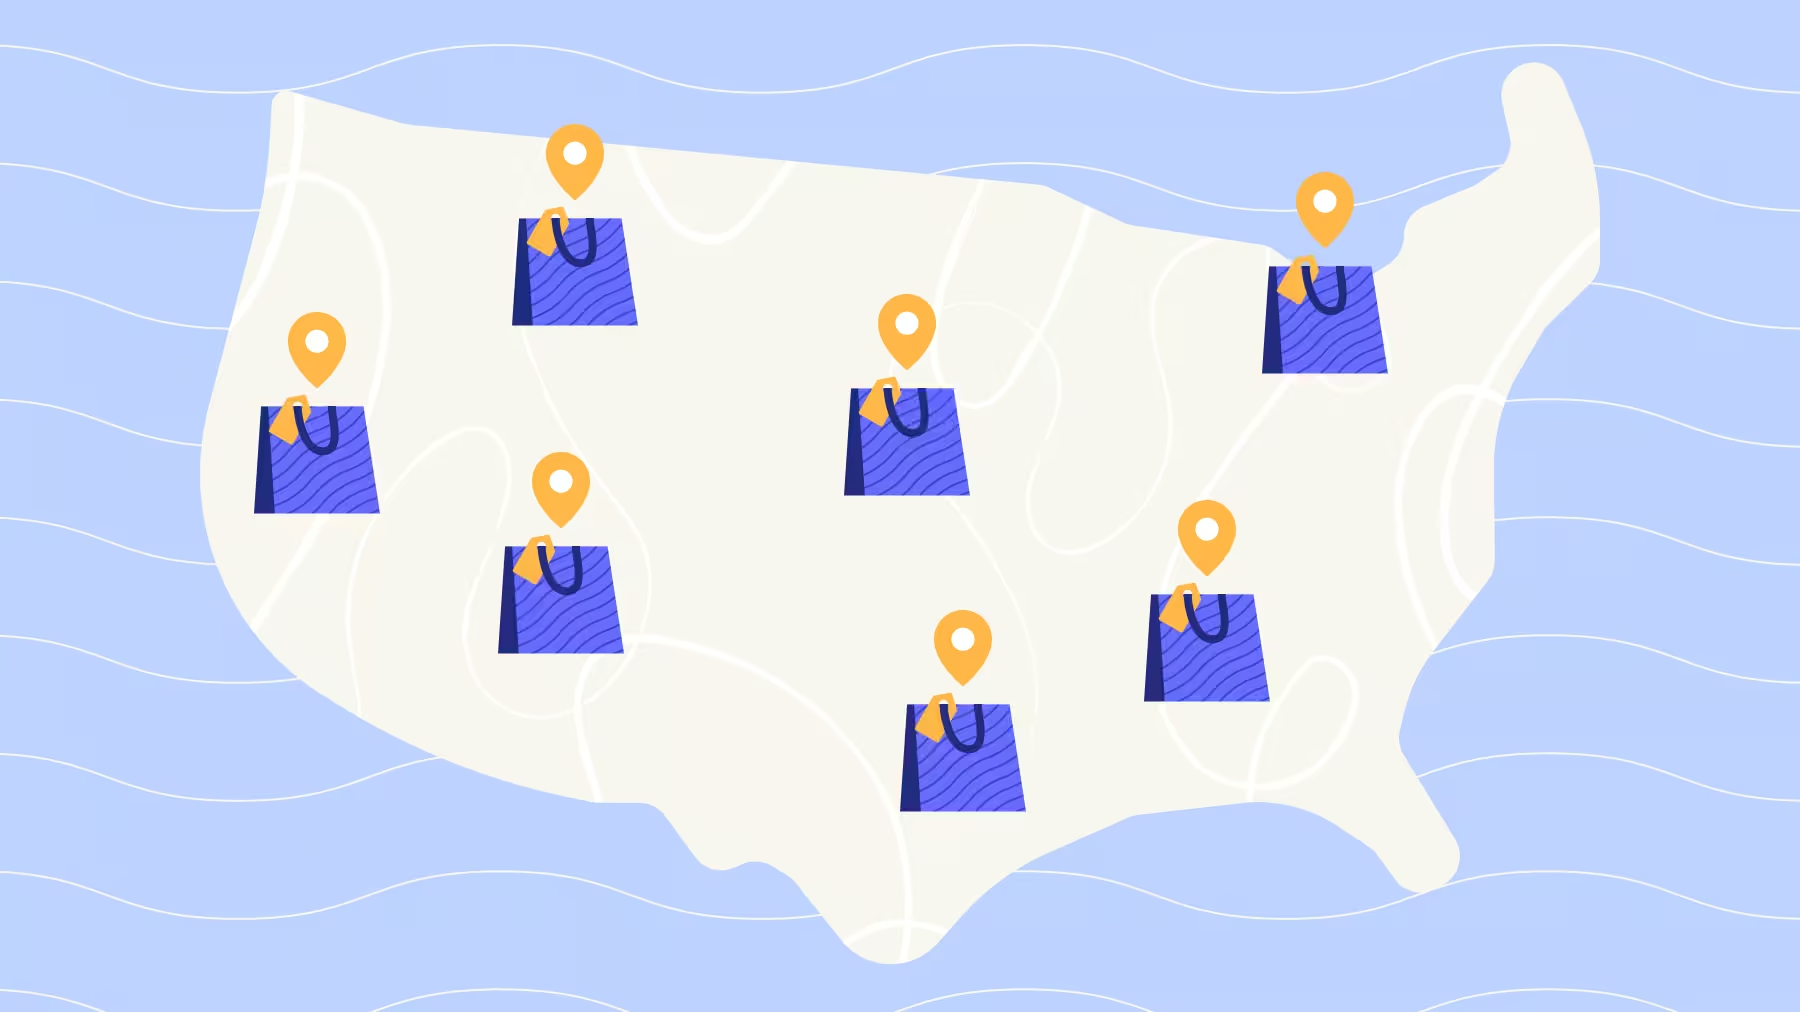
State-Level Retail in May 2026: Mapping the Impact of Gas Prices and Severe WeatherMay 2026 retail traffic was steady nationally, but rising gas prices and severe weather shaped state-level visitation patterns across the U.S.
Ezra Carmel
Jun 22, 2026
3 minutes
Article
What To Expect From Prime Day 2026? Amazon (AMZN) Prime Day 2026 arrives June 23-26. Retail foot traffic data suggests consumers remain engaged despite economic pressures, with major retailers entering the promotional season from varying positions of strength.
Shira Petrack
Jun 18, 2026
4 minutes
Article
What Can Restaurants Expect This Father’s Day?Placer.ai foot traffic data reveals what Mother's Day 2026 signals for Father's Day, why Texas Roadhouse is poised to dominate, and how consumers are spending on special-occasion dining.
Lila Margalit
Jun 17, 2026
3 minutes
Reports
INSIDER
The Healthcare Opportunity in GroceryAs healthcare continues to evolve, nontraditional providers like grocery stores are cementing their roles as key players in the space. How do wellness offerings impact grocery store visitation patterns? We dove into the data to find out.
September 12, 2024
7 minutes

INSIDER
Retail Giants in 2024: Walmart, Costco, and Target's Competitive EdgeSee how retail giants Walmart, Costco, and Target fared in the first half of 2024 – and explore factors contributing to their success.
August 23, 2024
7 minutes
INSIDER
How Local Events Promote Economic Growth: The Civic Impact of Summer EventsDive into the data to find out how major summer events – including Lollapalooza in Chicago and Governors Ball in New York – drive community engagement and boost the local economy.
August 22, 2024
5 minutes
Loading results...
We couldn't find anything matching your search.
Browse one of our topic pages to help find what you're looking for.
For more in-depth analyses on a variety of subjects, explore Reports.
For more in-depth analyses on a variety of subjects, explore Reports.

INSIDER
Stay Anchored: Subscribe to Insider & Unlock more Foot Traffic Insights
Gain insider insights with our in-depth analytics crafted by industry experts
— giving you the knowledge and edge to stay ahead.

