.png)
.png)

.png)
.png)


The 2026 FIFA World Cup is already reshaping foot traffic across the country - filling stadiums, lifting restaurant traffic near host venues, and drawing fans to watch parties and festivals. But one of the tournament's clearest retail beneficiaries may be its most visible sponsor: adidas, supplier of the official Trionda match ball and kit provider to national teams from Mexico to Argentina.
Heading into the spring, adidas stores were fighting an uphill battle - weekly visits ran below 2025 levels for most of April, bottoming out at -20.5% YoY the week of April 13th. Traffic gradually stabilized through May, and then the World Cup arrived.
During the week of June 8th – which included the tournament’s June 11th kickoff and the USMNT’s 4-1 opening win over Paraguay at SoFi Stadium – adidas store visits climbed 14.3% YoY. Momentum then accelerated the following week, the first full week of group-stage play, when the USMNT defeated Australia in Seattle and adidas visits surged 44.7% above the same week last year.
Father’s Day, which fell on June 21st this year, may have contributed to that jump, since the comparison week in 2025 began the day after Father’s Day. But the magnitude of the spike, along with its staying power in subsequent weeks, suggests that tournament-driven excitement was the main driver.
Big temporary visit spikes often fade fast – but this one hasn’t. During the weeks of June 22nd and June 29th, visits remained elevated more than 20% YoY – suggesting that the tournament is driving a sustained shift in demand, not just a burst of opening-week excitement.
The World Cup's foot traffic ripple effects extend well beyond the stadiums - into dining, retail, and beyond. And while global sponsorships are usually measured in impressions, location intelligence makes them measurable in visits. For adidas, supplying the match ball and outfitting some of the tournament's biggest teams moved fans into stores, week after week. With knockout rounds running through the July 19th final, the three stripes may not be done running up the score.
For more data-driven retail insights, visit placer.ai/anchor.

Coffee shops remain one of dining’s most dependable bright spots, as consumers continue to splurge on affordable indulgences even while cutting back on pricier outings. In H1 2026, coffee visits were up 4.1% year over year (YoY), even as overall dining traffic fell 0.4%. But in some metros, the caffeine rush was running much stronger.
This month's Placer 5 highlights the nation’s top five major coffee markets – metro areas that logged upwards of 10 million coffee shop visits in H1 2026, where coffee shops saw the most YoY visit growth. Each one is thriving for its own reasons, and together they show that there are many ways to win at coffee.
For many of these metros, coffee visit growth was driven at least in part by fleet expansion. But in all five markets, average visits per coffee shop also rose YoY, suggesting that existing venues are also drawing bigger crowds.
Still, each metro brews its own story.
In inland California’s Riverside and Bakersfield, the surges were powered primarily by Starbucks and Dutch Bros, with Bakersfield – the only analyzed metro without an increase in major coffee chain locations in H1 – seeing traffic at existing coffee shops rise significantly even as the overall store count edged down.
In Indianapolis and Kansas City, meanwhile, coffee visits were propelled in part by the drive-thru coffee wave sweeping the middle of the country – a format with so much momentum that Technomic’s 2026 America’s Favorite Chains ranking featured three drive-thru coffee brands in its top 10 for the first time ever. Alongside new Dutch Bros locations, fast-growing 7 Brew also expanded its footprint in both metros. Their car-friendly layouts make Indianapolis and Kansas City natural magnets for the format – and with per-location visits still climbing, the new stands appear to be filling up as fast as they open.
Orlando, for its part, appears to be riding a more general demand wave. The metro's population grew 1.29% between July 2024 and July 2025 – well ahead of the 0.52% national average – while record tourist visits kept vacation mornings busy. More residents and more visitors translate directly into more lattes – and several major chains added stores to keep pace.
Tourism and population growth in Orlando, a drive-thru boom in the heartland, and steady strength in inland California – the standout coffee metros of 2026 each found their own path to growth. And it's worth noting that all five sit far from Stars Hollow of Gilmore Girls’ fame: the Northeast may claim the diner-counter coffee mystique, but the caffeine craze is a truly national affair.
The result is a coffee category that remains highly adaptable. Whether fueled by convenience, expansion, tourism, or loyal daily routines, America's coffee shop segment continues to find new ways to keep visits percolating.

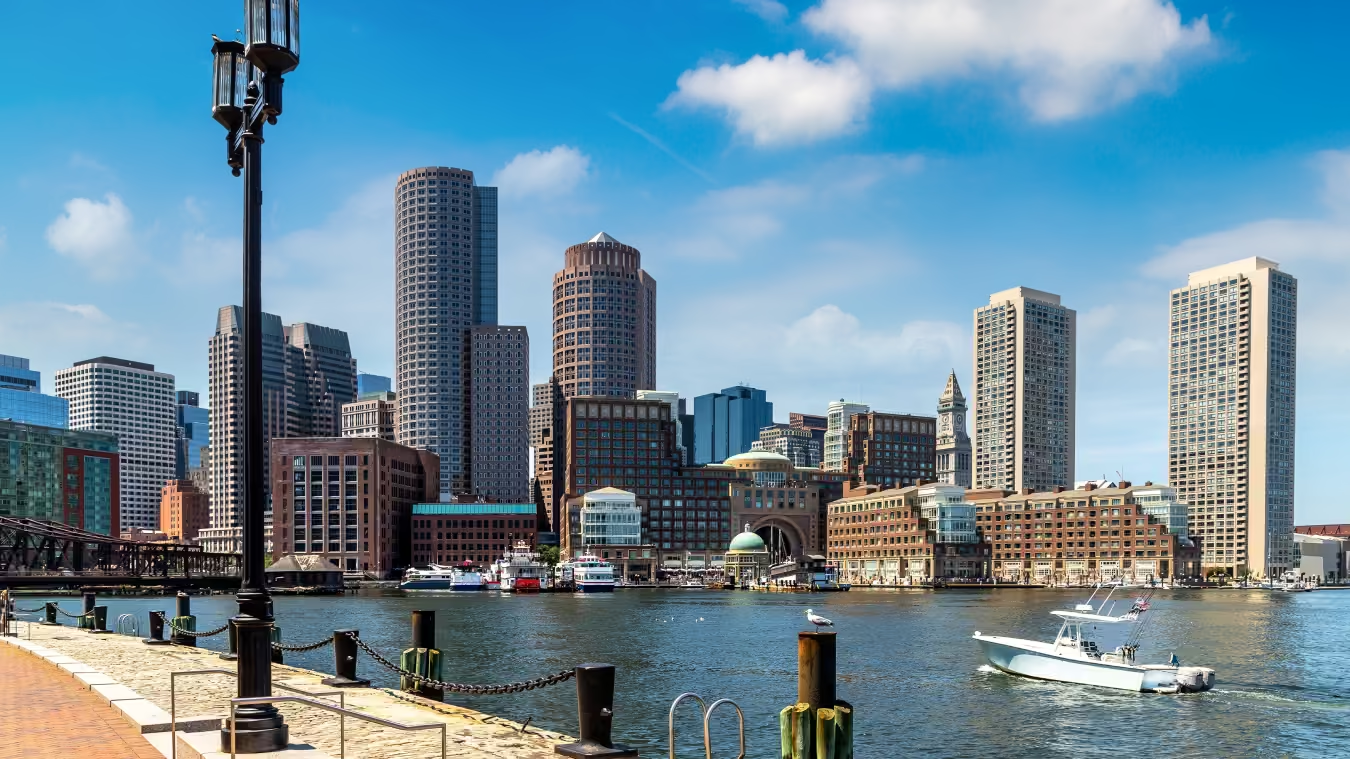
Over the past two decades, Boston's Seaport has undergone a remarkable transformation – evolving from an underutilized stretch of waterfront into one of the city's most vibrant mixed-use destinations. The story of Seaport highlights a critical lesson in real estate development: What you build matters, but creating reasons for people to visit, linger, and return matters just as much.
Using AI-powered location intelligence, we explored Seaport's recent growth and the role of community programming, experiential retail, and other placemaking initiatives in making it one of Boston's premier retail corridors.
Experiences and community have been central to Boston Seaport’s historic revitalization. In the late 2010s, mixed-use development and entertainment anchors helped to establish Seaport as a leisure-time destination, while initiatives like Snowport, Seaport Sweat, and The Current emphasized neighborhood programming and experiential concepts. During this period, visitation consistently peaked in the summer, which remained the corridor’s primary traffic driver.
And although visits to the corridor fell sharply at the onset of the pandemic, Seaport continued to invest in public spaces. When social gatherings resumed, new mixed-use projects like Harbor Way, The Superette, and The Paseo helped to reinforce Seaport as an experience-driven destination and fuel the neighborhood’s foot traffic rebound.
Since then, expanded seasonal programming has diversified visitation beyond the summer months. The launch of The Holiday Market in 2021 complemented the already popular Snowport activation, creating a new seasonal traffic peak. Since its introduction, December has consistently generated a significant surge in visitation – a pattern that was largely absent before the pandemic.
Still, summer remains Seaport’s peak season, with the fair-weather appeal of its outdoor spaces becoming the backdrop for community and engagement. Seaport’s summer programming continues to expand, and with it, foot traffic to the corridor, which has risen nearly every year since COVID, exceeding pre-pandemic levels in the summer of 2025 and again in May and June 2026. And with new social venues, America 250 events, and World Cup action taking place in Boston and within the Seaport corridor, the stage is set for another robust summer season.
While some of Seaport's visitation growth can be attributed to the neighborhood's continued real estate development, a closer look at visitor dwell times provides further evidence that foot traffic is being driven by deeper engagement, not just new construction.
Extended visits consistently account for a significant share of Seaport’s overall traffic. Between January and June 2026, out-of-market visits lasting more than 150 minutes (excluding local employees) represented 39.7% of total visits to the corridor, up from 38.4% in 2025. And over the past six months, visits exceeding 150 minutes consistently outperformed overall visits year-over-year (YoY) – suggesting that visitors are becoming more engaged with the area's retail, dining, and public spaces.
Extended visits and increasing foot traffic aren't the only indicators of Seaport's upward trajectory. Audience segmentation suggests that the corridor’s experiential recreation and retail are helping to attract an affluent consumer base – a valuable cohort in today's bifurcated economic environment.
Location intelligence combined with the STI: PopStats dataset reveals that the Seaport retail corridor attracts a relatively affluent audience, with a trade area median household income (HHI) of $131.3K over the past six months, compared to $124.8K for the Boston-Cambridge-Newton, MA-NH CBSA overall. But concepts such as Ballers – a new padel and pickleball venue with social events – and The Current, a seasonal retail pop-up along Seaport's main pedestrian thoroughfare, draw even more affluent audiences. The captured market median HHIs for these venues were $143.6K and $144.1K, respectively.
Further analysis using the Spatial.ai: PersonaLive dataset suggests that Ballers and The Current attract distinct mixes of affluent consumers. The Current attracts a substantially larger share of Ultra Wealthy Families (24.5%) than either Ballers (17.5%) or the Seaport retail corridor overall (19.4%). Meanwhile, Ballers over-indexes for Educated Urbanites – affluent young professionals living in dense urban areas – relative to both The Current and the broader corridor. This suggests that Seaport's growing mix of experiential concepts is deepening the corridor's appeal across multiple affluent audience segments.
For retail corridors, creating reasons to visit is just as important as creating places to shop.
Boston's Seaport illustrates how placemaking extends beyond development itself. While new retail, dining, and mixed-use projects have reshaped the neighborhood, the data suggests that ongoing investments in programming, public spaces, and experiential concepts have helped transform the corridor into a destination for community engagement.
As Seaport prepares for another busy summer, pairing physical development with curated experiences is likely to sustain the corridor's momentum.
For more insights, visit Placer.ai/anchor.

Spoiler Alert – one of the key pieces of our look back on Q3 will be a focus on those who benefitted from World Cup visitation.
But soccer’s quadrennial – yup, it’s a word, I looked it up – kicked off in June, and brands like Chipotle got into the action. The chain's Buy One Get One (BOGO) free campaign on June 11th drove the highest visit count for the entire year, surpassing a former BOGO-driven peak in March. The lesson? Value works, but value plus a buzzy reason to visit works even better.
It does feel like every time the wider home improvement sector is poised to have a breakout period, something happens to dampen the potential. In 2025, just as visits were starting to rise, momentum stalled as consumers faced with the threat of tariffs looked to offset the risk of rising prices by deferring certain purchases. And it happened in the middle of the segment’s seasonal peak.
In 2026, it was rising gas prices – again during the segment’s most highly trafficked period. Year-over-year visits for the sector went from up 3.6% on average for January and February, to being up just 0.4% on average for March, April and May year over year. The same was seen for the sector’s leaders with Home Depot going from average monthly visit increases of 2.7% in January and February to a decline of 0.2% in March and May, and Lowe’s going from 3.0% to up just 0.7% during those same periods.
The takeaway? The home improvement sector – and leaders Home Depot and Lowe’s – are probably in a better position than they are showing. A little bit of luck – or just the removal of bad timing – seems to be all that stands in the way of significant and ongoing visit growth. Just another reason why the segment and these chains in particular are high on our watch list for the second half of 2026.
Many pontificated about why the rising retail leader would make a move on Everlane, pointing to the lift received from tapping into a socially conscious retail brand. And while this is very likely a piece of the puzzle, there are elements that should not be overlooked.
Not only does Everlane offer the positive brand lift associated with a player committed to certain values, it also offers more access to key markets and audiences – in this case young, high earning urban shoppers and wealthy families, among others. Shein – via a range of pop up experiments – has already displayed an understanding of the value of physical spaces and the benefits that come from offline touchpoints, especially with the aim of user acquisition. With Everlane, they leverage these touchpoints to bring customers – existing and potential – into an even larger world of apparel options.
And the user acquisition piece is key. The use of spaces as an entry point into the wider Shein ecosystem will offer massive long term potential.
One of the more fascinating data points of the year thus far was the incredible correlation between rising gas prices and visits to membership clubs – Costco, BJ’s Wholesale, Sam’s Club – gas locations.
The takeaway here is absolutely clear – when prices rise these locations are trusted by customers to provide the best possible value. But the really important takeaway is that these ‘shorter term’ swings have significant and long term impacts for these retailers. During the pandemic we saw that visits to locations like these don’t just provide a quick win, they indicate a likelihood that these visitors will now be making membership club locations a larger and ongoing part of their retail patterns.
Providing value amid surging gas prices is just another example of an opportunity these leaders are taking to create a win for customers – something they have proven uniquely capable of turning into long term loyalty.
Super Mario launched at the very tail end of Q1, but it was the first signal of the huge potential movie theatre traffic would have in 2026. Obviously, the peak summer months of July and August will carry a huge amount of weight in this conversation, but the spikes driven by Toy Story 5 and others in Q2 were the necessary ‘next signal’ that the run of blockbusters scheduled for this year could drive big visits.
The other area to track here is who else benefits. We’ve talked a lot about limited time offers - especially those tied to movie releases or other anchors that create urgency. And with so many movies coming, and so many of these having significant retail and dining tie-ins, the wider impact could be even larger.
Every year we gather in Las Vegas for a pulse check on the state of retail real estate. And 2026 continued a trend of clear and significant confidence that the positioning of physical stores and dining locations is in a very strong place.
The big question is now less about how rosy or bleak the segment’s future is, but which players will take advantage of the current state of strength to future proof their portfolios by taking calculated risks on how to up level shopping centers and the retail spaces within them.
%20(1).avif)
The return-to-office (RTO) wars are grinding on. Mandates are expanding across the private and public sectors, and employers are getting more serious about enforcement. But even as the share of Fortune 100 companies requiring full-time in-person work has climbed to 55%, employees continue to push back in ways both visible and subtle – from protests and petitions to "hushed hybrid" workarounds and coffee badging – quiet quitting's caffeinated cousin.
So where does actual attendance stand? We dove into the data to find out.
Nationwide office visits in June 2026 jumped 8.5% year over year (YoY) and stood 21.0% below June 2019 levels. But June 2026 also came with a calendar assist: The month had 21 working days, compared to 20 in both June 2025 and June 2019. And Juneteenth fell on a Friday this year, rather than a Thursday as in 2025 – meaning the holiday landed on what is typically the week’s quietest office day, likely blunting its drag on attendance.
On a per-working-day basis, office visits rose a more modest 3.3% YoY, continuing the slow but stubborn climb the index has traced for the past several months. Still, even when normalizing for business days, June emerged as the single busiest in-office month since COVID began in March 2020.
Nationwide Office Index, June 2026
| Total Visits | Avg. Visits Per Working Day |
|---|---|
|
Compared to June 2019
Pre-pandemic
▼21.0%
|
Compared to June 2019
Pre-pandemic
▼24.8%
|
|
Compared to June 2025
Year over year
▲8.5%
|
Compared to June 2025
Year over year
▲3.3%
|
Click a key in the legend below to show or hide either line.
Market-level data shows that many analyzed metros – including Atlanta, Boston, Chicago, Dallas, Houston, Los Angeles, and Miami – reached new post-pandemic office attendance highs in June after adjusting for the number of working days. But Miami was the clear June RTO winner, with office visits surpassing 2019 levels. Critically, this is still an estimation, and it remains to be seen how Miami’s recovery will continue to play out over the long term. Still, the obvious takeaway is that the Florida hub – which has also seen the lowest vacancy rate of any major U.S. office market in recent months – is in an especially strong position as the RTO continues.
Every major market also posted YoY visit growth, with Los Angeles leading the pack. The market was lapping a soft June 2025, when local protests disrupted commuting routines – though L.A.’s solid showing in recent months suggests the jump reflects more than an easy comparison. San Francisco ranked second, continuing the momentum that made it the YoY growth leader in May. And Chicago also logged a substantial YoY gain, moving into the middle of the post-pandemic recovery pack as its downtown office market recorded its first vacancy decline in fifteen quarters in Q2 2026.
With California's four-day mandate for state workers taking effect July 1, and full-time office requirements set to roll out this September at employers including Fidelity and TikTok, the second half of 2026 may bring fresh RTO tailwinds. Will these policies push the recovery even further ahead? And will Miami's move above pre-COVID levels hold over time? Time will tell.
For more data-driven RTO insights, visit Placer.ai/anchor.
.avif)
From Michigan Avenue to Main Street, retail corridors have long served as a barometer of urban vitality – and their post-pandemic trajectory has become one of the most closely watched storylines in retail real estate. We dove into the data to see how these districts are faring in 2026, and what AI-powered location analytics reveal about when, and why, people are showing up.
After several years of gradual improvement, the post-pandemic retail corridor recovery stalled in early 2026. Visits remained 12.6% below 2019 levels in Q1 and 12.5% below in Q2, reversing some of the gains made during 2025, when the Q2 gap had narrowed to just 9.5%. The slowdown coincided with a broader cooling in consumer demand, with shoppers growing more selective and trimming discretionary purchases.
So what's behind the widening recovery gap, and where are the bright spots?
Comparing Q2 2026 visits with Q2 2019 by daypart shows that the largest remaining recovery deficit is concentrated during weekday mornings and afternoons, with Monday through Friday visits between 8 AM and 4 PM still running 20% to 30% below pre-pandemic levels. That pattern closely mirrors office attendance trends, which remained roughly 30% below pre-pandemic levels this spring. With fewer commuters flowing through downtowns, the coffee runs, lunch breaks, and midday errands that once sustained corridor traffic have yet to fully return.
The pattern, however, is markedly different on weekends. Visit gaps on Saturday and Sunday mornings were significantly smaller and narrowed throughout the day before disappearing entirely by evening. Friday visits between 8 PM and 12 AM exceeded Q2 2019 levels by 2.0%, while Saturday evening visits came in 0.7% above the pre-pandemic benchmark.
In other words, while remote work continues to reshape weekday routines and consumers scale back daytime shopping, retail corridors remain compelling destinations for entertainment, socializing, and dining. The trend aligns with broader consumer spending patterns showing that even budget-conscious households continue to prioritize experiences over goods. It also reflects what's happening on the ground in downtowns nationwide, where restaurants are driving retail leasing activity and cities are increasingly investing in programming that attracts visitors after hours.
Year-over-year data also shows that even though the recovery has stalled, evenings continue to gain momentum. Although overall retail corridor visits fell 3.3% in Q2 2026, nighttime visitation increased across the week. Weekend mornings also proved relatively resilient, while midday shopping hours (12 PM to 4 PM) posted the steepest declines.
At the same time, average dwell time rose from 118.0 minutes in Q2 2025 to 123.0 minutes in Q2 2026. So while fewer people may be visiting retail corridors overall, those who do visit appear to be staying longer than they did last year – a sign that corridors are increasingly serving as destinations in their own right.
Retail corridors may still be waiting on the office worker, but they are increasingly winning the off-the-clock hours. As daytime shopping softens, evenings have become the corridors' engine of growth – especially on Fridays and Saturdays – powered by diners, barhoppers, and experience-seekers who keep showing up even as they tighten their belts elsewhere. For retailers, restaurants, property owners, and civic stakeholders, the evening and weekend windows look like the clearest growth opportunities of 2026.
Will nighttime visitation continue gaining momentum in the second half of the year? Or will office recovery finally spark a weekday daytime comeback? Visit placer.ai/anchor to find out.

The full-service dining segment has experienced its fair share of challenges over the past few years, with pandemic-era closures, rising food and labor costs, and cutbacks in discretionary spending contributing to visit lags. In 2024, visits were down 0.2% year over year (YoY) and remained 8.4% below 2019 levels – a reflection of the significant number of venues that permanently closed over COVID and a testament to the industry's ongoing struggle to regain its pre-pandemic footing.
Yet, even in a difficult environment, some full-service restaurant (FSR) chains are thriving. These brands aren’t waiting for the industry to rebound – they're becoming trendsetters in their own right, proving that stand-out strategy is everything in a challenging market.
This white paper explores brands that are harnessing three key differentiators – fixed-price value offerings, elevated social experiences, and a laser focus on product – to drive full-service dining success in 2025.
One of the most defining trends over the past few years has been the unrelenting march of price increases. And as consumers continue to seek out ways to save, some chains are staying ahead of the pack with fixed-price value offerings that help diners squeeze out the very best bang for their buck.
Golden Corral, the all-you-can-eat buffet chain that lets kids under three eat for free, is one FSR that is benefiting from consumers’ current value orientation. Despite closing several locations in 2024, overall visits to the chain still tracked closely with 2023 levels, declining by just 0.5% – while the average number visits to each Golden Corral restaurant grew 3.8% YoY.
Golden Corral’s value proposition is resonating strongly with budget-conscious Americans eager to enjoy a wide variety of comfort foods at an affordable price. The chain’s visitors tend to come from trade areas with lower median household incomes (HHIs) than traditional full-service restaurant (FSR) diners. And these patrons are willing to travel to enjoy the chain’s value buffet offerings, many of which are situated in rural areas and may require a longer drive. In 2024, 25.2% of Golden Corral’s diners came from over 30 miles away – compared to just 19.2% for the wider FSR segment.
Golden Corral’s continued flourishing proves that in an era of rising costs, diners are willing to go the extra mile (literally) for a restaurant that delivers both quality and affordability.
Children’s party space and eatertainment destination Chuck E. Cheese has had a transformative few years. Following the retirement of its iconic animatronic band, the chain shifted its focus to a new membership model, announcing a revamped Summer of Fun pass in May 2024 – including unlimited visits over a two-month period, steep discounts on food, and up to 250 games per day. The pass proved incredibly popular, with YoY visits surging by 15.6% in May 2024, when the offer launched – a sharp turnaround from the YoY visit declines of the previous months. Recognizing the strong demand, Chuck E. Cheese extended the program year-round – and the strategy has paid off as YoY visits remained positive through the end of 2024.
A closer look at the data suggests that parents are making full use of their unlimited passes: The share of weekday visits was higher in H2 2024 than in H2 2023, likely due to families using their passes for weekday entertainment rather than reserving visits for weekends and special occasions.
At the same time, the share of repeat visitors – those frequenting the chain at least twice a month – also grew. Although these repeat visitors may not purchase additional gameplay beyond the flat fee, their more frequent on-site presence likely translates into increased sales of pizza and other menu items.
While value has been a major motivator for restaurant-goers in recent years, low prices aren’t the only drivers of FSR success. Brands offering unique experiences aimed at maximizing social interaction are also seeing outsized gains.
Though many of these more innovative venues tend to be on the more expensive side, they draw enthusiastic crowds willing to pony up for concepts that combine good food with fun social occasions. And some of the more successful ones bolster perceived value through offerings like fixed-price menus or club memberships.
Korean cuisine has been on the rise in recent years, with restaurants like Bonchon Chicken and GEN Korean BBQ House making significant waves in the dining space. Another chain drawing attention is KPOT Korean BBQ and Hot Pot, which began modestly in 2018 and has since expanded to over 150 locations nationwide.
Diners at KPOT can customize their meals by selecting from a variety of proteins, broths, sauces, and side dishes, known as banchan, while barbecuing or cooking in a hotpot at their table and sipping on the drinks from the menu’s extensive selection. And though pricier than Golden Corral, KPOT also offers an all-you-can-eat experience that lets customers squeeze the most value out of their indulgence.
Location intelligence shows that KPOT’s experiential dining model is resonating with customers: Since Q4 2019, the average number of visits to each KPOT location has risen steadily – even as the chain has grown its footprint – while the average dwell time has also increased. Indeed, rather than a quick dining stop, KPOT has become a destination for guests to linger, enjoying both food and drinks – and an interactive and social experience.
By positioning themselves as gathering places for fine wine aficionados, wine-club-focused concepts such as Postino WineCafe and Cooper’s Hawk Winery are also benefiting from today’s consumers’ emphasis on social experiences. The two upscale dining destinations offer club memberships that combine periodic wine releases with a variety of perks.
And the data suggests that the model is strongly resonating with diners. Both Postino and Cooper’s Hawk have grown their footprints over the past year, driving substantial YoY chain-wide visit increases while average visits per location grew as well – showing that the expansions and experiential offerings are meeting robust demand.
And analyzing the two chains’ captured markets shows that the wine club model enjoys broad appeal across a variety of audience segments.
Unsurprisingly, both wine clubs’ visitor bases include higher-than-average shares of affluent consumers with money to spend, including Experian: Mosaic’s “Power Elite”, “Booming with Confidence”, and “Flourishing Families” segments (the nation’s wealthiest families, as well as affluent suburban and middle-aged households). But the two chains also attract younger, more budget-conscious consumers – Postino, which has many downtown locations, is popular among “Singles and Starters”, while Cooper’s Hawk is popular among “Promising Families” - i.e. young couples with children.
The success of the two brands across various segments underscores the impact of a distinctive experience – especially when paired with a loyalty-boosting membership – in attracting today’s consumers.
Value offerings and unique experiences have the power to drive restaurant visits – but ultimately, a good meal in an inviting atmosphere is a draw in and of itself, as is shown by the success of First Watch and Firebirds Wood Fired Grill.
Breakfast-only restaurant First Watch excels at ambiance and menu innovation, changing up its offerings five times a year and striving to maintain a neighborhood feel at each of its locations.
First Watch has made a point of leaning into its strengths, eschewing discounts in favor of a consistently elevated dining experience and doubling down its strongest day part (weekend brunch), rather than trying to artificially drive up interest at other times.
And the strategy appears to be working: In 2024, visits to First Watch increased 6.6% YoY – with Saturdays and Sundays between 11:00 A.M. and 1:00 P.M. remaining its busiest dayparts by far. Visitors to First Watch also tend to linger over their meals more than at other breakfast chains – in 2024, the restaurant experienced an average dwell time of 54.9 minutes, significantly longer than the 48.7-minute average at other breakfast-focused restaurants.
By focusing on what matters most to its diners – innovative and exciting food and a welcoming atmosphere that allows patrons to enjoy their meals at a leisurely pace – First Watch is continuing to flourish.
Another chain that is growing its footprint and its audience on the strength of a menu and ambiance-focused approach is Firebirds Wood Fired Grill. The chain, known for its “polished casual” vibe and bold, unique flavors, added several new restaurants last year, leading to a 6.5% increase in overall visits. Over the same period, the average number of visits to each Firebirds location held steady – showing that the new restaurants aren’t cannibalizing existing business.
The chain’s success may rest, in part, on its locating its venues in areas rife with enthusiastic foodies. Data from Spatial.ai’s FollowGraph shows that in 2024, Firebird’s trade areas had significantly higher shares of “BBQ Lovers”, “Gourmet Burger Lovers,” and “Foodies” than the nationwide average. This suggests that Firebirds is attracting diners who prioritize the experience of eating – key for a chain that prides itself on putting good food first. The chain is also known for its welcoming decor and design – another aspect that may lead to its strong visit success.
Necessity often serves as the mother of invention, and challenging economic periods continue to spark new trends and innovations in the dining scene. From a heightened focus on value – drawing families and lower-HHI consumers willing to travel for a good deal – to the growing appeal of social dining and the timeless draw of good food – new trends are emerging to meet changing consumer expectations.

Stadiums and arenas – and the communities they call home – have a stake in cultivating engaged team fanbases eager to participate in live events. And venues and teams can employ a variety of strategies to strengthen their connection with fans and draw crowds to the stands.
In this report, we leverage location analytics and audience segmentation to uncover some of the ways that sports franchises and venues are driving engagement – attracting visitors from farther away and appealing to fans more likely to splurge on stadium fare. How does the signing of a star athlete impact arena visitor profiles? What happens to stadium visitation trends when a team’s performance improves dramatically? And how can teams and venues tailor their offerings to more effectively cater to visitor preferences?
We dove into the data to find out.
In sports, the signing of a star athlete can have a ripple effect across the organization, hometown, and league. In addition to driving up overall attendance at games, star power can impact everything from visit frequency to audience profile – and the buying power of stadium attendees.
Lionel Messi’s move to Inter Miami CF after decades of European play brought a foot traffic boost to Chase Stadium (formerly DRV PNK Stadium). But it also shifted the demographics of stadium visitors and increased the distance they traveled to attend a game.
At Inter Miami’s 2022 and 2023 home openers without Messi (he joined the team mid-season in 2023), only 6.4% and 5.3% of visitors to Chase Stadium came from over 250 miles away. But for the 2024 home opener with Messi on the squad, 31.3% of stadium visitors traveled more than 250 miles to attend.
The demographics of visitors at the home opener also changed with Messi on the team. Trade area data combined with the Spatial.ai: PersonaLive dataset reveals that the 2024 home opener received a smaller share of households in the “Near-Urban Diverse Families” (11.2%) and “Young Urban Singles” (7.2%) segments than the two previous years. Meanwhile, shares of “Sunset Boomers” (13.0%) and “Ultra Wealthy Families” (20.1%) increased, indicating that Messi brought an older and more affluent demographic of visitors to the stadium compared to previous years. Messi’s arrival has generated increased revenue for Inter Miami CF, Major League Soccer, and Apple TV+, which has exclusive streaming rights for MLS games. And an influx of affluent out-of-town visitors also has the potential to drive positive outcomes for tourism and employment in the Miami area.
Caitlin Clark’s WNBA debut was another star-powered game changer – this time for women’s basketball. After dazzling the sports world during her college basketball career, Caitlin Clark was drafted first overall to the Indiana Fever before the 2024 WNBA season. The superstar’s arrival has had a staggering economic impact on the city of Indianapolis and the Fever franchise, highlighting the benefit of a top athlete within the local community. However, Clark’s stardom also had a far-reaching impact on the league as a whole, adding tremendous value to the WNBA. Trade area analysis reveals that several WNBA arenas saw an uptick in visitor affluence when hosting the Fever with Clark in the lineup – likely driven in part by the elevated ticket prices associated with her appearances.
When the Minnesota Lynx hosted the Fever on July 14th, 2024, for example, the median HHI of Target Center’s captured market shot up to just over $93K/year, well above the median HHIs for the games immediately before and after that event. (A venue’s captured market refers to the census block groups (CBGs) from which it draws its visitors, weighted to reflect the share of visits from each one – and thus reflects the profile of the venue’s visitor base.) Similarly, the Fever’s away game against the Connecticut Sun on May 14th, 2024 at Mohegan Sun Arena drove a higher audience median HHI ($103.6K/year) than either of the Sun’s next two home games.
Having a superstar on the roster can drive positive outcomes locally and league-wide – but overall team success is the ultimate goal for any franchise. So it may come as no surprise that stadiums and arenas can drive engagement when their home teams perform well on the field or court. And teams that reverse their fortunes often spark even greater excitement, boosting visitor loyalty, visit duration, and other key metrics.
The Baltimore Orioles had one of the worst records in baseball just a few years ago. But since 2022, the team has flipped the script – stringing together winning seasons and postseason berths. And location intelligence shows that as the team finds success, fans are becoming more engaged with their hometown stadium.
During the 2019 regular season, one of the worst for the club in recent history, stadium attendance suffered, with only 8.3% of visitors to Oriole Park at Camden Yards visiting the stadium at least three times. But during the 2024 regular season, Oriole Park’s share of repeat visitors (those who visited at least three times) was almost double 2019 levels (16.3%) – consistent with a sharp increase in sales of multi-game ticket packages.
In addition to attending games more often, visitors to Oriole Park also appear to be spending more time at the ballpark. During the 2019 regular season, visitors spent an average of 150 minutes at the stadium, but in 2024, the average time at the park increased to 178 minutes – potentially boosting ancillary spending and in-stadium advertising exposure. The increased dwell time of visitors is particularly noteworthy when considering that MLB’s rule changes have significantly shortened average game time.
The more engaged fandom engendered by team success not only impacts stadium visitor behavior, but also has the potential to drive revenue. The Orioles added 20 new corporate sponsors before the 2024 season, likely due to the attention garnered by the well-performing club.
The NFL’s Detroit Lions provide another example of team success that has driven visitor engagement. As the franchise has improved its record in recent years, the trade area size of its stadium – Ford Field – has also increased, indicating elevated attendance from fans living further away.
The Lions finished the regular season with losing records from 2019 to 2021, but finished over .500 in 2022 (9-8), 2023 (12-5), and 2024 (15-2). And with the team’s increasing wins each consecutive season, the size of its stadium's trade area has also increased steadily – reaching 81.3% above 2019 levels in 2024.
This underscores just how much team success matters to fans, who may be more inclined to travel longer distances if they believe their team is likely to win. Ultimately, broader fan engagement across a wider trade area also increases a team’s growth potential beyond in-stadium attendance – driving merchandise sales, increasing viewership, and benefitting both the team and the league as a whole.
While stadium attendance and visitor behavior is often correlated to the performance of the sports teams that play in the arena, sporting venues can also drive fan engagement in ways that aren’t solely tied to team success or big-name athletes. By adapting their concessions and venue operations to visitor preferences, stadiums and arenas can better serve their audiences and strengthen their community presence.
Consumers have been feeling the pinch of rising food costs for quite some time, but at least one NBA team has responded to make concessions at the game more affordable for fans. In December 2024, the Phoenix Suns announced a $2 value menu for all home games at Footprint Center – delivering steep discounts on hot dogs, water, soda, and snacks.
Location analytics suggest that since the value menu launch, more fans who would have otherwise waited until after leaving the venue to grab a bite are now enjoying food and drinks inside the arena. Analysis of five Suns home games just before the value menu launch – between November 26th and December 15th, 2024 – reveals that between 7.0% and 9.3% of stadium visitors visited a dining establishment after leaving the arena. But following the value menu launch before the December 19th, 2024 home game, post-game dining decreased to under 6.0% through the end of the year.
Suns owner Mat Ishbia’s announcement of the new menu called out the need for affordable food options for families at Suns games. As the season progresses, the new menu may drive a larger share of family households to Suns games, which could provide opportunities for advertisers and other stadium partners.
Consumers in Washington – and especially Seattle – are known for their affinity for plant-based diets and environmentally-friendly lifestyles. And that goes for local football fans as well: Audience segmentation provided by the AGS: Behavior & Attitudes dataset combined with trade area data reveals that during September to December 2024, households within Lumen Field’s potential visitor base were 36% more likely to be “Environmentally Conscious Buyers” and “Environmental Contributors” and 39% more likely to be “Vegans” compared to the nationwide average. By contrast, across all NFL stadiums, potential visiting households were 2%, 1%, and 3% less likely, respectively, to belong to these segments.
And Lumen Field has been actively catering to these consumer preferences. The stadium, which has been experimenting with plant-based culinary options for quite some time, was recently recognized as one of the most vegan-friendly stadiums in the NFL. And in December 2024, Lumen became the second stadium in the league to achieve TRUE precertification for its efforts to become a zero-waste venue.
By remaining aligned with its visitor base – including both football fans and people that visit the stadium for other events – Lumen Field encourages visitors to feel at home at their local stadium. And fans may be more connected to their team knowing the club shares their values and respects their lifestyle.
Stadiums and arenas can leverage a variety of strategies to engage visitors in attendance as well as wider audiences. Signing a star athlete, putting together a winning club, or adapting to local preferences are just some of the ways that sports franchises and athletic venues can find success.

Starbucks. Amazon. Barclays. AT&T. UPS. These are just some of the major corporations that have made waves in recent months with return-to-office (RTO) mandates requiring employees to show up in person more often – some of them five days a week.
But how are crackdowns like these taking shape on the ground? Is the office recovery still underway, or has it run its course? And how are evolving in-office work patterns impacting commuting hubs and dining trends? This white paper dives into the data to assess the state of office recovery in 2024 – and to explore what lies ahead for the sector in 2025.
In 2024, office foot traffic continued its slow upward climb, with visits to the Placer.ai Office Index down just 34.3% compared to 2019. (In other words, visits to the Placer.ai Office Index were 65.7% of their pre-COVID levels). And zooming in on year-over-year (YoY) trends reveals that office visits grew by 10.0% in 2024 compared to 2023 – showing that employee (and manager) pushback notwithstanding, the RTO is still very much taking place.
Indeed, diving into quarterly office visit fluctuations since Q4 2019 shows that office visits have been on a slow, steady upward trajectory since Q2 2020, following – at least since 2022 – a fairly consistent seasonal pattern. In Q1, Q2, and Q3 of each year, office visit levels increased steadily before dipping in holiday-heavy Q4 – only to recover to an even higher start-of-year baseline in the following Q1.
Between Q1 and Q3 2022, for example, the post pandemic office visit gap (compared to a Q4 2019 baseline) narrowed from 63.1% to 47.5%. It then widened temporarily in Q4 before reaching a new low – 41.4% – in Q1 2023. The same pattern repeated itself in both 2023 and 2024. So even though Q4 2024 saw a predictable visit decline, the first quarter of Q1 2025 may well set a new RTO record – especially given the slew of strict RTO mandates set to take effect in Q1 at companies like AT&T and Amazon.
Despite the ongoing recovery, the TGIF work week – which sees remote-capable employees concentrating office visits midweek and working remotely on Fridays – remains more firmly entrenched than ever.
In 2024, just 12.3% of office visits took place on Fridays – less than in 2022 (13.3%) and on par with 2023 (12.4%). Though Fridays were always popular vacation days – after all, why not take a long weekend if you can – this shift represents a significant departure from the pre-COVID norm, which saw Fridays accounting for 17.3% of weekday office visits.
Unsurprisingly, Tuesdays and Wednesdays remained the busiest in-office days of the week, followed by Thursdays. And Mondays saw a slight resurgence in visit share – up to 17.9% from 16.9% in 2023 – suggesting that as the RTO progresses, Manic Mondays are once again on the agenda.
Indeed, a closer look at year-over-five-year (Yo5Y) visit trends throughout the work week shows that on Tuesdays and Wednesdays, 2024 office foot traffic was down just 24.3% and 26.9%, respectively, compared to 2019 levels. The Thursday visit gap registered at 30.3%, while the Monday gap came in at 40.5%.
But on Fridays, offices were less than half as busy as they were in 2019 – with foot traffic down a substantial 53.2% compared to 2019.
Before COVID, long commutes on crowded subways, trains, and buses were a mainstay of the nine-to-five grind. But the rise of remote and hybrid work put a dent in rush hour traffic – leading to a substantial slowdown in the utilization of public transportation. As the office recovery continues to pick up steam, examining foot traffic patterns at major ground transportation commuting hubs, such as Penn Station in New York or Union Station in Washington, D.C., offers additional insight into the state of RTO.
Rush hour, for one thing – especially in the mornings – isn’t quite what it used to be. In 2024, overall visits to ground transportation hubs were down 25.0% compared to 2019. But during morning rush hour – weekdays between 6:00 AM and 9:00 AM – visits were down between 44.6% and 53.0%, with Fridays (53.0%) and Mondays (49.7%) seeing the steepest drops. Even as people return to the office, it seems, many may be coming in later – leaning into their biological clocks and getting more sleep. And with today’s office-goers less likely to be suburban commuters than in the past (see below), hubs like Penn Station aren’t as bustling first thing in the morning as they were pre-pandemic.
Evening rush hour, meanwhile, has been quicker to bounce back, with 2024 visit gaps ranging from 36.4% on Fridays to 30.0% on Tuesdays and Wednesdays. Office-goers likely form a smaller part of the late afternoon and evening rush hour crowd, which may include more travelers heading to a variety of places. And commuters going to work later in the day – including “coffee badgers” – may still be apt to head home between four and seven.
The drop in early-morning public transportation traffic may also be due to a shift in the geographical distribution of would-be commuters. Data from Placer.ai’s RTO dashboard shows that visits originating from areas closer to office locations have recovered faster than visits from farther away – indicating that people living closer to work are more likely to be back at their desks.
And analyzing the captured markets of major ground transportation hubs shows that the share of households from “Principal Urban Centers” (the most densely populated neighborhoods of the largest cities) rose substantially over the past five years. At the same time, the share of households from the “Suburban Periphery” dropped from 39.1% in 2019 to 32.7% in 2024. (A location’s captured market refers to the census block groups (CBGs) from which it draws its visitors, weighted to reflect the share of visits from each one – and thus reflects the profile of the location’s visitor base.)
This shift in the profile of public transportation consumers may explain the relatively slow recovery of morning transportation visits: City dwellers , who seem to be coming into the office more frequently than suburbanites, may not need to get as early a start to make it in on time.
While the RTO debate is often framed around employer and worker interests, what happens in the office doesn’t stay in the office. Office attendance levels leave their mark on everything from local real estate markets to nationwide relocation patterns. And industries from apparel to dining have undergone significant shifts in the face of evolving work routines.
Within the dining space, for example, fast-casual chains have always been workplace favorites. Offering quick, healthy, and inexpensive lunch options, these restaurants appeal to busy office workers seeking to fuel up during a long day at their desks.
Traditionally, the category has drawn a significant share of its traffic from workplaces. And after dropping during COVID, the share of visits to leading fast-casual brands coming from workplaces is once again on the rise.
In 2019, for example, 17.3% of visits to Chipotle came directly from workplaces, a share that fell to just 11.6% in 2022. But each year since, the share has increased – reaching 16.0% in 2024. Similar patterns have emerged at other segment leaders, including Jersey Mike’s Subs, Panda Express, and Five Guys. So as people increasingly go back to the office, they are also returning to their favorite lunch spots.
For many Americans, coffee is an integral part of the working day. So it may come as no surprise that shifting work routines are also reflected in visit patterns at leading coffee chains.
In 2019, 27.5% of visits to Dunkin’ and 20.1% of visits to Starbucks were immediately followed by a workplace visit, as many employees grabbed a cup of Joe on the way to work or popped out of the office for a midday coffee break. In the wake of COVID, this share dropped for both coffee leaders. But since 2022, it has been steadily rebounding – another sign of how the RTO is shaping consumer behavior beyond the office.
Five years after the pandemic upended work routines and supercharged the soft pants revolution, the office recovery story is still being written. Workplace attendance is still on the rise, and restaurants and coffee chains are in the process of reclaiming their roles as office mainstays. Still, office visit data and foot traffic patterns at commuting hubs show that the TGIF work week is holding firm – and that people aren’t coming in as early or from as far away as they used to. As new office mandates take effect in 2025, the office recovery and its ripple effects will remain a story to watch.