


.svg)


With 2024 firmly in the rearview mirror, we look back on the year’s retail foot traffic trends and what they may signal for 2025. Read on for a closer analysis of the retail categories and states that excelled at driving growth.
A Tale of 2024 Month-by-Month
Overall retail visits increased year-over-year for most months of 2024, with many of the sporadic visit gaps likely due to extraneous circumstances as opposed to any real consumer slowdown.
Last year’s largest YoY retail visit gap – in January 2024 – could be attributed to severe winter weather in large parts of the country. And the April, September, and December YoY visit dips are likely partially due to calendar shifts, with April 2024 affected by the Easter calendar shift and September and December disadvantaged by having one less Saturday than in 2023.
Value Was a Virtue
Still, looking at 2024 as a whole revealed that the year did outperform 2023, with overall retail visits up 0.4% – suggesting that consumer behavior remains resilient and that 2025 could mark a further turnaround if cooling inflation meets consumer expectations.
But diving deeper into the data reveals significant variation among the major retail categories. Discount & dollar stores (2.8% YoY growth) and superstores (1.7% YoY growth) came out ahead of the pack, highlighting consumers’ demand for value in the face of high prices and economic uncertainty. Meanwhile – and as might be expected in a period of financial strain – many discretionary retail categories lagged in 2024. The Furniture & Home Furnishings category in particular saw the steepest decline with negative visit trends from January to July 2024, but the category did finish strong with a 3.5% YoY increase in Q4 2024 visits – a promising sign for 2025.
Mapping Success
Last year’s retail foot traffic gains were also unevenly distributed geographically.
While most states saw modest YoY visit growth, Maine (2.2%) and North Dakota (2.0%) topped the list in 2024. Notably, foot traffic in both states showed resilience during even the most challenging periods of the year.
In Maine, a recent increase in inbound domestic migration may have contributed to the state’s foot traffic success. Meanwhile, North Dakota’s large share of superstore and discount & dollar store traffic was likely behind its overall retail visit growth in 2024.
What This Means for 2025
Analyzing 2024 retail trends revealed that consumers navigated uncertainty while showcasing resilience — a promising foundation for the new year. Will this momentum continue in 2025?
Visit Placer.ai to find out.
.avif)
A decade after declaring bankruptcy, Detroit is coming back to life. The city is experiencing a resurgence that is bringing new energy to its streets – and an increase in the population of the wider CBSA.
We took a look at some of the data points highlighting the return of the Motor City to better understand what is driving the city’s growth.
Detroit's Comeback Gains Momentum
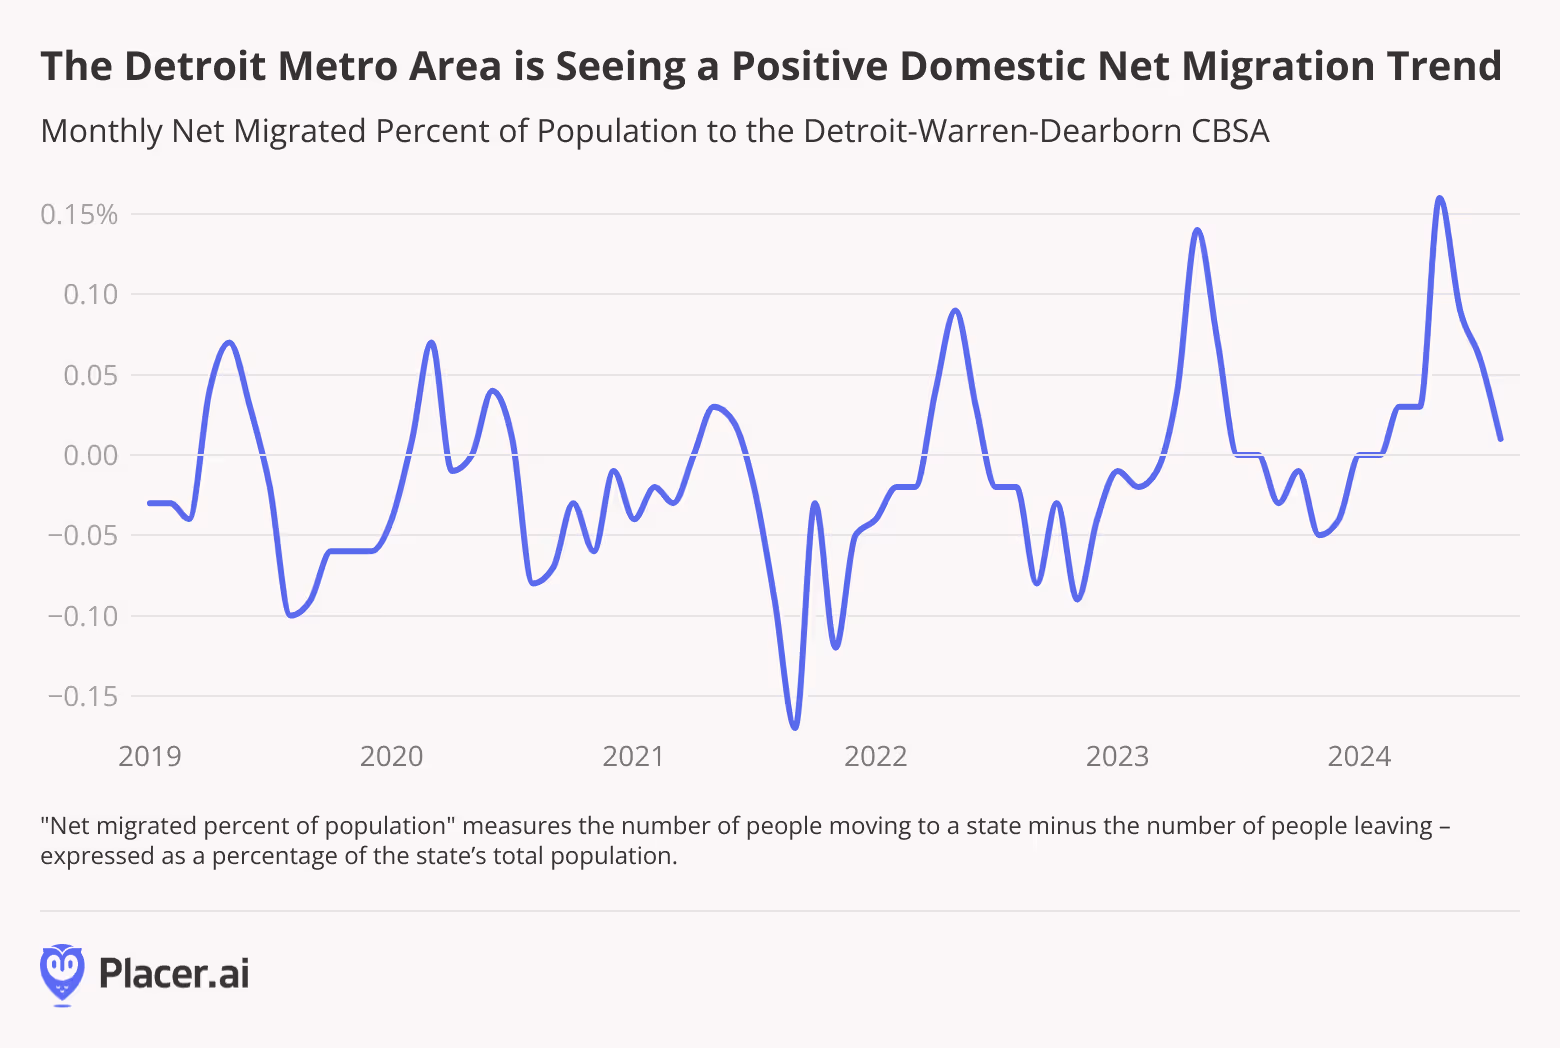
Detroit is making a comeback – undergoing a transformation from a depressed city to a viable and exciting place to live and work. Between July 2022 and July 2023, the city’s population grew for the first time in 66 years, likely thanks to economic revitalization efforts, a thriving tech scene, and a newfound “cool factor” driving inbound migration. And looking at more recent numbers for the wider CBSA indicates that the trend is continuing – net migration to the Detroit-Warren-Dearborne CBSA was either neutral or positive every month between January and August 2024.
This sustained net migration suggests that this growth is not a one-off – Detroit is increasingly becoming a place recognized for the opportunities it offers, economic and otherwise.
New Residents Coming From Nearby
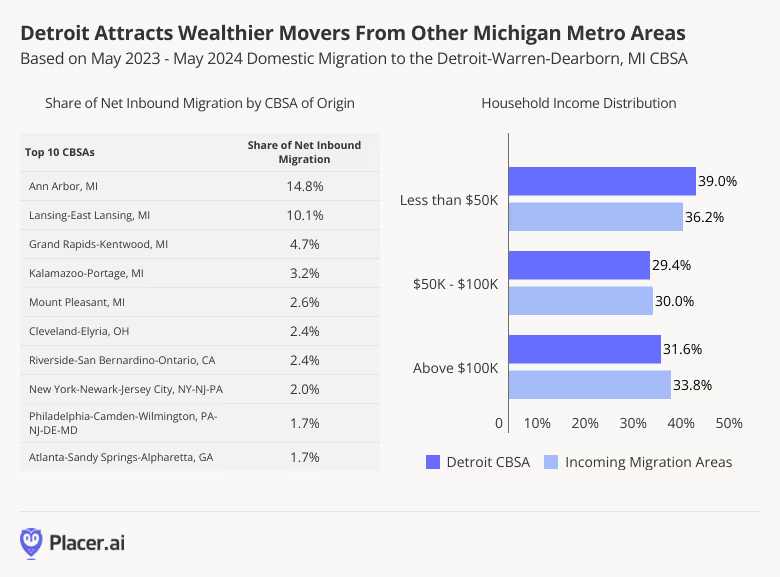
Diving into the CBSAs feeding Detroit’s domestic migration boom reveals that many of the Motor City’s newest residents are coming from other areas in Michigan. Between May 2023 and May 2024, the top five feeder CBSAs for migration to Detroit were located in the Wolverine State, accounting for over a third (35.4%) of new Detroit residents. The influx of Michiganders into Detroit may mean that Detroit’s new residents come with an already strong regional identity and are invested in continuing to revitalize Detroit.
The data also reveals that many of Detroit’s new residents came from areas with higher median household incomes (HHI) than the city’s: Around 33.8% of incoming residents came from areas where the median HHI was $100K and up, compared to just 31.6% of Detroit residents in that HHI bracket. The influx of higher-income residents to the area highlights just how well Detroit has reinvented itself, becoming an increasingly desirable destination for wealthier individuals – a positive feedback loop that could continue driving its economic growth.
The Continuous Comeback City
Detroit has been known by many names over the years – Motown, Detroit Rock City, The Paris of the West – and today, it’s earning a new title: the Comeback City. With a positive economic outlook, steady population growth, and a thriving cultural scene, the future looks bright for Detroit.
Stay up to date with the latest data-driven civic insights at Placer.ai.

Ahead of Toyota’s August 1st earnings call, we dove into the data to explore Q2 2024 visitation patterns at Toyota dealerships nationwide. How did year-over-year (YoY) foot traffic to Toyota showrooms perform in Q2 2024 – and what happened in June 2024, when the CDK Global outage caused paralysis across the industry? Who are the customers driving growth for Toyota – and what lies in store for the brand in the months ahead?
We dove into the data to find out.
Bustling Dealerships
During the second quarter of 2024, Toyota subsidiary TMNA (Toyota Motor North America, Inc.) reported a remarkable 9.2% year-over-year (YoY) increase in U.S. Toyota vehicle sales, buoyed by rising demand for hybrid cars. (The company also owns the luxury Lexus line).
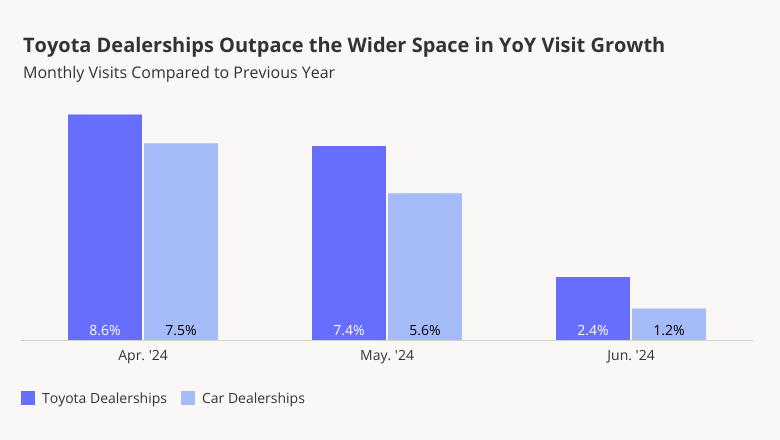
And foot traffic data shows that U.S. Toyota dealerships have indeed been significantly busier in Q2 2024 than in Q2 2023, outperforming the wider space. Apart from the regular portion of repair and maintenance visits, the auto brand’s YoY visit growth also reflects an increase in interested buyers. In April and May 2024, Toyota dealerships saw respective YoY visit boosts of 8.6% and 7.4%. And though the pace of YoY foot traffic growth to dealerships dropped in June 2024 – likely due in part to the CDK outage – the brand appears poised for continued visit success throughout the rest of the year.
Four Wheels for Everyone
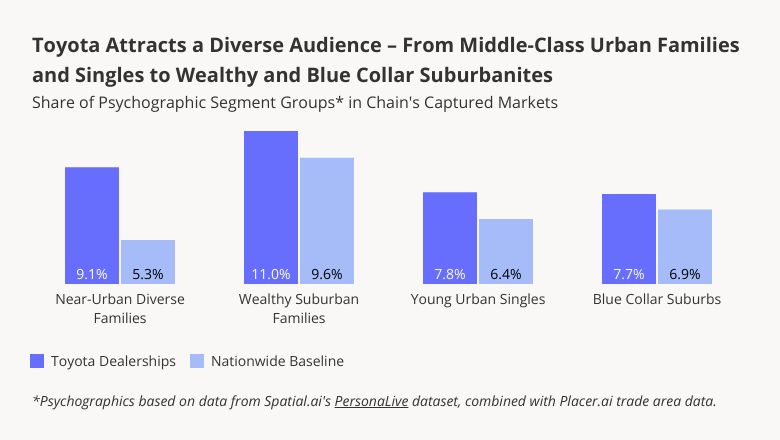
Toyota’s outsize success is likely due, in part, to its broad appeal – amongst everyone from price-conscious families seeking to maximize reliability and fuel efficiency to more affluent consumers that place a high premium on style. Toyota’s Certified Used Vehicles offering also draws in customers looking for trustworthy, pre-owned cars.
Analyzing Toyota dealerships’ captured markets with psychographics from Spatial.ai’s PersonaLive shows that their trade areas are economically diverse. Toyota attracts customers from areas with higher-than-average shares of both middle and working-class families, as well as more affluent ones. And Young Urban Singles are also more likely than average to visit Toyota dealerships.
An Increasingly Affluent Audience
Still, in Q2 2024, Toyota dealerships attracted a slightly more affluent consumer than average. The median household income (HHI) of the dealerships’ captured markets was $77.0K, just above the nationwide baseline of $76.1K. And looking at changes in Toyota’s audience over time also shows that the median HHI of its customer base has increased steadily over the past few years – rebounding to, and even exceeding, pre-pandemic levels. In the face of high interest rates, consumers with less room in their budgets may be cutting back on visits to car dealerships. And Toyota’s hybrid first strategy may also be increasing its appeal among more affluent car owners, who are more likely to purchase hybrid vehicles.

Looking Ahead
Will Toyota continue to thrive in the months ahead? And how will its customer base continue to evolve as inflation stabilizes and interest rates eventually come down?
Follow Placer.ai’s data-driven retail analyses to find out.

