


.svg)


Big Lots – the big-box discount store offering everything from snacks to higher-ticket items like furniture and mattresses – recently announced a major rightsizing initiative. Against the backdrop of declining sales, the company disclosed its intention to shutter up to 315 stores in coming months.
We dove into the data to explore some of the factors that may be impacting Big Lots’ store closure decisions – and to see which chains stand to benefit the most from Big Lots’ big move.
Shoppers Heed the (Closeout) Call
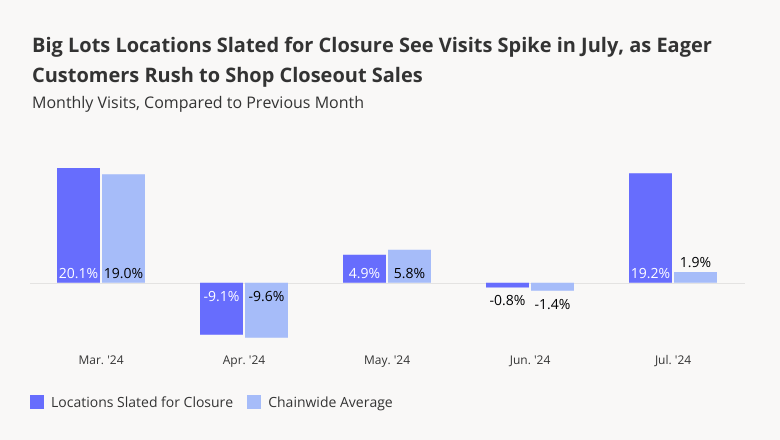
Store closures mean major markdowns – and the some 280 Big Lots locations already slated to close are drawing crowds with big sales. Analyzing monthly visit fluctuations at Big Lots shows that the shuttering locations experienced an impressive 19.2% month-over-month (MoM) visit spike in July 2024, even as the chain as a whole saw just a 1.9% uptick. Customers, it seems, are flocking to the stores on the chopping block to snag high-ticket items at even steeper discounts.
Leaning Into Core Audiences
Rightsizing is all about fleet optimization – trimming underperforming locations and retaining those stores best equipped to meet the needs of a chain’s evolving customer base. And identifying common denominators among stores slated for closure can shed light on the considerations informing a retailer’s rightsizing strategy.
Analyzing the median household incomes (HHIs) of Big Lots’ closing locations' captured markets shows that the retailer is shuttering stores that serve more affluent consumers than the chain as a whole. Nationwide, for example, Big Lots drew visitors from areas with a median HHI of $65.5K in H1 2024. But the Big Lots slated for closure drew shoppers from areas with a median HHI of $73.5K. This pattern repeated itself across major markets where Big Lots is reducing its footprint – including Ohio, Florida, Washington, California, and Arizona.
Big Lots has noted a revitalization strategy focused on value and even more extreme bargain offerings. And the decision to shutter stores in more affluent areas may reflect a move by the retailer to lean into its core audience of price-conscious shoppers – though higher HHI customers can still benefit from the chain’s value offerings.
Who Stands to Benefit?
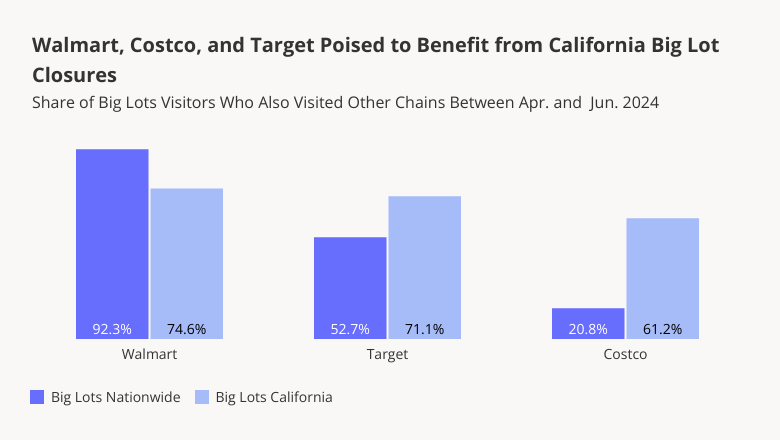
As Big Lots reduces its fleet, shoppers will naturally seek out alternatives. But which chains are best poised to reap the benefits? Cross-shopping data shows, unsurprisingly, that the vast majority of Big Lots visitors also frequent superstores – especially Walmart. In Q2 2024, a whopping 92.3% of Big Lots visitors nationwide stopped by a Walmart – compared to 52.7% for Target and just 20.8% for Costco.
But shopping behaviors vary significantly between regions. And zooming in on California, where Big Lots plans to close a majority of its 109 locations, paints a different picture. Golden State Big Lots shoppers, to be sure, also visit Walmart in high numbers (74.6% in Q2 2024). But they are much more likely than nationwide visitors to the chain to frequent Target and Costco. Given Big Lots’ significant fleet reduction in California, these two chains appear well-positioned to acquire some of this new regional business.
Timing is Everything
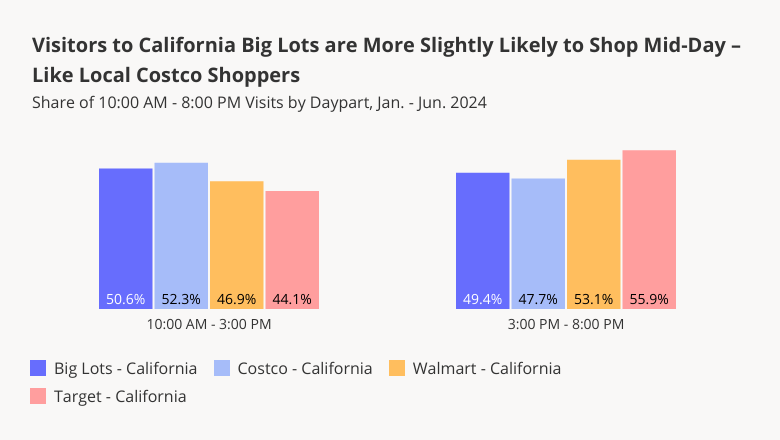
And drilling down even deeper into the habits of California shoppers at Big Lots, Walmart, Target, and Costco shows that of the three retail giants, Costco may be especially well-positioned to benefit from Big Lots’ Golden State closures.
Like Big Lots, Costco draws a high share of visits during the mornings and afternoons – with just over 50.0% of 10:00 AM - 8:00 PM visits taking place between 10:00 AM and 3:00 PM. As Big Lots’ California footprint contracts, some of these mid-day shoppers may hop over to Costco, which is also bustling during these hours.
Rightsizing Opportunities
Rightsizing creates opportunities – both for chains taking proactive steps to optimize their fleets, and for competitors seeking to pick up extra business. How will Big Lots’ big rightsizing move continue to play out in the months ahead?
Follow Placer.ai’s data-driven retail analyses to find out.
This blog includes data from Placer.ai Data Version 2.1, which introduces a new dynamic model that stabilizes daily fluctuations in the panel, improving accuracy and alignment with external ground truth sources.

Dave & Buster's and Main Event, two leading chains in the eatertainment industry, offer a unique mix of dining, arcade games, and immersive experiences, successfully drawing crowds seeking more than just a meal out.
We took a closer look at the two chains – both of them owned by parent company Dave & Busters Entertainment, Inc. – to see how they are faring as summer winds down.
The Great Indoors
Dave & Buster’s and Main Event have plenty of games for children – but with extensive drinks menus, they also decidedly cater to adults, offering both groups a much-needed opportunity to kick back, play some games, and enjoy a meal out with friends.
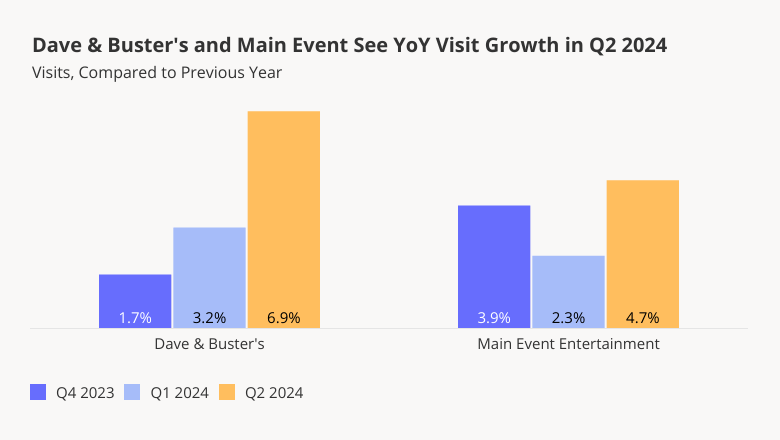
And recent foot traffic data shows that despite challenges, both chains are seeing overall YoY visit increases – partially driven by the chains’ fleet expansions. On a quarterly basis, foot traffic to Dave & Buster’s and Main Event has remained elevated year over year (YoY) since Q3 2023, finishing out Q2 2024 with respective visit boosts of 6.9% and 4.7%.
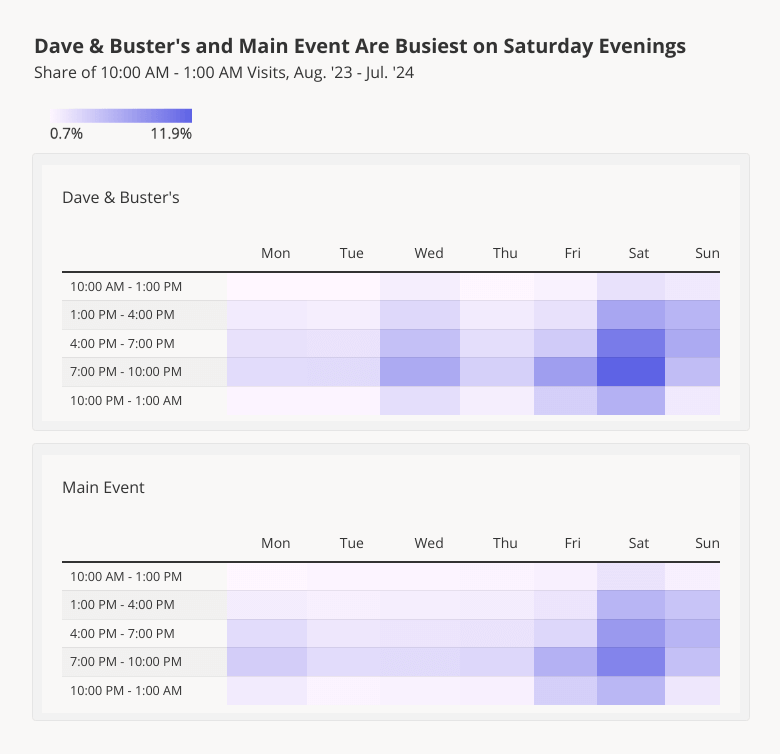
Living For the Weekends
As prime eatertainment destinations, Dave & Buster’s and Main Event are busiest on weekends – with Saturday evening between 7:00 to 10:00 PM drawing the biggest crowds to both chains.
Between August 2023 and July 2024, 11.9% of visits to Dave & Buster’s and 9.4% of visits to Main Event took place during the Saturday evening time slot. Friday and Sunday also experienced increased foot traffic, with hourly fluctuations reflecting the rhythms of weekend activities: Friday visits picked up between 7:00 and 10:00 PM, as people likely wrapped up their work weeks and headed out to unwind with a drink and some skee ball. Sunday visits followed the opposite pattern, with stronger foot traffic earlier in the day that tapered off towards evening, as people put down their pool cues and got ready for the upcoming week.
But Dave & Buster’s and Main Event are both adept at harnessing special promotions to drive visits on off-peak, weekday hours. Dave & Buster’s famous Wednesdays half-off deals fueled significant visit upticks throughout the analyzed period – so it may come as no surprise that the chain recently stepped up its off-peak offerings with a new all-you-can-eat weekday wings deal. And Main Event, which has long offered a Monday Night Madness promotions, also unveiled a “Summer Season Pass” to encourage weekday visits among its customers.
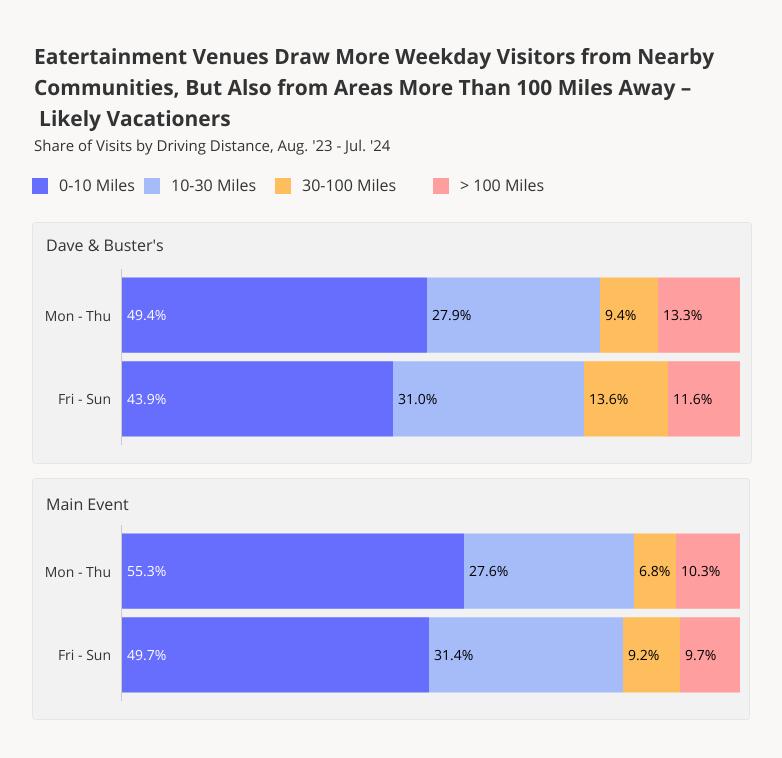
Driving Distance Differs By Day Of Week
Visitor behavior to Dave and Buster’s and Main Event also changes throughout the week. Analyzing the average driving distances of visitors to the two chains shows, unsurprisingly, that people drive further distances to visit the venues on the weekends – when they have more time on their hands.
Between August 2023 and July 2024, 43.9% of weekend visits (Friday to Sunday) to Dave & Buster’s, and 49.7% of weekend visits to Main Event were made by people traveling 10 miles or less to reach the restaurant. On Weekdays (Monday to Thursday), these numbers increased to 49.4% and 55.3%, respectively – indicating that on weekdays, the eatertainment chains are particularly appealing to locals looking for a convenient night out.
But interestingly, it was on weekdays that visitors to the two chains were most likely to come from more than 100 miles away, suggesting that these customers may be on vacation away from home – the perfect time to pop into an arcade mid-week and “unlearn adulthood.”
Get Your Game On
Dave & Buster's and Main Event Entertainment continue to flourish, attracting weekend crowds and drawing visitors from near and far. Can the two eatertainment chains continue to draw crowds as summer draws to a close?
Visit Placer.ai to keep up with the latest data-driven dining and entertainment trends.

With summer winding down (sigh!) and undergrads nationwide heading back to campus, we dove into the data to explore consumer behavior in college towns – where students and other university-affiliated communities make up a substantial share of the overall population.
Once again, we focused our analysis on nine CBSAs dominated by the comings and goings of a university-centered community – including Ithaca, NY (Cornell University); State College, PA (Penn State); Bloomington, IN (Indiana University); Lawrence, KS (University of Kansas); College Station-Bryan, TX (Texas A&M); Columbia, MO (University of Missouri); Champaign-Urbana, IL (University of Illinois); Ann Arbor, MI (University of Michigan); and Gainesville, FL (University of Florida). How does college life impact local retail performance? And what lies ahead for popular back-to-college shopping destinations as the school year begins?
We dove into the data to find out.
Retail Giants Thrive in College Towns
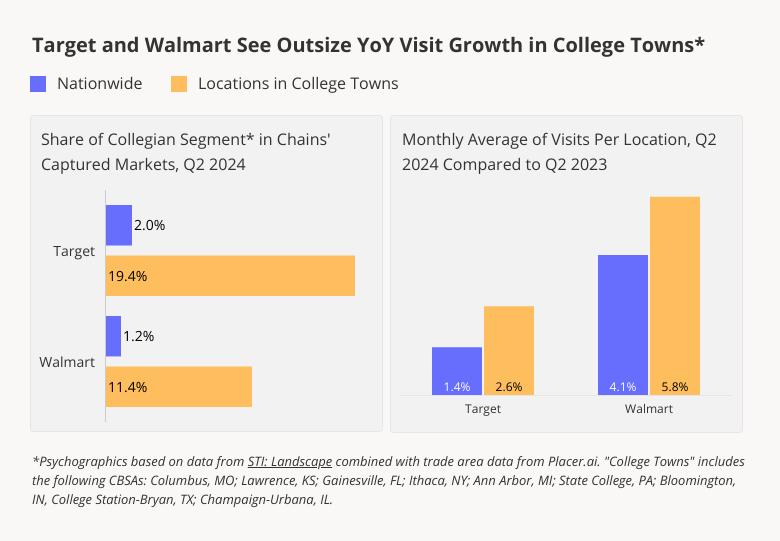
Retail giants Target and Walmart have been thriving in recent months. And nowhere has this been more true than in college towns, where the two behemoths are popular destinations for college students. Nationwide, college students make up just small percentages of the chains’ customer bases. But in college towns, the picture is very different.
In Q2 2024, STI: Landscape’s “Collegian” segment – a group encompassing currently enrolled college students living both on and off campus – made up a remarkable 19.4% of Target’s captured markets in the analyzed CBSAs. Though Walmart’s audiences in these cities included smaller shares of undergrads, the coveted demographic comprised an impressive 11.4% of its local captured markets.
And superstore locations in the analyzed college towns experienced higher-than-average YoY visit growth in Q2 – showcasing the power of this demographic to drive retail success. Target, for example, saw a 2.6% YoY increase in average monthly visits per location in college towns – compared to 1.4% nationwide. And Walmart followed a similar pattern, with average monthly visits per location up 5.8% in college towns, compared to 4.1% nationwide.
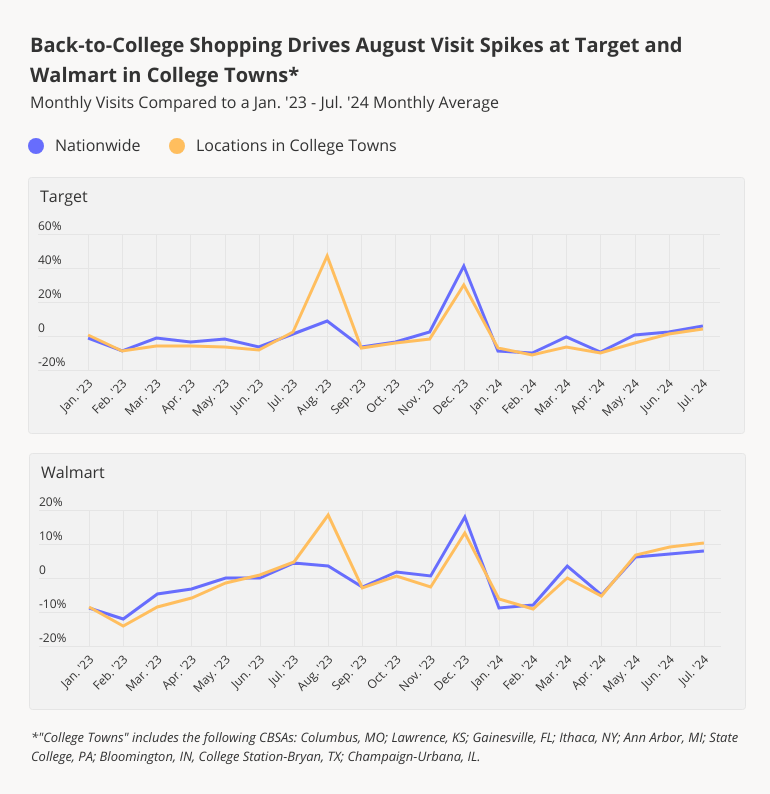
Back-to-College August Rush
With a strong Q2 2024 under their belts, Target and Walmart both appear poised to enjoy an even stronger back-to-college shopping season. And a look at seasonal fluctuations in visits to the two retailers shows just how important the summer shopping scramble is for retailers in these CBSAs.
Nationwide, Target experiences its biggest monthly visit spike in December, when consumers throughout the country fill up their carts with holiday fare and gifts for loved ones. But in college towns, Target’s August visit spike is even bigger than its December one – as students load up on everything from dorm furniture to school supplies. Walmart, too, experiences a college-town August visit bump outpacing the one seen in the run-up to Christmas.
Filling Up on Goodies
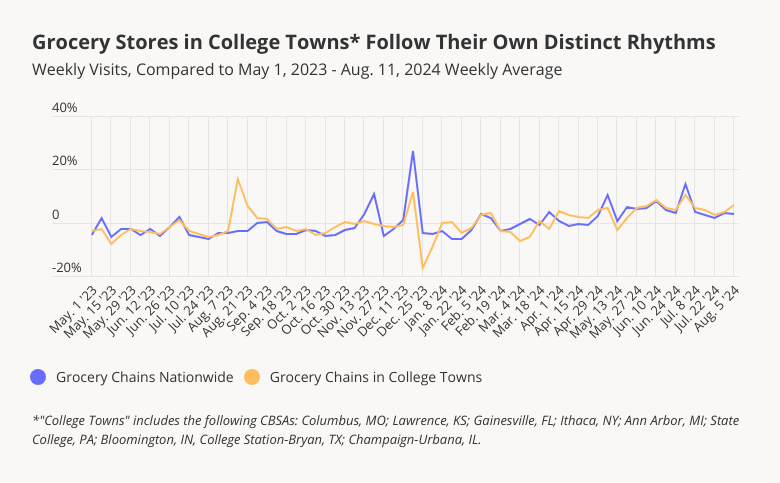
College students may eat many of their meals on campus – but they also frequent grocery stores, whether to pick up snacks or to buy ingredients for off-campus, home-cooked meals. And like superstores, grocery chains in college towns follow unique seasonal rhythms of their own.
Nationwide, grocery stores tend to see weekly visits peak in November and December. But in college towns, these holiday retail milestones carry less weight, as many collegians head home for Thanksgiving and Christmas. Instead, weekly grocery store foot traffic in these CBSAs reaches its high point in August, when collegians likely converge on stores all at once as they head back to campus.
Evening Snacks at Aldi
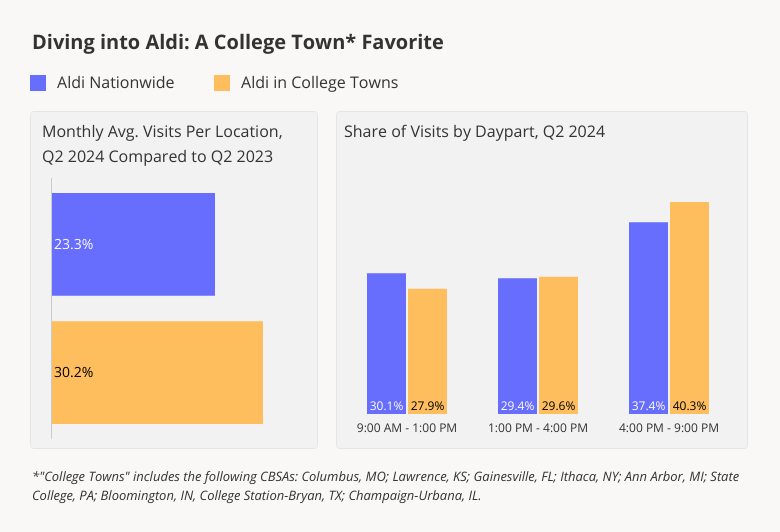
And taking a closer look at value grocer Aldi – which features locations in all nine analyzed CBSAs – highlights other differences in the shopping habits of college town residents. Aldi has been crushing it in recent months, ranking high on the Placer 100 Retail & Dining Index visit growth lists throughout the summer. Like Target and Walmart, the discount supermarket enjoyed even greater visit-per-location growth in college towns than in other areas of the country.
And comparing Aldi visitation patterns in the analyzed CBSAs to those nationwide shows that in college towns, shoppers tend to do their grocery shopping later in the day. In Q2 2024, some 40.3% of visits to Aldi in college towns took place between 4:00 PM and 8:00 PM – compared to just 37.4% nationwide. And on the flip side, just 27.9% of college town Aldi visits took place in the morning, compared to 30.1% nationwide. Whether because they’re busy attending classes, or because they prefer to (ahem) sleep in, college students appear less likely than others to visit grocery stores in the morning.
Looking Ahead
Americans spend billions of dollars each year on back-to-college shopping – and this year is shaping up to be no different. For superstores and grocery chains in college towns, recent strong performance offers plenty of reason for optimism as the August shopping bonanza continues.
For more data-driven retail analyses, follow Placer.ai.

Department stores across the country have been evolving to meet changing consumer wants and needs, and Macy’s & Bloomingdale’s are no exception. Owned by the same company – Macy’s, Inc – these two brands have been recalibrating their store fleets and experimenting with new formats.
We took a closer look at visitation trends to both brands to understand how they diverge, analyze their respective strengths, and explore what might be ahead for both.
Monthly and Weekly Foot Traffic: Stabilization and Growth
In recent years, Macy’s, Inc. has focused on optimizing its store fleet, a long-running project that gained momentum with the 2023 appointment of former Bloomingdale’s executive Tony Spring as CEO. This change coincided with a turnaround strategy involving the closing of some 30% of the brand’s traditional department stores; the expansion of Macy’s small-format model; and the addition of more Bloomingdale’s locations.
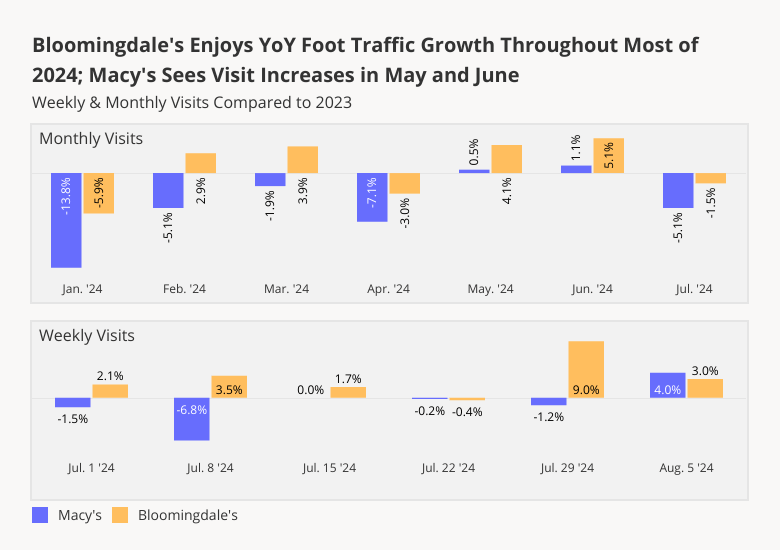
And a look at foot traffic trends at Bloomingdale’s shows that the high-end brand is indeed experiencing an uptick in demand, making it ripe for expansion. For much of the period between January and July 2024, Bloomingdale’s saw YoY monthly visit increases, with only January, April, and July seeing YoY declines. January’s drop was likely due to the inclement weather that weighed on retailers nationwide, while the April 2024 YoY downturn may have been due in part to the comparison to an April 2023 that had five weekends. And though July 2024 as a whole saw visits down 1.5% YoY, a look at weekly foot traffic to Bloomingdale’s shows that throughout most of that month and into August, the chain continued to draw more visits than in 2023.
Macy’s, for its part, had a slower start to 2024 – with YoY monthly visits down through April 2024. But in May and June, Macy’s visit gap closed, with foot traffic just above 2023 levels. And though Macy’s also saw monthly YoY visits decline in July, the chain’s weekly foot traffic has remained at or above 2023 levels since the middle of the month – likely spurred by back-to-school shopping and sales.
With the upcoming holiday season expected to bring a surge in foot traffic, both Macy’s and Bloomingdale’s are well-positioned to capitalize on these opportunities and potentially drive further growth.
A Wide Range Of Incomes
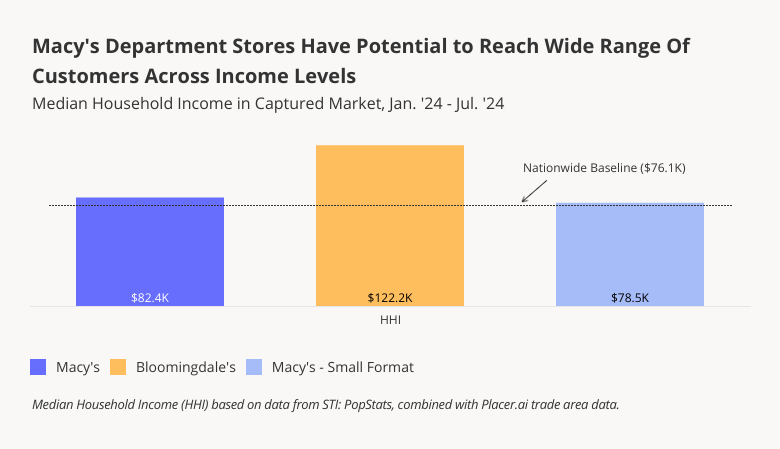
Analyzing the median household incomes (HHI) of Macy’s and Bloomingdale’s captured markets shows how Macy’s, Inc.’s revitalization strategy is helping the company further diversify the range of options available for shoppers of all kinds underneath its umbrella.
Between January and July 2024, for example, luxury-focused Bloomingdale’s attracted visitors from areas with the highest median HHI of the three brands – $122.2K, well above the nationwide average of $76.1K. Bloomingdale’s affluent audience may be less prone to inflation-driven cutbacks than the average American, contributing to the chain’s stronger positioning this year.
By contrast, Macy’s shoppers came from areas with a median HHI of $82.4K, while visitors to Macy’s small-format stores (some 13 locations nationwide) came from areas with a median HHI of $78.5K – just above the nationwide baseline. By expanding its small-format footprint, Macy’s may succeed at increasing its draw among more average-income shoppers.
This income variation underscores the broad retail potential of each chain, ensuring that consumers can find options that cater to their specific needs across Macy’s diverse offerings.
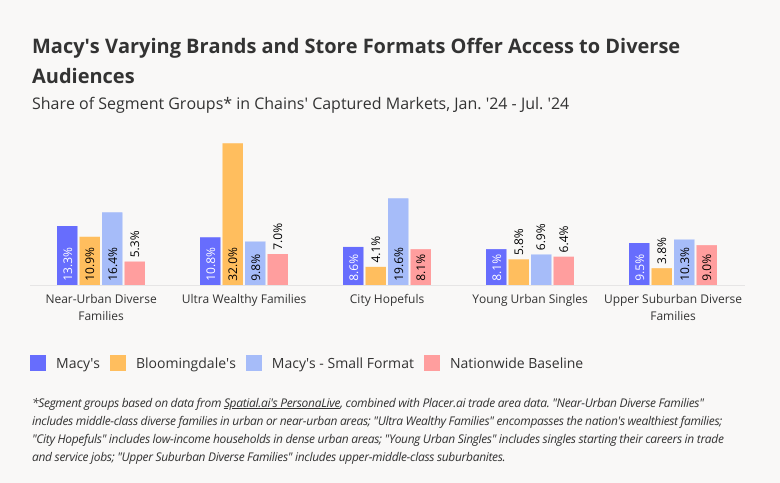
Blooming & Growing: The Bloomingdale’s Shopper
Analyzing the psychographic characteristics of Macy’s and Bloomingdale’s captured markets can shed additional light on how the chain’s turnaround strategy may help it reach new audiences. Macy’s traditional department stores already draw a diverse mix of consumers. But the addition of new Bloomingdale’s locations will help the company make further inroads into affluent segment groups like “Ultra Wealthy Families” – which makes up a whopping 32.0% of Bloomingdale’s captured market. At the same time, Macy’s smaller-format stores will offer the company greater access to the more modest-income “City Hopefuls” and “Near-Urban Diverse Families”, as well as the upper-middle-class “Upper Suburban Diverse Families”.
A Strategic Path Forward
Macy’s and Bloomingdale’s continue to adapt to shifting consumer preferences by focusing on their strengths in specific markets and among their demographic segments, and by expanding its small-format stores. With the holiday season approaching, can both chains continue to drive visits?
Visit Placer.ai to keep on top of the latest data-driven retail news.

With Q3 2024 underway, we checked in with beauty chains Ulta Beauty and Sally Beauty Supply, owned by Sally Beauty Holdings, Inc. How did they fare in the first half of the year? And what are some of the factors driving their success?
We dove into the data to find out.
Ulta Continues to Outperform
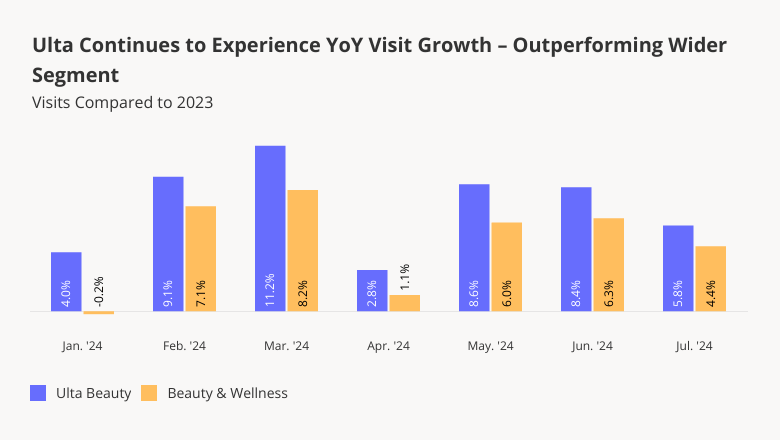
Ulta Beauty thrived in 2022 and 2023, propelled by the lipstick effect – which sees consumers splurging on low-cost indulgences when times are tight – and by the post-pandemic consumer obsession with wellness. And though the beauty giant’s visit growth has moderated somewhat in recent months, it continues to see year-over-year (YoY) foot traffic growth.
Between January and July 2024, Ulta consistently outperformed the wider beauty segment, with monthly YoY visit increases ranging between 2.8% and 11.2%. On a quarterly basis, visits to the chain jumped 6.6% YoY in Q2 2024. Though some of Ulta’s visit growth can be attributed to the chain’s growing store count, the average number of visits to each Ulta location also increased 4.6% YoY in Q2 2024.
Sally Beauty Supply Rebounds
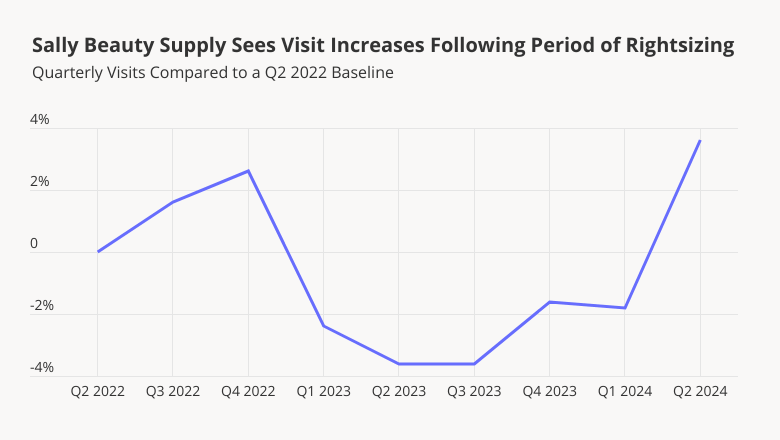
Sally Beauty Supply – the hair care-oriented beauty chain with more than 3,100 stores nationwide – is another beauty brand to watch this year. In 2022, Sally Beauty announced a store optimization plan that included the shuttering of more than 300 stores. And foot traffic data shows that the chain’s rightsizing efforts are paying off.
Comparing quarterly visits to Sally Beauty to a Q2 2022 baseline shows that after declining throughout 2023, overall visits to the chain have begun to pick up once again – with Q2 2024 foot traffic up 3.6%.
Broad and Varying Appeal
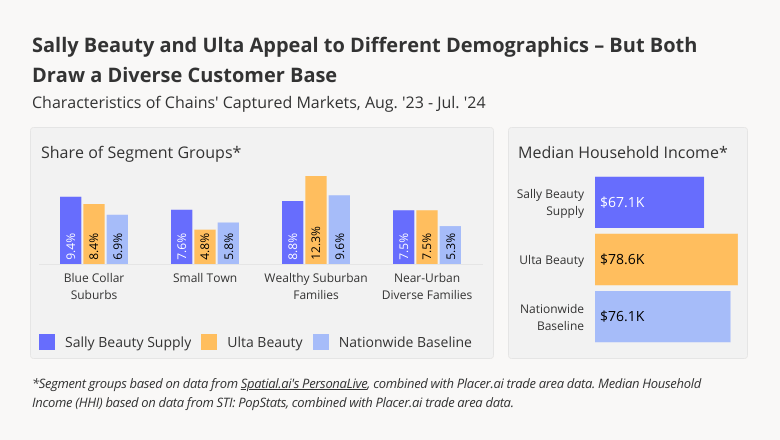
One factor that appears to be driving success for both Ulta and Sally Beauty is their unusually broad appeal. Analyzing the two chains’ captured markets with data from Spatial.ai’s PersonaLive and STI: PopStats shows that though there are differences between Ulta and Sally Beauty’s captured markets, both brands draw large shares of customers from across demographic groups.
Overall, the median household income of Ulta’s captured market is higher than that of Sally Beauty – $78.6K, compared to $67.1K. Ulta’s distinct mix of prestige and budget products is especially likely to draw Wealthy Suburban Families, while Sally Beauty’s offerings hold special appeal for Small Towns.
But both brands’ captured markets include higher-than-average shares of the Blue Collar Suburbs and Near-Urban Diverse Families segment groups – showing that despite their differences, Ulta and Sally Beauty both boast diverse customer bases.
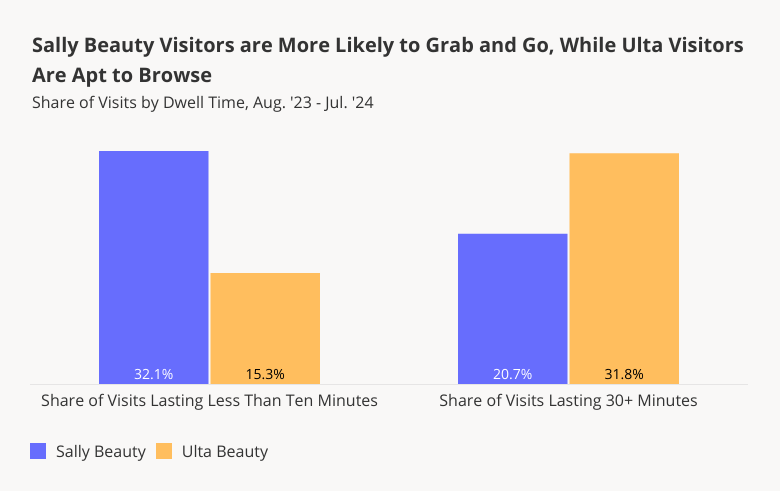
Different Offerings – and Dwell Times
Still, visitors interact with the two beauty chains differently. During the 12-month period ending in July 2024, some 32.1% of visits to Sally Beauty lasted less than 10 minutes – compared to just 15.3% of visits to Ulta.
Sally Beauty’s far greater share of visits under ten minutes may be partly a result of its hair-focused product mix. In Q2 2024, some 64.8% of Sally Beauty’s net sales were in the hair color and care segments, while just 8.1% were in skincare and cosmetics. Ulta’s offerings, by contrast, are very much centered on cosmetics. And while shoppers buying hair care products may be more likely to take advantage of options like BOPIS (buy online, pick up in-store), those on the hunt for makeup may be more intent on trying out products and browsing in-store. Beauty professionals, who make up a larger share of Sally Beauty’s customer base than that of Ulta’s, may also be more inclined to use this service.
On the flip side, Ulta drew a much higher share of extended visits (30+ minutes) during the analyzed period – 31.8%, compared to 20.7% for Sally Beauty. In addition to browsing the aisles and trying new products, many Ulta customers likely remain longer in-store to avail themselves of the chain’s varied in-store salon services.
Looking Ahead
Ulta and Sally Beauty have different offerings – and serve different customer bases. But the success and broad appeal of both brands shows that in the beauty space of 2024, there’s plenty of room at the top.
For more data-driven insights, visit Placer.ai.

Employers from local governments to major corporations are tightening their return-to-office (RTO) policies – cracking down on practices like coffee-badging and requiring employees to relocate closer to the workplace. Last month, the Placer.ai Nationwide Office Building Index showed that offices throughout much of the U.S. were the busiest they’d been since the pandemic. But what happened in July 2024?
We dove into the data to find out.
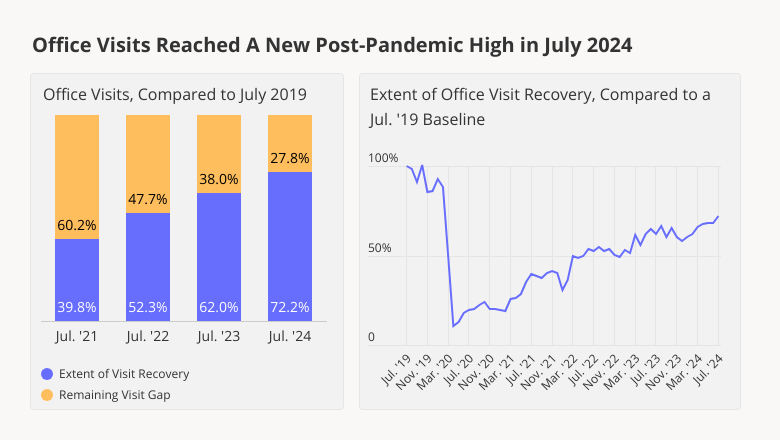
July Sets (Another) New Record
In July 2024, visits to office buildings nationwide were down just 27.8% compared to July 2019 – outpacing even June 2024’s impressive showing. Stated differently, July 2024 office building foot traffic reached 72.2% of July 2019 levels – and the highest it’s been since the pandemic. So even if some RTO mandates are intended to encourage “voluntary turnover” – i.e. make some workers quit – stricter face time policies are also having an appreciable impact on the ground.
Miami and New York Nearly Recovered
Drilling down into the data for major cities nationwide shows that, once again, Miami and New York led the regional recovery pack in July – with visits to offices in both cities reaching about 90% of July 2019 levels. For both cities, as well as Atlanta, Boston, Chicago, Denver, Los Angeles, and San Francisco, July 2024 was the single busiest in-office month since 2020. And though Dallas and Washington, D.C. experienced busier months earlier in the year, both hubs outperformed the nationwide baseline in July – with local offices recouping 76.9% and 73.9%, respectively, of July 2019 office foot traffic.
Houston office visits, for their part, continued to be weighed down by stormy weather – with flooding and power outages in the wake of hurricane Beryl keeping many local residents hunkered down at home.

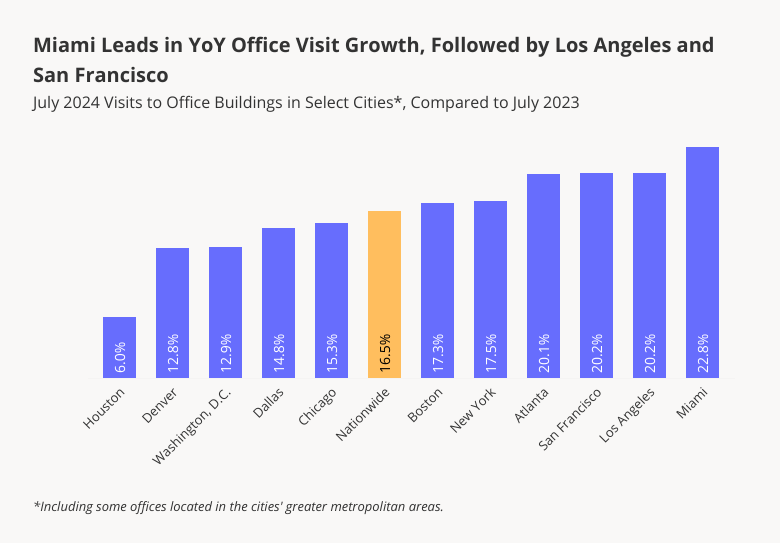
All Analyzed Cities See YoY Visit Growth
Despite these differences, all 11 analyzed cities experienced year-over-year (YoY) visit growth in July 2024 – further evidence that the office recovery remains very much underway. Miami led with 22.8% YoY visit growth, followed by West Coast hubs San Francisco and Los Angeles. And though hurricane-hit Houston unsurprisingly lagged behind other cities, it too saw YoY growth.
Looking Ahead
“Hushed hybrid” trends notwithstanding, offices were busier in July 2024 than during any other month since the pandemic. How much longer will the RTO continue to accelerate?
Follow Placer.ai’s data-driven office recovery analyses to find out.

