


.svg)


Last year’s retail vibe was nothing if not experiential. Inflation led consumers to trade down and cut back on discretionary spending – but people still sought out fun, affordable venues to meet up with friends and let off some steam.
So with 2023 firmly in the rearview mirror, we dove into the data to check in with Dave & Buster’s Entertainment Inc., owner of eatertainment chain Dave & Buster's, and – since 2022 – Main Event Entertainment. How did the company’s two brands fare in the final months of 2023 and at the start of 2024? And what lies in store for them in the months ahead?
No Inside Voices, Please
Dave & Buster’s, the sports bar arcade that invites harried grown-ups to cast aside their worries and “unlearn adulthood”, is thriving. With some 160 venues across 42 states, Dave and Buster’s offers the most tightly-wound consumers an inexpensive escape from real life – someplace they can unwind with friends over a beer, some mouthwatering shareables, and a bit of friendly skee-ball.
Over the past several years, Dave & Buster’s has grown its store count, and in 2022 broadened its portfolio with Main Event Entertainment – the family-oriented eatertainment concept that pairs arcade games with larger format activities such as laser tag and bowling. And since November 2023, both brands have sustained mainly positive year-over-year (YoY) visit growth, disrupted only by January 2024’s inclement weather.
.png)
Reaching Wider Audiences
Main Event Entertainment’s purchase by Dave & Buster’s appears to have been a natural move on the company’s part. Overlaying foot traffic data with demographics from STI’s PopStats reveals that the two chains’ comparable offerings attract customers with similar income profiles: In 2023, Dave & Buster’s’ and Main Event’s captured markets featured median household incomes (HHIs) of $67.3K and $67.6K, respectively – just under the nationwide baseline of $69.5K.
But the acquisition of Main Event has also allowed Dave & Buster’s Entertainment, Inc. to broaden its visitor base. Both of the company’s brands attract plenty of singles and families with children. But while Dave & Buster’s young-adult-oriented vibe holds special appeal for people living on their own, Main Event’s child-friendly activities make it a particularly attractive destination for parental households. Together, the two chains offer something for everyone – cementing the company’s role as an eatertainment leader.
.png)
Gaming the System With Special Promotions
Dave & Buster’s and Main Event also enjoy similar weekly visitation patterns. Unsurprisingly, the two chains are busiest on Saturdays, followed by Sundays and Fridays, and quieter during the rest of the week. But both brands have also found creative ways to boost weekday visits. On Wednesdays, Dave & Buster’s offers a 50%-off deal, letting customers play their favorite games at half the price – and fueling a significant midweek foot traffic spike. Main Event Entertainment, for its part, draws weekday crowds on Mondays with an afternoon all–you-can-play special.
.png)
Friends Definitely Let Friends Let Go (Especially During Spring Break!)
Everybody needs to let their hair down sometimes – and with Spring Break right around the corner, both Dave & Buster’s and Main Event are building momentum with seasonal specials aimed at making their offerings even more affordable.
For both chains, March is an important milestone – in 2023, Dave & Buster’s and Main Event drew 41.0% and 82.9% more traffic during the week of March 13th, respectively, than they did, on average, throughout the rest of year. And if recent visit trends are any indication, the two brands appear poised to enjoy a healthy Spring Break and a strong rest of 2024.
For more data-driven retail and dining insights, follow Placer.ai.
This blog includes data from Placer.ai Data Version 2.0, which implements improvements to our extrapolation capabilities, adds short visit monitoring, and enhances visit detection.

Discount and dollar stores flourished in 2022 and 2023, as rising prices led many shoppers to trade down and tighten their purse strings. Consumers flocked to dollar stores for everything from essential goods to discretionary items like toys and party supplies. And while some chains – including category leader Dollar General – were buoyed by their growing positioning as low-cost grocery venues, others found success by leaning into the affordable luxury space. Brands like Five Below, Ollie’s Bargain Outlet, and pOpshelf (owned by Dollar General) grew their audiences by offering price-conscious consumers easy access to inexpensive non-necessities.
But how did these specialty discount retailers fare in the all-important fourth quarter of 2023 – and what does their early 2024 performance portend for the rest of the new year?
We dove into the data to find out.
Five Below and Ollie’s Bargain Outlet Continue Their Winning Streaks
Five Below, the bargain chain specializing in low-cost, recreational merchandise, wrapped up 2023 with a bang. Between September and December 2023, the brand saw year-over-year (YoY) monthly visit increases ranging from 14.6% to 22.1%. And while Five Below’s expanding store count has likely helped fuel this surge, the indulgence-oriented retailer is also attracting shoppers with a growing selection of “Five Beyond” products, priced above the chain’s traditional $5.00 ceiling. Last year, Five Below further cemented its status as a key holiday shopping destination – another factor driving its impressive Q4 2023 performance. And the discounter continued its winning streak into the new year, with strong performance in January and February 2024.
Ollie’s Bargain Outlet operates according to a somewhat different strategy – enticing shoppers with a broad selection of highly discounted name-brand merchandise. Ollie’s offerings include lower-ticket items like food and books, but also a wide range of premium products like electronics and home furnishings. And Ollie’s closeout buying model means that shoppers never know exactly what they’re going to find – turning each trip into something of a treasure hunt. Like Five Below, Ollie’s Bargain Outlet has expanded its physical presence in recent years – and the chain’s consistent positive YoY foot traffic growth highlights its continued appeal to today’s consumers.
.avif)
Rising Visits Highlight pOpshelf’s Value Proposition
Dollar General’s pOpshelf concept – launched in late 2020 with a discretionary-focused product mix aimed at higher income shoppers than the company’s flagship brand – now boasts some 240 locations across 20 states. And as the chain has expanded its footprint, it has also grown its audience. Like other affordable luxury venues, pOpshelf experiences large visit spikes during the fourth quarter of the year, as shoppers seek out inexpensive gifts and other holiday fare.
As of February 2024, visits to the chain were up 190.1% compared to a March 2022 baseline. Though Dollar General has reined in the pace of pOpshelf’s expansion to account for what remains a challenging retail environment, the company still plans to open more stores this year. And if pOpshelf’s strong visit trajectory is any indication, investing in the concept’s long-term strength may well bear fruit in the months and years ahead.
.png)
Something for Everyone
Each of these discount chains has found success by appealing to a different audience. Ollie’s Bargain Outlet, with its constantly-shifting closeout inventory, attracts shoppers from areas with higher shares of singles and fewer families with children. Five Below’s and pOpshelf, on the other hand, feature captured markets with larger shares of parental households than of singles – though pOpshelf’s share of the latter has risen over the past year, as the chain expanded into new markets.
For all three chains, however, the extent of the gap between the two demographic groups varies throughout the year – with the share of singles increasing during the summer and the share of parental households seeing an uptick during the December holiday shopping season. (For pOpshelf, this pattern began to emerge in 2023). Five Below experienced a particularly pronounced version of this trend – with the share of singles frequenting the chain actually outpacing the share of families with children each August. This uptick in the share of singles visiting discount chains – especially Five Below – may be due in part to back-to-school shopping by college students, many of whom load up on dorm supplies towards the end of summer.
%20(1).png)
Key Takeaways
Specialty discount chains offer price-conscious shoppers affordable outlets for retail therapy. And in 2023 and early 2024, Five Below, Ollie’s Bargain Outlet, and pOpshelf grew their audiences by appealing to the perennial quest for inexpensive, fun shopping experiences. How will these retailers continue to fare as 2024 wears on? Will cooling inflation put a dent in their gains – or will a revitalized discretionary retail environment propel them forward?
Follow Placer.ai’s data-driven retail analyses to find out.
This blog includes data from Placer.ai Data Version 2.0, which implements improvements to our extrapolation capabilities, adds short visit monitoring, and enhances visit detection.

The Placer.ai Nationwide Office Building Index: The office building index analyzes foot traffic data from some 1,000 office buildings across the country. It only includes commercial office buildings, and commercial office buildings with retail offerings on the first floor (like an office building that might include a national coffee chain on the ground floor). It does NOT include mixed-use buildings that are both residential and commercial.
Just when we thought the return-to-office (RTO) debate was finally settled, things are heating up once again. Leading financial institutions like Goldman Sachs are requiring employees to come into the office five days a week (gasp!). And though research shows that remote-capable employees now live twice as far from the office as they did before COVID, some are now being asked to move back closer to the office and show up in person more often.
But what impact are these renewed skirmishes having on the ground? Has the office recovery needle begun to move once again? Or is all the talk merely that – talk?
We dove into the data to find out.
A Strong Leap Into 2024
Nationwide, visits to office buildings were down just 31.3% in February 2024 compared to February 2020 – the nation’s last “normal” in-office month before COVID changed everything. This relatively narrow year-over-four-year (Yo4Y) visit gap may be partially due to this year’s February leap day: Last month had 20 working days, compared to just 19 in February 2020 and 2023. (2020 was also a leap year, but the extra day fell on the weekend.)
Still, office visits in February 2024 were also higher than in January 2024, when unusually cold and stormy weather stranded many Americans at home. And year over year (YoY), February 2024 visits were up 18.6% – which, even accounting for the month’s extra day, points towards significant growth.
.avif)
Regional Round Robin
Taking a look at city-wide trends shows the persistence of significant regional variation – with Miami and New York continuing to lead the post-COVID office recovery pack, and San Francisco bringing up the rear. Dallas, Atlanta, and Washington, D.C. also outperformed the nationwide Yo4Y baseline of -31.3%. And of the cities that continued to lag behind, Chicago, Boston, and San Francisco all outpaced the national average for YoY visit growth.
Here, too, February 2024’s additional business day did some of the work. Nevertheless, urban centers like Miami and New York – where office visits were down just 9.4% and 14.5%, respectively, compared to February 2020 – are clearly experiencing accelerated recovery. In Miami, an influx of tech companies may be contributing to the narrowing foot traffic gap – while in New York, the finance sector is likely a major driver of visit growth. And though San Francisco continues to lag behind other cities, the tech hub’s impressive YoY foot traffic increases indicate real change on the ground.
.avif)
Key Takeaways
Hybrid work may be here to stay – but February’s office foot traffic data appears to indicate that companies and employees are still feeling out the ideal balance between RTO and WFH. And whether due to growing demands by employers or workers’ own concerns about the possible deleterious effects of fully remote work on their careers, further office recovery may yet be on the table.
How will RTO progress as 2024 gets into full swing? Will New York and Miami close the gap? And what will happen in San Francisco?
Follow Placer.ai’s data-driven office recovery analyses to find out.
This blog includes data from Placer.ai Data Version 2.0, which implements improvements to our extrapolation capabilities, adds short visit monitoring, and enhances visit detection.

Discount & Dollar stores thrived in 2022 and 2023, as inflation drove many shoppers to trade down and seek out cheaper retail alternatives. But how has the category continued to fare in the new year? Have stabilizing prices led shoppers away from discount chains? Or have dollar stores cemented their position as go-to retailers even when money isn’t quite as tight?
We dove into the data to find out.
January 2024: Holding Onto Gains
Over the past two years, Discount & Dollar Stores have emerged as major disruptors, diversifying both their offerings and their price points – and the category leaders’ continued visit growth suggests that this strategy is helping the chains build significant strength. By investing in private label food items and stocking fresh produce at thousands of locations, Dollar General has established itself as a prime low-cost grocery destination. Family Dollar, owned by Dollar Tree, has also made strong inroads into the supermarket scene, with everything from fruits and veggies to cage-free eggs. Dollar Tree has also broadened its grocery selection to include an array of chilled and frozen foods.
%20(1).png)
In January 2024, Discount & Dollar Stores saw a further increase in year-over-year (YoY) visits, building upon the category’s impressive post-COVID gains. Most of the analyzed category leaders also saw YoY visit jumps – no small feat given these retailers’ strong 2022 and 2023 performance.
.png)
Sustained Seasonal Growth in the Bargain
Zooming out on the longer-term visitation trajectories of leading discount chains shows just how well positioned the category remains for continued success. Compared to a January 2020 pre-COVID baseline, visits to Dollar General and Dollar Tree were up 24.3% and 14.0%, respectively, in January 2024. While these foot traffic increases were undoubtedly fueled in part by the continued expansion of the chains’ footprints, they highlight strong and growing demand for the category’s bargain fare.
The chains’ visit patterns also reveal clear seasonality in visitation patterns to leading Discount & Dollar Stores, with the chains emerging as holiday shopping destinations. Dollar Tree, which continues to price most items at $1.25, experiences more pronounced seasonal peaks, with visits spiking during the holiday season. And though Dollar General has firmly positioned itself as a year-round destination for essential goods, it too sees foot traffic spikes in December.
.png)
The Secret to Discount Chains’ Success
The emergence of Discount & Dollar chains as affordable venues for much-needed necessities has been a major factor in the segment’s success. But the category’s strong positioning as a key holiday shopping player has also helped solidify its place in the nation’s retail landscape.
And looking at monthly fluctuations in the median household income (HHI) of Discount & Dollar Stores’ captured markets shows a subtle but distinct HHI spike during the peak holiday season – meaning that the category draws its audiences from slightly more affluent areas during this all-important time of the year. This trend may be a further indication of the mainstreaming of dollar stores – with higher-HHI consumers especially likely to seek out their bargain-priced quality merchandise in the runup to Christmas.
.avif)
Key Takeaways
Since COVID, Discount & Dollar Stores have solidified their position as mainstream shopping destinations for everything from basic food items to home goods and party supplies. And if January 2024 is any indication, you can bet your bottom dollar on the category’s continued strength heading into the new year.
Follow Placer.ai for more data-driven retail analyses.
This blog includes data from Placer.ai Data Version 2.0, which implements improvements to our extrapolation capabilities, adds short visit monitoring, and enhances visit detection.

With Q4 2023 under our belts, we dove into the data to check in with leading eyewear brands Warby Parker and America's Best Contacts & Eyeglasses – both of which have expanded their brick-and-mortar footprints in recent years. How did they fare in the final months of 2023? And what does their performance bode for the future of offline eyewear sales this year?
Plenty to See Here
Warby Parker, the digitally-native darling that burst onto the scene in 2010 as an online-only retailer, opened its first physical store in 2013 and now operates some 250 venues across 38 states and the District of Columbia. And the trendy eyewear brand’s visits continue to grow alongside its expanding store fleet, with chain-wide year-over-year (YoY) foot traffic increases ranging from 16.6% to 37.0%. Warby Parker’s continued offline flourishing – despite the chain’s online origins – highlights the continued importance of physical stores for the glasses-buying experience.
National Vision’s America’s Best Contacts & Eyeglasses – the discount eyewear chain that features more than 900 locations nationwide – has also been on a growth trajectory. Over the past several months, the chain saw consistent YoY visit increases, partly driven by its expanding physical presence. And in Q3 2023, the brand also reported a rise in comparable store sales – showcasing healthy demand for its offerings.
.avif)
What is the secret to the success of these very different chains? To explore some of the factors driving traffic to Warby Parker and America’s Best, we segmented the audiences of their trade areas with demographic data from STI’s PopStats and psychographics from Spatial.ai’s PersonaLive – and the results were striking.
Warby Parker Broadens its Lens
Over the past four years, the median household income (HHI) of Warby Parker’s potential market – i.e. the census block groups (CBGs) from which the chain draws its customers, weighted to reflect each one’s population size – has decreased. This indicates that as Warby Parker has expanded its fleet, it has opened stores in areas that are slightly less affluent than Warby Parker’s legacy markets – although the median HHI in these newer markets also stands significantly above the nationwide median of $69.5K.
But over the same period, the median HHI of the brand’s captured market continued to climb. (A chain’s captured market is derived by weighting the CBGs in its trade area according to the share of visitors from each CBG – thus mirroring the characteristics of the chain’s actual visitor base). The increase in captured market median HHI over time indicates that Warby Parker has been successful at reaching well-to-do audiences even within its newer, more economically diverse markets.
.png)
America’s Best Sets its Sights on Price-Conscious Consumers
Unlike Warby Parker, America’s Best Contacts & Eyeglasses serves a lower-HHI demographic. The median household income of the chain’s captured market in Q4 2023 was $66.2K – 4.7% below the nationwide median of $69.5K. And looking at America’s Best’s three largest regional markets – Texas, Florida, and California – shows that the chain’s captured market median HHI in each of these states is also lower than the relevant statewide baseline.
But while the chain’s visitor median HHI trends seem consistent across regions, diving deeper into the data suggests that the chain does attract different types of shoppers in different areas. Nationwide, the share of singles and individuals from large households in America’s Best’s captured market is just slightly above nationwide baselines. But in California, the share of large households in America’s Best’s captured market is 21.0% – significantly higher than the statewide baseline of 16.5%, while the share of singles falls below the Golden State’s baseline of 23.2%.
.png)
Key Takeaways
Digital try-on and easy returns have made online glasses shopping a viable option for many consumers. But the continued offline success of Warby Parker and America’s Best shows that there’s still plenty of demand for brick-and-mortar eyewear stores – discount and higher-end alike. What lies in store for the offline eyewear space in 2024?
Follow Placer.ai to find out.
This blog includes data from Placer.ai Data Version 2.0, which implements improvements to our extrapolation capabilities, adds short visit monitoring, and enhances visit detection.

January is a time for new beginnings – and nearly half of Americans vowed to improve their fitness in the new year. So with 2024 picking up steam, we dove into the data to explore the current state of fitness. How did leading fitness chains perform last month? And what’s in store for the industry as a whole?
‘Tis the Season to be Healthy
The first month of the year is a time for gyms to shine. Analyzing month-over-month changes in the average number of daily gym visits reveals that the biggest visit spike of the year takes place between December and January, when people double down on their motivation to make a change.
This year was no exception. In January 2024, visits to gyms nationwide jumped by 22.1% relative to December 2023 and were up 1.7% year-over-year (YoY) – despite lapping a very strong January 2023 – indicating that the post-COVID obsession with health and wellness is showing staying power.
Drilling down into the data for the nation’s five most-visited fitness chains shows that there’s plenty of room at the top. Value gym Crunch Fitness led the pack with a 21.1% YoY foot traffic increase, partly fueled by the brand’s continued expansion. Next in line was 24 Hour Fitness, where YoY visit gains highlighted the chain’s recovery from its pandemic-induced troubles. Planet Fitness outpaced its own outstanding 2023 performance with a 1.7% YoY foot traffic increase. And LA Fitness and Anytime Fitness also held their own – with visits just 2.0% and 4.4% under January 2023’s already-impressive levels.
.avif)
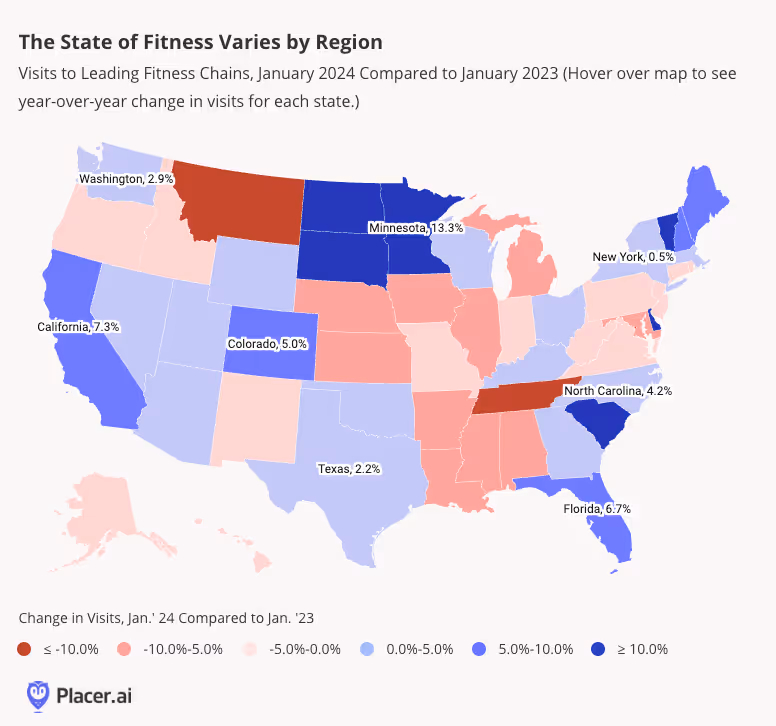
A Regional Story
But the state of fitness isn’t only a national story – it’s also a regional one. Looking at January 2024 YoY fitness visits by state shows significant variations, with some areas seeing strong industry-wide growth, and some seeing YoY visit gaps. Major markets like California, Texas, Florida, and New York all saw visit increases – despite the unusually cold weather in some of these areas, including New York and Texas. Several states, including South Dakota, North Dakota, Minnesota, and South Carolina, even saw visits to fitness centers skyrocket by more than 10.0%. At the same time, parts of the Midwest and South Central regions saw foot traffic dips.
Planet Fitness Dives into Multi-Channel Advertising
Planet Fitness remains America's most-frequented gym, drawing millions of customers each year with low prices and a quality Judgement Free Zone. In January 2024, a whopping 59.3% of total visits to Crunch Fitness, 24 Hour Fitness, LA Fitness, Anytime Fitness, and Planet Fitness – went to Planet Fitness’s vast club fleet. And in 2023, the category leader added 1.7 million new members to its rosters.
Given Planet Fitness’s incredible reach, it may come as no surprise that the chain has jumped on the media advertising bandwagon, announcing last month the launch of its own media network. The network will connect advertising partners with Planet Fitness’s growing audience, leveraging multiple channels – including in-club TV screens and other on-site promotional solutions.
And a look at the demographic characteristics of Planet Fitness’s trade areas across major markets shows just how varied a customer base the fitness leader attracts – with clubs in different areas of the country drawing very different audiences.
In California, for example, the median household income (HHI) of Planet Fitness’s captured market stood at $71.9K in 2023, 16.1% below the statewide baseline of $85.7K. But in New York, the median HHI of the brand’s captured market was $79.9% – 2.7% above the statewide baseline. And though Planet Fitness is squarely positioned as a bargain gym, a significant share of its captured market consisted last year of wealthy households earning more than $150K a year. This metric also varied across regions, as did the household composition of the chain’s customer base – with New York attracting customers from areas with disproportionately high shares of singles, and California drawing visitors from places with outsize shares of large households.
Given the variation in its captured markets, Planet Fitness’s media network offers potential advertisers not just the ability to reach millions of customers – but also the possibility of creating targeted campaigns aimed at different locations’ specific audiences.
.png)
Key Takeaways
Gyms have flourished in recent years, buoyed by consumers’ growing emphasis on health, wellness, and affordable experiences. But will newly-committed gym rats tire as the power of their new year’s resolutions wanes? How will the sector continue to fare as 2024 wears on?
Follow Placer.ai’s data driven analyses to find out.

