


.svg)


Restaurants continue to face headwinds, from still-high food-away-from-home prices to rising labor costs. But despite these challenges, there are promising signs that the industry may be in for an upturn. And increasingly, chains are leaning into breakfast and late night offerings to maximize revenue and foster customer loyalty.
So with Q1 2024 under our belts, we checked in with Wendy’s and Denny’s, two dining leaders with very different offerings in the breakfast space. How did they weather the first quarter of 2024 (pun intended)? And which dayparts experienced the biggest visit boosts in Q1?
Key Takeaways
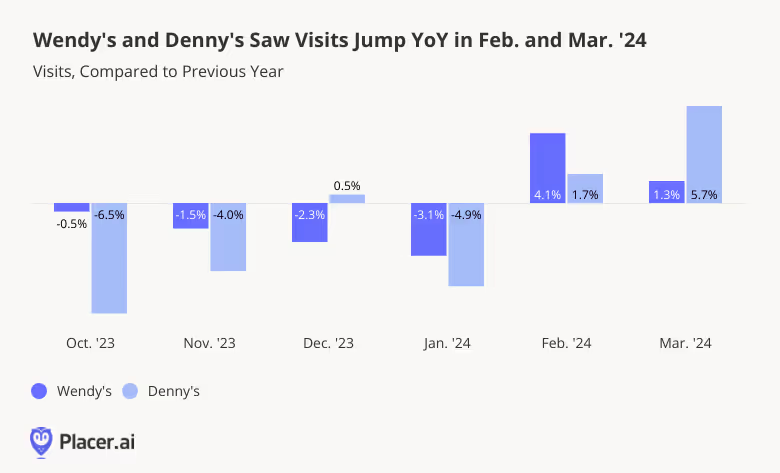
- After dipping in January, year-over-year (YoY) visits to Wendy’s and Denny’s picked up in February and March 2024 – driving a YoY increase in quarterly visits for both chains.
- For Wendy’s, the breakfast daypart experienced the biggest visit increase, followed by the 8:00 PM to 12:00 AM time slot.
- Denny’s, which famously offers breakfast 24 hours a day, saw the biggest YoY visit increases midday and during the late night hours.
A Strong Start to the Year
After a tough Q4 2023 – and a January 2024 dragged down by cold and stormy weather – YoY visits to Wendy’s and Denny’s began to pick up in February and March 2024. And even accounting for January’s Arctic blast, Wendy’s and Denny’s came out ahead on a quarterly basis, with YoY visits up 0.7% and 1.0% respectively.
Wendy’s Ups its Breakfast and Nighttime Game
Wendy’s first launched its breakfast menu in March 2020, just before COVID sent the dining industry into a tailspin. But despite a rocky start, Wendy’s doubled down on the morning daypart, continually tweaking its breakfast offerings and investing ad dollars to boost breakfast sales.
Drilling down into hourly visit data shows that this strategy is paying off. Visits to Wendy’s during the morning daypart (between 6:00 AM and 11:00 AM) jumped 9.3% in Q1 2024 compared to Q1 2023. The chain’s nighttime daypart – which the burger giant began advertising in 2023 for the first time in four years – also saw a YoY boost. Meanwhile, Wendy’s traditional lunch and dinner time slots held steady, with just minor quarterly visit gaps, indicating that the chain’s overall YoY visit growth in Q1 was driven by its breakfast and nighttime push.

Denny’s Anytime Breakfast Drives Lunch Time and Late Night Visits
Denny’s has always been all about breakfast. And with some 75.0% of Denny’s locations open 24/7 (even on Christmas), hungry diners frequent the chain day and night to satisfy their cravings for hash browns, eggs, pancakes, and other breakfast favorites.
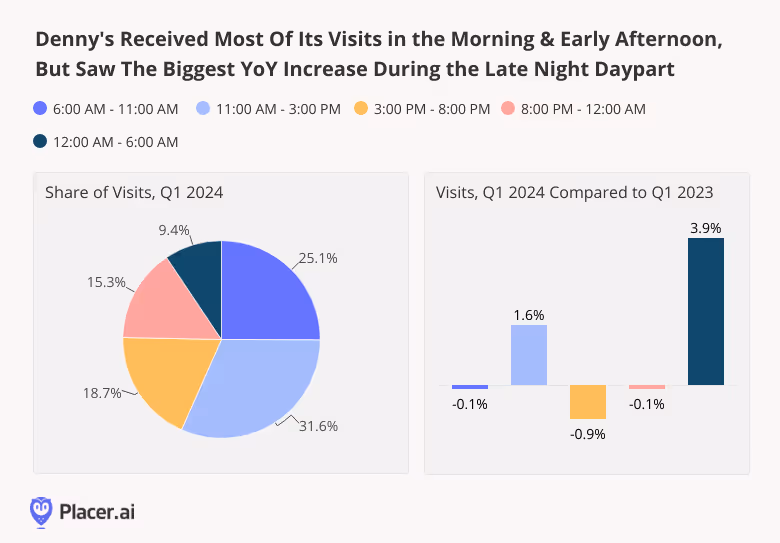
Unsurprisingly, the chain gets most of its visits in the morning and early afternoon. But in Q1 2024, it was the late night daypart that experienced the biggest YoY visit bump – perhaps driven in part by Denny’s push last year to increase the number of locations open in the wee hours.
But Denny’s busiest time slot, between 11:00 AM and 3:00 PM, also experienced a YoY visit increase – showing that even as the chain cements its role as a go-to nighttime destination, it continues to face healthy demand during more traditional dining dayparts.
The Most Important Meal(s) of the Day
Breakfast and late night dining offerings have emerged as important drivers of dining success. How will these dayparts continue to fare as the year wears on? And which other brands will make inroads into the breakfast and nighttime dining game?
Follow Placer.ai’s data-driven dining analyses to find out.

Amid the economic headwinds that plagued the wider dining industry in 2022 and 2023, the QSR and Fast Casual segments offered price-conscious consumers places to treat themselves to affordable indulgences and grab quick meals on the go.
Many of the major chains in this space – including Burger King, Popeyes, Pizza Hut, Taco Bell, and KFC – are brands owned by Restaurant Brands International (RBI) or Yum! Brands. How are these players faring in 2024?
We dove into the data to find out.
Key Takeaways
- RBI’s Popeyes and Tim Hortons experienced positive quarterly visit growth in Q1 2024,
- Quarterly traffic numbers for RBI’s Burger King held steady, even as rightsizing efforts boosted the chain’s average number of visits per venue. Firehouse Subs, for its part, was significantly impacted by January’s inclement weather – but rallied in February and March with YoY visit growth.
- YUM! Brand’s Pizza Hut and Taco Bell also enjoyed positive visit growth in Q1 2024.
- Both RBI and YUM! Brands are finding success with promotions and limited time offerings: Pizza Hut drew huge numbers of fans on Super Bowl Sunday, while Firehouse Subs drove visits with its leap day special.
RBI Chains Enjoy Mostly Positive Visit Growth
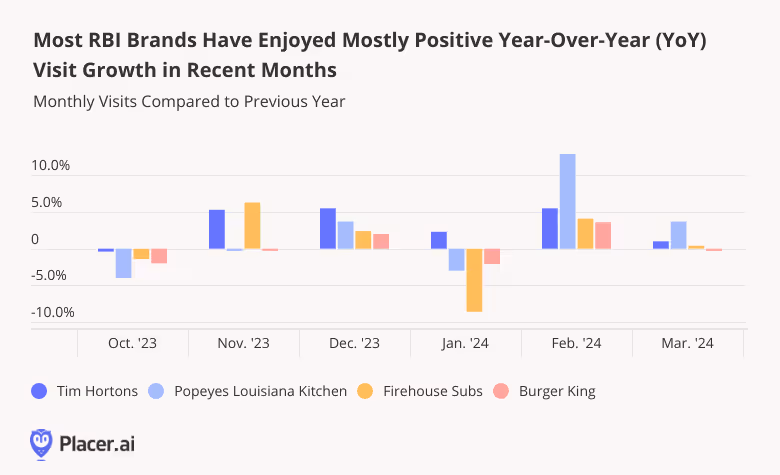
Restaurant Brands International, Inc. owns three leading QSR banners – Burger King, Popeyes Louisiana Kitchen, and Tim Hortons – as well as Fast Casual chain Firehouse Subs. And since December 2023, all four chains have experienced mainly-positive year-over-year monthly (YoY) foot traffic growth – with the stark exception of January 2024, when unusually cold weather caused overall dining visits to dip.
The January Arctic Blast did not impact all RBI brands equally: Coffee favorite Tim Horton managed to maintain positive visit growth throughout the first month of the year, perhaps thanks to the chain’s emphasis on hot drinks. On the other hand, YoY visits to Firehouse Subs dropped 8.8% in January 2024 – so although the traffic picked back up in February and March, the brand still finished out Q1 2024 with a minor YoY quarterly visit gap.
Popeyes, for its part, enjoyed a 4.4% quarterly visit bump in Q1 2024, fueled in part by the chain’s fleet expansion. And though Burger King ended the quarter with just a slight overall quarterly visit increase (0.3%), this is likely a reflection of the chain’s rightsizing efforts: In Q1 2024, the average number of visits to each of the chain’s venues increased by 4.3%.
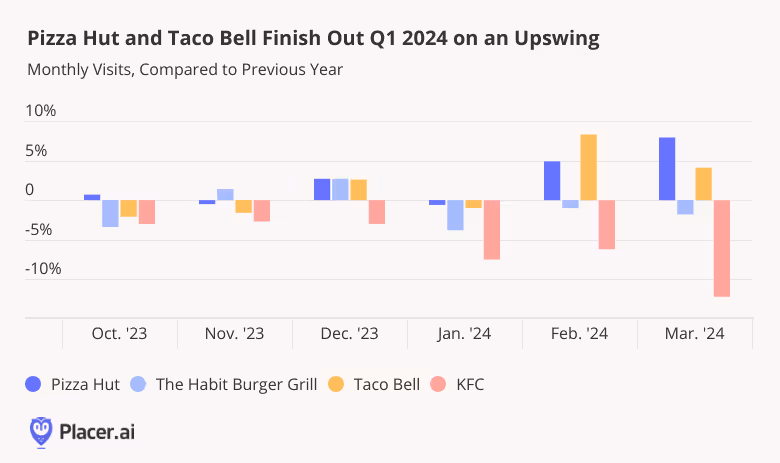
YUM! Brand’s Largest Banners Poised to Thrive
Yum! Brands also owns three major fast food chains – Pizza Hut, Taco Bell, and KFC – in addition to Fast Casual The Habit Burger Grill. And though KFC – which has been focusing on international expansion – maintained a Q1 2024 YoY visit gap, quarterly visits to YUM!’s two biggest QSR banners, Pizza Hut and Taco Bell, were up 4.3% and 3.8%, respectively.
Making the Most of Super Bowl and Leap Day
Neither RBI nor YUM! banners are resting on their laurels. Banners at both companies are finding creative ways to drive business, leaning into limited time offers (LTOs) to help customers mark special occasions.
RBI’s Firehouse Subs celebrated leap day – Thursday, February 29th, 2024 – with a special 2-for-1 LTO for customers whose names start with the letters L, E, A, or P. The day of the promotion was the restaurant’s single busiest Thursday between March 2023 and March 2024: Visits were up 21.5% compared to an average Thursday, and about 6.0% compared to an average Friday or Saturday (Firehouse Sub’s two busiest days of the week).
Super Bowl Sunday came this year just two days after National Pizza Day – and YUM!’s Pizza Hut enticed hungry viewers with crowd-pleasing limited time menu offerings. Although many football fans likely ordered their grub online, February 11th, 2024 was still the chain’s busiest day of the past year – with visits up 47.5% compared to a daily average. In the Las Vegas-Henderson-Paradise, NV CBSA, which hosted Super Bowl LVIII, Pizza Hut’s big-day visit spike was an even more impressive 74.1%.

Final Thoughts
Inflation may have cooled, but food-away-from-home prices remain high – and are likely to continue to increase this year. Against this backdrop, companies like RBI and YUM! that offer hungry consumers affordable ways to fill up and have fun appear poised for success.
Follow Placer.ai for more data-driven dining insights.
This blog includes data from Placer.ai Data Version 2.0, which implements improvements to our extrapolation capabilities, adds short visit monitoring, and enhances visit detection.

The Placer.ai Nationwide Office Building Index: The office building index analyzes foot traffic data from some 1,000 office buildings across the country. It only includes commercial office buildings, and commercial office buildings with retail offerings on the first floor (like an office building that might include a national coffee chain on the ground floor). It does NOT include mixed-use buildings that are both residential and commercial.
Is return-to-office picking up steam?
Last month, location intelligence indicated that the office recovery needle was starting to move once again. Whether due to stricter corporate mandates – especially in the finance sector – or to employees seeking to reap the rewards of in-person collaboration and mentoring, office activity appeared to be on an upswing.
But what’s happened since then? Has the momentum worn off, or is RTO still trending on the ground?
Key Takeaways
- In March 2024, nationwide office visits were just 32.7% below March 2019 levels – and higher than nearly every other month since COVID.
- Miami and New York held onto their regional post-pandemic recovery leads, with impressively small respective visit gaps (compared to March 2019) of 14.1% and 17.2%.
- Though San Francisco still had the biggest visit gap versus Pre-COVID (~50.0%), the city continued to lead other major hubs in year-over-year (YoY) office visit growth – perhaps reflecting the upswing in demand for office space that has observers bullish about local market prospects.
Office Visits Trending Upwards
Hybrid work may be here to stay – but the situation on the ground remains very much in flux. Last month, office visits nationwide were just 32.7% below what they were in March 2019 (pre-pandemic). This represents a significant narrowing of the visit gap in relation to March 2022 and March 2023 – when visits were down 48.2% and 36.3%, respectively.
And comparing monthly visits to a March 2022 baseline shows that visits last month were among the highest they’ve been since COVID. Only August 2023 (which had two more working days than March) and October 2023 featured higher visitation rates.
.avif)
Miami and New York Continue to Lead The Recovery
Drilling down into the data for eleven major cities nationwide shows that Miami and New York are holding firmly onto their regional RTO leads – with less than a 20% visit gap compared to pre-pandemic levels. And RTO appears likely to continue apace in both cities, driven by tech companies in Miami and finance firms in the Big Apple. Indeed, in Miami, visits to office buildings in March 2024 were the highest they’ve been in four years. Washington, D.C., Dallas, Atlanta, and Denver also outperformed the nationwide baseline compared to pre-COVID, while Chicago, Boston, Houston, Los Angeles, and San Francisco lagged behind.
.avif)
A San Francisco Turnaround?
But despite bringing up the rear for overall post-COVID office recovery, San Francisco has been experiencing outsize YoY office visit growth for some time now. And in March 2024, the city continued to lead the regional YoY visit recovery pack – tied for first place with Washington, D.C.
.avif)
Given San Francisco’s stubbornly large post-COVID visit gap, it may come as no surprise that the city’s office vacancy rate is higher than it’s ever been. But demand for office space in San Francisco is back on the rise, leading market observers to conclude that bright times may be ahead for the local market.
San Francisco’s strong YoY office visit performance may be a reflection of this increased demand, providing another sign of good things to come in the Golden Gate city.
A Work (Still) in Progress
Remote work carries plenty of benefits, but a variety of factors – from Gen Z work-from-home fatigue to the better wages and opportunities available to on-site employees – are driving increased office attendance. And if March 2024 data is any indication, further shifts in the RTO/WFH balance may yet be in the cards.
For more data-driven return-to-office updates, follow Placer.ai.
This blog includes data from Placer.ai Data Version 2.0, which implements improvements to our extrapolation capabilities, adds short visit monitoring, and enhances visit detection.
Every year in March and early April, thousands of young people descend on Florida beaches to soak up some sun, kick back with friends, and have a good time. But while the influx of revelers can be a boon to local businesses, some municipalities are pushing back against the mayhem. This year, Miami Beach famously announced its intention to “break up” with spring break (“It’s not us, it’s you”) – instituting a series of restrictive measures, from curfews to elevated parking fees, designed to temper the crowds.
But what’s happening on the ground? How did this year’s spring break impact local businesses in key Florida destinations like Miami, Key West, Panama City Beach, and Daytona Beach? Which retail segments continued to benefit from the excitement – and who were the visitors driving foot traffic to their venues?
Key Takeaways
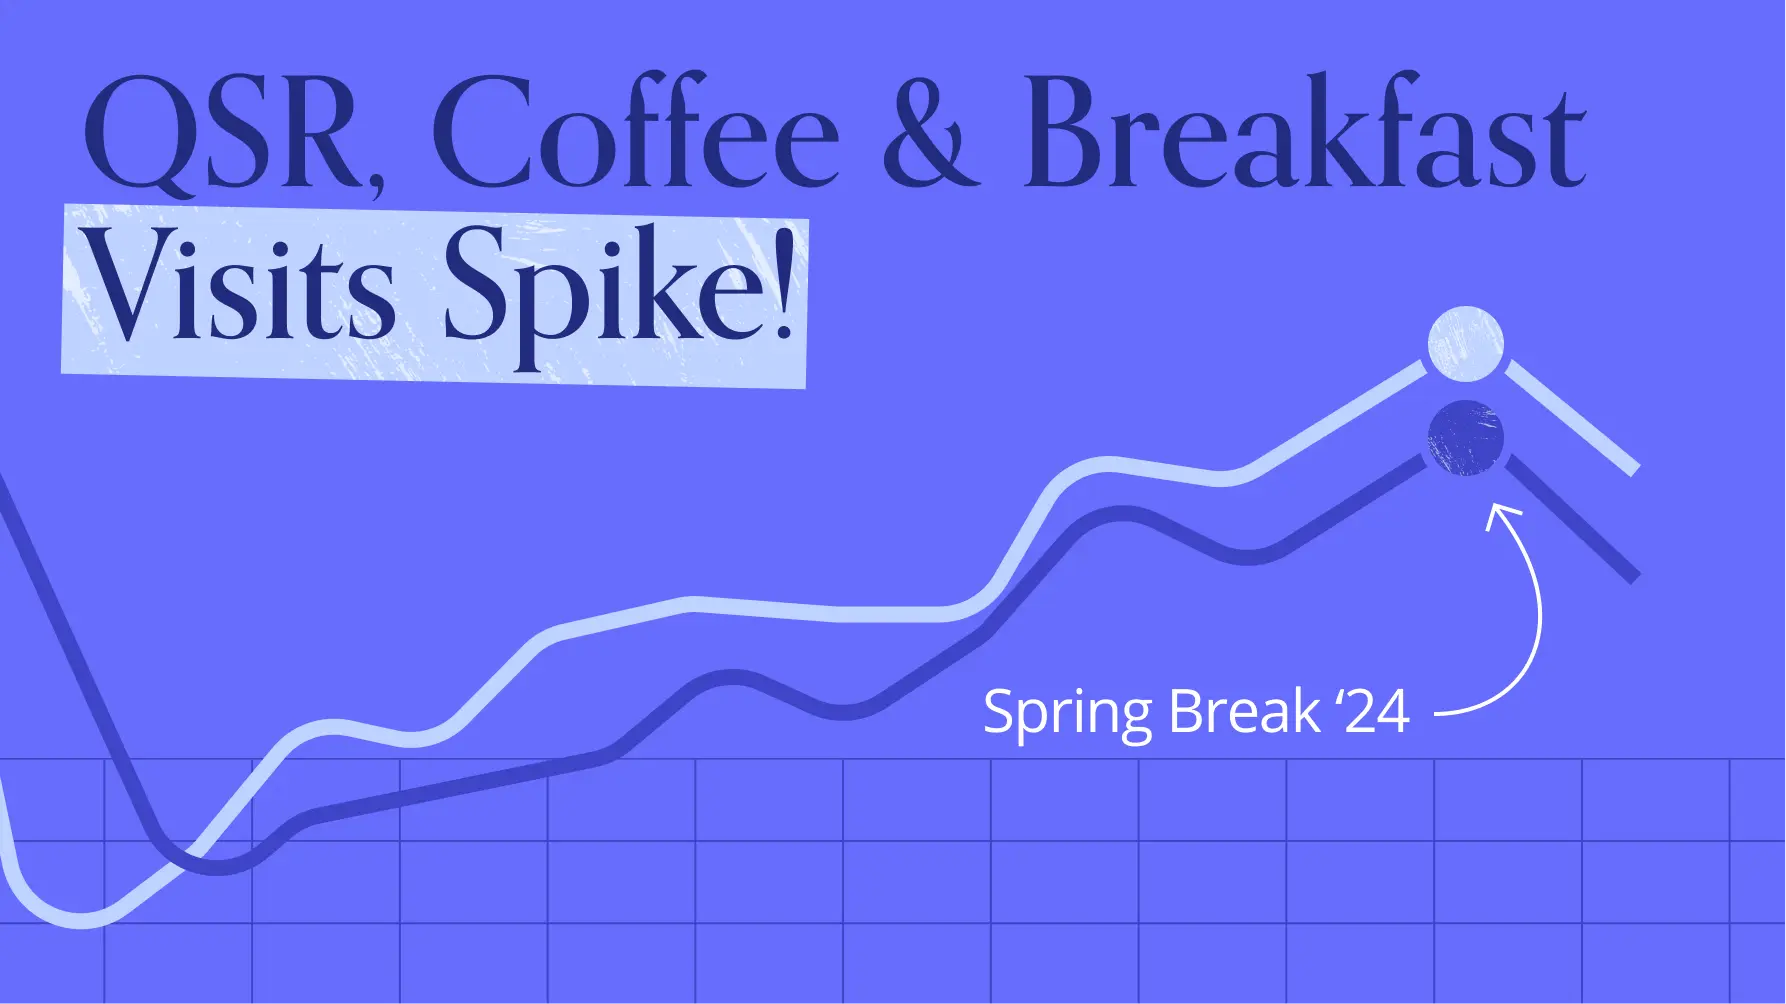
- Despite Miami Beach’s intention to break up with spring break, fast-food restaurants, breakfast venues, and coffee shops all experienced significant March visit spikes in Florida spring break destination towns.
- Panama City saw the biggest March dining visit surges – but eateries in Miami, Key West, and Daytona Beach also experienced significant foot traffic increases.
- In March, local Panama City resorts as well as crowd favorites like Starbucks, Dunkin’, Whataburger, and Chick-fil-A saw a larger-than-usual share of college students.
QSR and Coffee Chains Reap Spring Break Rewards
Florida is home to the most-searched spring break destinations in the United States. And perhaps thanks to the influx of vacationers, location intelligence shows that Quick-Service Restaurants (QSR) and Breakfast, Coffee, Bakeries, & Dessert Shops in Florida spring break hotspots enjoy significant annual visit boosts during March and early April.
The extent of the seasonal boost varies between CBSAs – and though this year’s traffic spikes were slightly lower than last year’s bumps, the two dining segments continued to benefit strongly from spring break-fueled visit bumps in 2024.
Visits to QSR & Fast-Food venues and Breakfast, Coffee, Bakeries, & Dessert Shops in Panama City – known as the spring break capital of the world – were up 57.6% and 56.9%, respectively, during the week of March 11th 2024, compared to an early January 2023 baseline. This represents a minor decline from the comparable period last year (the week of March 13th, 2023), when visits were up a respective 59.2% and 68.6%.
QSR and coffee and breakfast chains in the Miami-Fort Lauderdale-Pompano Beach, Key West, and Deltona-Daytona Beach-Ormond Beach CBSAs also experienced significant visit spikes during the week of March 11th, 2024. Though the March foot traffic increases in these CBSAs were smaller than those seen in Panama City, they were nearly on par with the visit bumps seen in the comparable period of 2023.
.avif)
College Students Drive Visits to Panama City Dining Chains
Who are the visitors driving this spring break dining activity? Drilling down into the data for leading Panama City QSR and coffee chains shows that college student influxes are likely a major contributing factor.
In July 2023 – during Panama City’s peak summer season – the captured markets of local Whataburger, Dunkin’, Starbucks, and Chick-fil-A locations were nearly devoid of STI: Landscape’s “Collegian” segment – a category encompassing currently-enrolled college students. But in March 2024, the share of this segment in the brands’ captured markets skyrocketed.
.png)
Panama City Resorts Go Collegian
Analyzing the audiences of local Panama City resorts reveals a similar pattern. During the month of July, the captured markets of SpringHill Suites and Holiday Inn Resort – two venues popular among spring breakers – included miniscule shares of Collegians. But in March, the share of college students in the resorts’ captured markets jumped to 13.8% and 10.0%, respectively – highlighting the role of undergrads in driving hotel visits during this period.
.png)
Spring Break Fever
Spring break is party time – and Florida has traditionally been at the center of it all.
How will 2024 spring break continue to unfold this year in the Sunshine State? And what other retail categories stand to benefit from the excitement?
Follow Placer.ai’s data-driven civic and retail analyses to find out.
This blog includes data from Placer.ai Data Version 2.0, which implements improvements to our extrapolation capabilities, adds short visit monitoring, and enhances visit detection.

Since COVID, millions of Americans have relocated from major population centers in California, New York, and Illinois (among others) to other regions of the country. Whether in search of job opportunities, affordable housing, or simply a change of scenery, thousands of people have decamped to places like Tampa, Florida, Bozeman, Montana, and Portland, Maine. And the great state of Texas – with its wide open spaces and relatively affordable cost of living – has emerged as a favored destination.
So with 2024 underway, we dove into the data to explore domestic migration trends in the Lone Star State. How much has the population of Texas grown as a result of domestic migration over the past several years – and which metro areas (CBSAs) are attracting new residents? Are people moving to major cities like Dallas, Houston, Austin, and San Antonio, or are they heading out to the suburbs?
Bigger is Better in the Lone Star State
Between December 2019 and December 2023, Texas’ population grew by 4.3% – with nearly a third of this increase driven by new residents hailing from elsewhere in the U.S.
Perhaps unsurprisingly, many of these new arrivals made a bee-line to Texas’ four most populous metropolitan areas – Austin-Round Rock-Georgetown, San Antonio-New Braunfels, Dallas-Fort Worth-Arlington, and Houston-The Woodlands-Sugar Land. During this time period, each of these CBSAs experienced positive net migration (meaning that more people moved to these areas than away from them) ranging from 0.4% to 3.4%.
.avif)
All Hat and No Cattle?
But a deeper analysis of foot traffic trends reveals that, even as the CBSAs as a whole added new residents, the primary cities anchoring the CBSAs often lost more domestic migrants than they gained. Austin proper lost 6.1% of its population to relocation, while Dallas, Houston, and San Antonio lost 4.2%, 3.9%, and 3.2%, respectively. Only Fort Worth – Texas’ fifth-most-populous city – experienced positive net migration over the past four years.
.png)
An Urban / Suburban Divide
Why are major metropolitan areas seeing population influxes, even as their central urban hubs experience outflows? Drilling down even deeper into zip-code level location intelligence provides a striking snapshot of what’s actually happening on the ground.
In all four CBSAs, zip codes belonging to the metro area’s flagship city were more likely to experience negative net migration – while those in further-away suburbs and towns were more likely to see positive inflow.

The relative growth experienced by Fort Worth can be understood against this backdrop: Fort Worth may be one of Texas’ biggest cities, but it is smaller – and less expensive – than Dallas, which dominates the metro area.
Suburban life offers residents many of the benefits of proximity to major urban centers, without some of the drawbacks – like smaller homes. And with more Americans free today to live further away from the office, many appear to be choosing suburban chill over big-city hassle.
Key Takeaways
Home to the Alamo, a premier state fair, and arguably one of the cultiest grocery chains in the country (H-E-B, of course), Texas has become a key destination for Americans seeking greener (and cheaper) pastures. And though major metropolitan centers in the Lone Star State have seen significant positive net migration over the past four years – much of that growth has taken place outside of the state’s biggest cities.
How will Texas’ population continue to evolve over the next months and years? Will big cities make a comeback – or are suburbs and smaller towns poised to remain the main drivers of growth?
Follow Placer.ai’s data-driven domestic migration analyses to find out.
This blog includes data from Placer.ai Data Version 2.0, which implements improvements to our extrapolation capabilities, adds short visit monitoring, and enhances visit detection.

St. Patrick’s Day, which falls each year on March 17th, is a day for bar crawls, green makeup, and drinks with friends. Cities like New York and Chicago host major celebrations, drawing big crowds to their downtown areas. And bars and pubs fill up with revelers eager to mark the occasion with a green cocktail or a taste of corned beef and cabbage.
There’s plenty of joy to go around – and towns across the country are getting in on the St. Paddy’s Day action with parades and family-friendly events. What kind of a lift do traditional St. Patrick’s Day destinations like bars and pubs get on the big day? And what other retail categories stand to benefit from the occasion?
A Lucky Day for Bars and Pubs, of Course
Unsurprisingly, bars and pubs get major boosts on the week of St. Patrick’s Day, as club hoppers and other celebrants converge on their local watering holes for drinks and fun. Chains like The Brass Tap and Bar Louie offer special deals and parties, with everything from green beer to Irish whiskey. And on the week of March 11th, 2024, visits to the two chains were up 15.7% and 21.1%, respectively, compared to an early October baseline – slightly outpacing even the busy Christmas season.
.avif)
Pharmacies and Grocery Stores: Hold my Beer
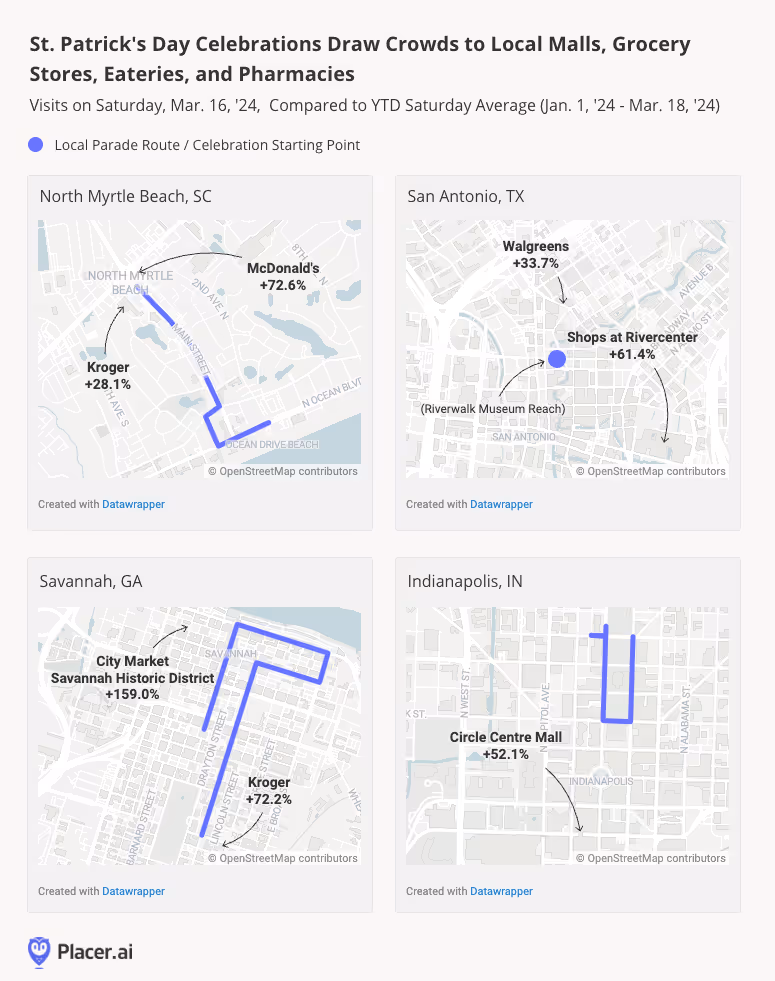
But St. Patrick’s Day isn’t just for bar crawling. And although the festivities are usually associated with major metropolises like New York City and Chicago, cities like Myrtle Beach, SC, San Antonio, TX. Indianapolis, IN, and Savannah, GA also come to life mid-March with parades and parties rivaling those of their bigger counterparts.
On Saturday, March 16th 2024 at 11:00 A.M., San Antonio, TX kicked off its annual St. Patrick’s Day festivities with the traditional dyeing of the San Antonio River. Throughout the weekend, parades and celebrations drew crowds to the city’s famed River Walk – and while bars and clubs undoubtedly benefited from the excitement, they weren’t the only ones to do so. San Antonio’s Shops at Rivercenter enjoyed its busiest day since 2019, drawing 61.4% more foot traffic on March 16th than on an average Saturday this year.
Savannah, GA, North Myrtle Beach, SC, and Indianapolis, IN also hosted big St. Patrick’s Day events, bringing foot traffic – and business – to local retailers. For Savannah, March 16th, 2024 marked the 200th anniversary of the city’s famous St. Patrick’s Day Parade, and the town was positively booming. City Market, the iconic shopping corridor located in the heart of Savannah’s Historic District, was the most crowded it’s been since at least January 2023, with March 17th 2023 (the day of last year’s parade) coming in a close second.
Malls and shopping districts weren’t the only places to get significant leprechaun-inspired visit bumps. Grocery stores, pharmacies, and eateries located in proximity to the festivities also reaped the benefits of the hubbub, as parade-goers likely dropped in to snag some essentials or fuel up for the long day.
Leprechauns Have to Sleep Somewhere… Hotels Get a Boost
And it isn’t just locals turning out for all these events. A look at hotel foot traffic patterns nationwide shows that the week of St. Patrick’s Day kicks off the hospitality industry’s spring season – with cities hosting special events seeing even more significant visit spikes. During the week of March 11th, 2024, hotel venues in the analyzed cities drew many more visits than usual, showcasing the power of St. Paddy’s Day to supercharge the tourism sector.
.png)
Plenty of Green to Go Around
St. Patrick’s Day is about a lot more than bars and pubs. And in recent years, the popular green-themed holiday has emerged as an important driver of tourism and retail activity across the U.S.
What other local celebrations are fueling foot traffic spikes in cities nationwide? Does your city know the impact of location celebrations on local businesses? Are local businesses prepared for the increase in foot traffic and revenue opportunities during local celebrations?
Follow Placer.ai’s data-driven civic and retail analyses to find out.
This blog includes data from Placer.ai Data Version 2.0, which implements improvements to our extrapolation capabilities, adds short visit monitoring, and enhances visit detection.

