


.svg)


Darden Restaurants (NYSE: DRI) latest foot traffic provides an under-the-hood look at how the dining operator is navigating shifting consumer behavior, portfolio dynamics, and expansion in a challenging environment. In its most recent quarterly earnings, management reported sales of $2.9 billion, up 6% year over year, and adjusted EPS of $2.03, topping analyst expectations.
Darden Traffic Returns to Growth
Following several months of slower traffic, Q2 2025 visits to all Darden concepts rose 2.4% YoY, with same-store visits climbing 1.1%. Monthly visit data also showed consistent upward growth, with strong gains in May (4.6%) and August (4.3%). And even slight visit dips in June were quickly followed by renewed growth, underscoring the company's resilience.
Some of this growth may be tied to Darden’s steady unit expansion, including its recent acquisition of Tex-Mex chain Chuy’s. But the increase in same-store visits shows that growth isn't just from new locations – existing restaurants are also attracting more diners, underscoring the strength and resilience of the company's portfolio.
Varied Performance Across Brands
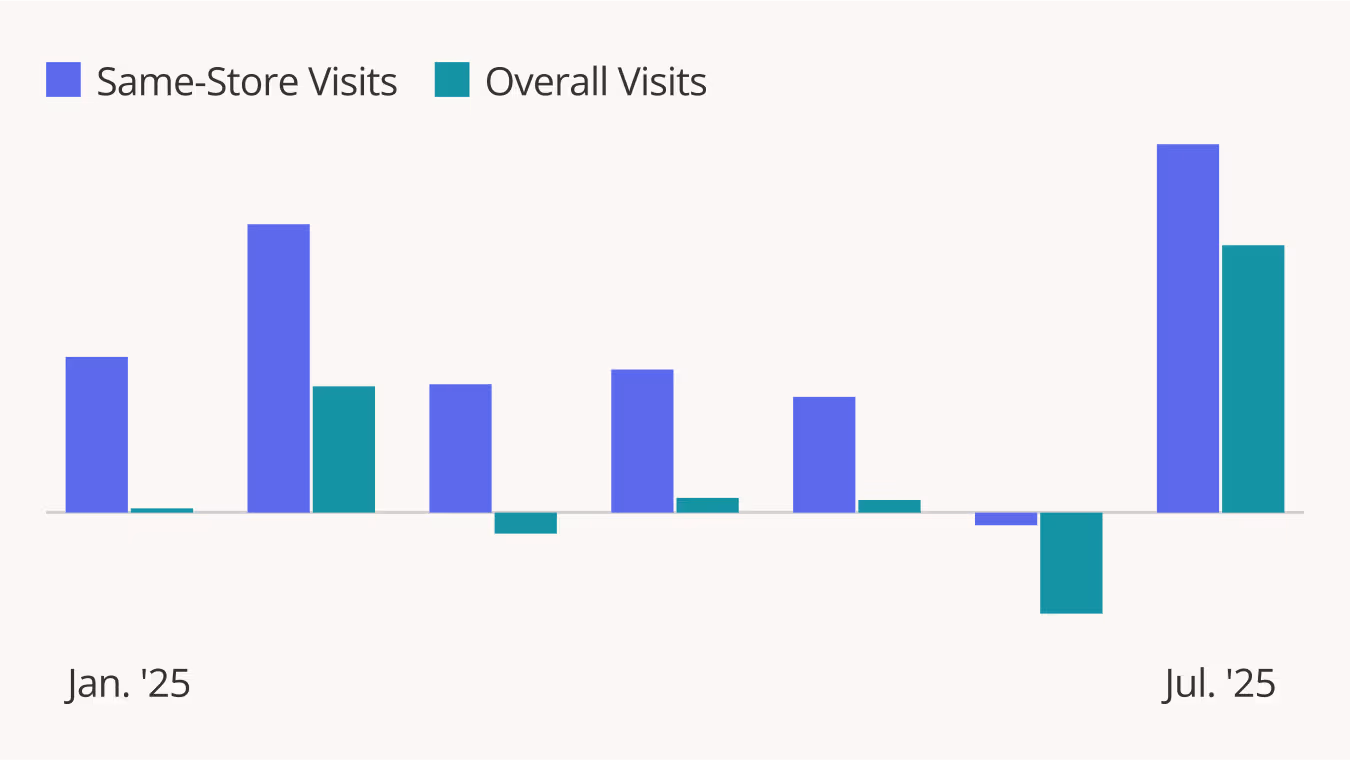
Olive Garden and LongHorn Steakhouse are by far the two largest chains in Darden’s portfolio, and both enjoyed solid visit growth over the period, as shown in the chart below. The standout, however, was Yard House, which posted a 6.2% increase in overall visits alongside a 4.3% gain in same-store visits in Q2 2025.
Yard House attracts a more affluent customer base with a trade area median household income of $82.6K compared to $69.0K to $70.1K for LongHorn and Olive Garden, respectively. This higher income profile may be making Yard House visitors less vulnerable to current consumer headwinds and helping boost the chain's traffic. Yet the continued strength of Olive Garden and LongHorn – despite their lower-income trade areas – underscores the resilience of these brands and shows how their broad appeal allows them to thrive even in more cost-sensitive markets.
Meanwhile, Cheddar’s Scratch Kitchen, Darden’s third-largest concept, maintained visits largely in line with 2024 levels, showing stability but not the same growth momentum as other Darden brands. As the chain with the lowest-income customer base – Cheddar's draws from trade areas with a median household income of just $64.0K – its softer trajectory likely reflects greater budget constraints among its diners. Still, its steadiness underscores Darden’s success in cultivating concepts that resonate across the income spectrum: Yard House is thriving with more affluent guests, Olive Garden and LongHorn are performing strongly among middle-income households, and Cheddar’s continues to hold its ground with more cost-sensitive customers. Together, these dynamics show how Darden’s brands remain relevant to a broad swath of diners even in a challenging economic climate.
Coasts vs. Heartland
More than half (51.1%) of all Darden visits in H1 2025 went to Olive Garden, making it the company's top traffic driver. But the company is still expanding its existing brands, with LongHorn and Olive Garden leading new location openings.
The map below highlights the brand – Olive Garden or LongHorn – that experienced the greatest YoY visit growth in each state in Q2 2025. This map reveals that LongHorn beat out Olive Garden in terms of YoY growth on most of the East Coast as well as in California and parts of the Midwest and Southeast – suggesting that the brand is capturing share in densely populated coastal markets. So while Olive Garden continues to anchor the business with sheer volume, LongHorn seems to be driving much of the incremental growth, giving Darden two powerful engines for expanding and solidifying its hold on the casual dining segment across the country.
Serving Up Growth
Darden's recent traffic data reveal resilience in the face of a wider slow down in consumer dining trends, powered by a mix of steady performance and faster growth from its four largest brands. Continued unit expansion, alongside the recent addition of Chuy’s, should further broaden its reach while diversifying its customer base.
For up-to-date consumer dining trends, check out Placer.ai’s free tools.
Placer.ai leverages a panel of tens of millions of devices and utilizes machine learning to make estimations for visits to locations across the US. The data is trusted by thousands of industry leaders who leverage Placer.ai for insights into foot traffic, demographic breakdowns, retail sale predictions, migration trends, site selection, and more

Chicken, Mexican, and Coffee Chains Lead 2025 QSR Trends
This year has posed challenges for limited-service dining chains as inflation and higher prices continued to weigh on consumer traffic. We analyzed visitation trends in 2025 so far across major segments to better understand which categories are holding up – and which may need to adjust strategies.
Coffee, Chicken, and Mexican-Inspired Chains Lead Limited Service Dining
This year brought significant challenges for the limited-service dining industry, as persistent price increases kept many would-be diners at home. Even industry giants like McDonald’s reported declines in same-store sales as lower- and middle-income consumers pulled back spending. Yet several categories, including the ever-impressive chicken segment, managed to buck the trend.
The chart below highlights the differences in YoY foot traffic for major limited service dining concepts in H1 2025. Pizza, burger, and sandwich chains experienced declines, while coffee, chicken, and Mexican-inspired concepts emerged as the growth drivers in terms of overall visit increases.
These segments were likely aided by aggressive unit expansion and consumer preferences shifting toward more affordable, customizable, and protein-forward options. Coffee continues to hold steady as a daily staple, while chicken and Mexican-inspired operators are capturing demand for protein-forward and customizable formats.
However, per-location data tempers this growth narrative. Visits per store declined across every major category – even those with overall visit increases – indicating that expansion may be outpacing underlying demand and pushing the segment toward potential oversaturation.
Softer August Results
Recent summer data underscores the cautionary signals. Year-over-year traffic growth for coffee, chicken, and Mexican-inspired concepts was weaker in July than in the first half of the year. By August, declines had spread across nearly every category – with chicken chains in particular seeing a dip in traffic and an even steeper drop in average visits per location – leaving coffee as the only segment to sustain growth.
This broader slowdown in limited-service dining, combined with persistent economic uncertainty, suggests that consumers may be scaling back restaurant spending – even in categories traditionally viewed as more budget-friendly.
Final Thoughts
While 2025 has been marked by volatility, the underlying consumer appetite for convenient, protein-forward, and customizable dining is helping some limited-service segments stay ahead of the pack. Still, visit per location data suggests that expansion plans may need to be put on ice for the next few quarters.
Instead, operators that focus on menu innovation, building loyalty, and driving higher output per store stand to capture demand when economic pressures ease. As confidence rebounds, concepts that have expanded strategically may be especially well positioned to benefit from renewed consumer traffic.
For the most up-to-date dining data, check out Placer.ai’s free tools.
Placer.ai leverages a panel of tens of millions of devices and utilizes machine learning to make estimations for visits to locations across the US. The data is trusted by thousands of industry leaders who leverage Placer.ai for insights into foot traffic, demographic breakdowns, retail sale predictions, migration trends, site selection, and more.
Bath & Body Works emerged as a surprise retail winner in February 2025’s Placer 100 roundup, when overall visits to the chain jumped by 13.7% YoY in conjunction with its Disney-themed fragrance release. And the chain is maintaining its relevance in the face of declining discretionary spending and tighter consumer budgets through a multi-pronged approach, including store expansions, a TikTok presence, and partnerships with influencers.
Still, traffic to the chain reflects the impact of softened discretionary spending. Although overall traffic increased 3.5% in Q2 2025 compared to Q2 2024, thanks in part to the chain's strategic expansion, same-store visits for the quarter fell slightly, as seen in the chart below. But foot traffic rebounded dramatically in July, when its semi-annual sale sent same-store visits up by 12.7% and overall visits up by 17.5%, highlighting how compelling promotions – especially when consumer budgets are tight – can lead to foot traffic spikes.
Visit Placer.ai/anchor for the latest data-driven retail insights.
The beauty industry continues to flourish, with external factors like the rise of #BeautyTok, the influence of online creators, and a steady stream of new products driving interest. Within this landscape, Ulta (ULTA) has been driving strong sales, capitalizing on continued interest in beauty to fuel this growth.
Ulta Navigates Headwinds
Following major gains through the pandemic years and beyond, Ulta's visits have flattened slightly. In Q2 2025, overall visits to the chain grew by 1.4% year over year (YoY), likely thanks to store openings (Ulta opened 62 new stores between Q1 2024 and Q1 2025), as same-store visits declined by 1.1% in the same period.
Despite softer same-store foot traffic as seen in the chart below, Ulta delivered strong comp sales growth of 2.9% last quarter, driven by a 2.3% rise in average ticket size and a 10.0% increase in e-commerce sales. Now, the chain seems to be entering a new phase of its story, choosing to wind down its Target partnership in favor of its Ulta Beauty Unleashed growth plan.
Ulta Shoppers Ready for Target Break
As Ulta’s growth momentum slows, its decision not to renew its six-year partnership with Target may be a strategic move to direct traffic to its growing store fleet.
The partnership launched in 2021 with the goals of making prestige beauty more accessible to Target shoppers while helping Ulta "deepen loyalty with existing guests and introduce Ulta Beauty to new guests." And, at least for Ulta, the strategy seems to have worked – the share of Target shoppers also visiting Ulta stores has increased significantly since the launch, as seen in the chart below. This suggests that the Ulta shop-in-shops helped the chain acquire new customers through the brand exposure generated by the partnership.
But the data also suggests that the benefits to Ulta may be diminishing. Since 2023, the share of Target shoppers also visiting Ulta appears to have plateaued around 30%, indicating that the shop-in-shops are no longer driving meaningful traffic to stand-alone Ulta stores. Meanwhile, Ulta now has a larger store fleet than it did in 2021 (the company opened approximately 150 new stores between Q2 2021 and Q1 2025). This expansion likely also contributed to increased cross-visitation while reducing the partnership's value proposition, as beauty consumers now have more opportunities to visit standalone Ulta stores. With the partnership's customer acquisition benefits plateauing and Ulta's expanded footprint reducing reliance on Target's locations, ending the collaboration appears to be a logical step toward maximizing traffic to Ulta's own stores.
Now, both brands have new opportunities to focus on their relative strengths. For Ulta, that means building out its Ulta Beauty Unleashed program, which will see the brand focus on improving store operations, enhancing the digital experience, and moving into new markets. Meanwhile, incoming Target CEO Michael Fiddelke plans to take the company back to its roots, focusing on its own merchandise and using technology to improve efficiency.
Ulta Beats Expectations
As Ulta transitions away from its Target partnership and focuses on its Ulta Beauty Unleashed growth plan, the company is well-positioned to capitalize on expanding store operations, enhanced digital experiences, and entry into new markets.
For the latest data-driven retail insights, visit Placer.ai/anchor.

While consumer confidence has rebounded slightly in July, many customers are still prioritizing value-centric retail. And perhaps driven by this continued focus on value, off-price apparel chains Burlington (BURL), Ross Dress for Less (ROST), and Citi Trends (CTRN) generally experienced foot traffic and loyalty growth between April and July 2025, an encouraging metric as the critical back-to-school season ramps up.
Overall Visits Hold Steady
Overall visits to Burlington, Ross, and Citi Trends increased YoY in Q2 2025 as value-forward chains continue to benefit from shoppers' increasingly budget-conscious preferences.
Burlington saw the largest increase in overall growth (+8.0% YoY), driven in part by the company's ambitious expansion plan for 2025. Ross also added new stores in 2025, helping drive a 5.8% increase in overall visits. And Citi Trends succeeded in boosting visits 4.1% YoY while maintaining a similar sized fleet.
Citi Trends Leads Same-Store Visit Growth
Citi Trends' capacity to drive growth without expansion comes across when comparing the three chains' same-store visit trends. Citi Trends led with a 4.7% growth YoY, followed by Ross and Burlington which also enjoyed elevated visits, at 3.6% and 2.5%, respectively, compared to 2024.
Monthly visits showed similar growth patterns – and although traffic trends softened in June, likely driven by the retail correction following April and May’s pull-forward of demand, visits rebounded quickly the following month.
Visitor Loyalty Grows
The recent increases in visits are not just due to expansions or to the acquisition of new customers. The rates of returning visitors in 2025 are higher than they were at the same periods of 2024, indicating that off-price retailers are strengthening their domination over the brick-and-mortar apparel space.
The increase in visitor frequency is likely driven by a combination of today's shoppers' extreme value orientation – with some consumers likely trading down from traditional apparel – and by the treasure hunt experience created by these chains. Shoppers know that the inventory can change significantly from week to week, which incentivizes frequent trips.
Ross in particular appears to excel in attracting high shares of repeat visitors, perhaps thanks to the relatively high median household income in the chain's trade area ($73.0K compared to $68.6K for Burlington and $47.8K for Citi Trends). This could mean that Ross's visitors have a larger discretionary budget to spend on affordable luxuries – such as off-price apparel.
Strategic Insights
The three off-price retailers continue to thrive, driven by high rates of loyal visitors and store expansions. Will visits continue to grow through back-to-school and into the holiday season?
For the latest data-driven foot traffic insights, visit Placer.ai/anchor.
The home improvement segment continues to face challenges in 2025, but a deeper look into the data for Home Depot and Lowe's reveals a nuanced story of sector-wide headwinds, divergent brand performances, and potential signs of recovery.
Home Depot Visits Start to Stabilize
Existing-home sales, which can often serve as a powerful indicator for how the home improvement retail sector may behave, are at some of their lowest rates in years. This housing market softness has translated into lowered consumer activity at project-driven stores like The Home Depot. Visits to the home improvement chain were down by -3.9% YoY in Q1 2025 before moderating to a 2.2% decline in Q2.
Monthly visit data offers a more granular view of Home Depot's performance. Despite a sharp YoY decline of 9.2% in February – likely due to inclement weather and the leap year comparison – visits recovered quickly. By July, foot traffic was down by just 2.5% YoY.
These trends point to a cautious stabilization, perhaps driven by shifting economic realities. With home equities up roughly 6% YoY and over half of U.S. homes at least 40 years old, homeowners are undertaking necessary repairs – and Home Depot's status as a contractor hub may help boost visits as economic concerns cool. The company is also leaning into its strengths and driving sales through other channels, such as its B2B offerings, helping position it for growth as market conditions improve.
Lowe’s Professional Pivot
Lowe's also faced a challenging first half of 2025, with foot traffic trends mirroring the broader home improvement sector's struggles. Quarterly visits declined by 3.7% in Q1 and 3.8% in Q2 on a year-over-year (YoY) basis, reflecting persistent pressure on consumer spending. But visit gaps narrowed by the end of Q2, and by July 2025 were just 1.1% lower than in July 2024.
Like Home Depot, Lowe's was likely impacted by the economic uncertainties and a slower housing market. But unlike Home Depot, Lowe’s still relies on DIYers for the majority of its business. Executives blamed unfavorable weather for pushing back the spring home improvement season, which led to softer DIY performance at Lowe’s in their first fiscal quarter (ending May 2nd 2025) and may have contributed to Lowe's underperformance relative to Home Depot.
A Midwest Opportunity
Drilling down into regional foot traffic trends for Home Depot and Lowe’s in July reveals that success in the home improvement sector in 2025 is highly localized. Even during the recent challenging period, both chains experienced pockets of YoY visit growth, particularly clustered in parts of the Midwest and Southeast. For Home Depot, traffic trends were strongest in North Dakota, where YoY visits grew by 7.6% – but visit growth was clustered throughout the region. Lowe’s also enjoyed visit growth across several states, with its strongest performance centered in Midwestern states like Indiana (+4.4%) and Kentucky (+2.8%).
These geographic patterns highlight how demand in the home improvement segment shows significant variance by market, with both chains appearing to benefit in areas with steadier home sales. This is a reminder that, while nationwide visits are lower than in previous years, pockets of strong local demand can still provide a significant boost for each brand.
Strategic Insights
Moving forward, the home improvement segment has plenty of ways to adapt to a softening economic environment and slowing home sales. Will home improvement visits pick up? Or will housing market challenges continue to spill over to foot traffic?
Visit Placer.ai/anchor for the latest data-driven retail insights.

