.png)
.png)

.png)
.png)

.avif)
From Michigan Avenue to Main Street, retail corridors have long served as a barometer of urban vitality – and their post-pandemic trajectory has become one of the most closely watched storylines in retail real estate. We dove into the data to see how these districts are faring in 2026, and what AI-powered location analytics reveal about when, and why, people are showing up.
After several years of gradual improvement, the post-pandemic retail corridor recovery stalled in early 2026. Visits remained 12.6% below 2019 levels in Q1 and 12.5% below in Q2, reversing some of the gains made during 2025, when the Q2 gap had narrowed to just 9.5%. The slowdown coincided with a broader cooling in consumer demand, with shoppers growing more selective and trimming discretionary purchases.
So what's behind the widening recovery gap, and where are the bright spots?
Comparing Q2 2026 visits with Q2 2019 by daypart shows that the largest remaining recovery deficit is concentrated during weekday mornings and afternoons, with Monday through Friday visits between 8 AM and 4 PM still running 20% to 30% below pre-pandemic levels. That pattern closely mirrors office attendance trends, which remained roughly 30% below pre-pandemic levels this spring. With fewer commuters flowing through downtowns, the coffee runs, lunch breaks, and midday errands that once sustained corridor traffic have yet to fully return.
The pattern, however, is markedly different on weekends. Visit gaps on Saturday and Sunday mornings were significantly smaller and narrowed throughout the day before disappearing entirely by evening. Friday visits between 8 PM and 12 AM exceeded Q2 2019 levels by 2.0%, while Saturday evening visits came in 0.7% above the pre-pandemic benchmark.
In other words, while remote work continues to reshape weekday routines and consumers scale back daytime shopping, retail corridors remain compelling destinations for entertainment, socializing, and dining. The trend aligns with broader consumer spending patterns showing that even budget-conscious households continue to prioritize experiences over goods. It also reflects what's happening on the ground in downtowns nationwide, where restaurants are driving retail leasing activity and cities are increasingly investing in programming that attracts visitors after hours.
Year-over-year data also shows that even though the recovery has stalled, evenings continue to gain momentum. Although overall retail corridor visits fell 3.3% in Q2 2026, nighttime visitation increased across the week. Weekend mornings also proved relatively resilient, while midday shopping hours (12 PM to 4 PM) posted the steepest declines.
At the same time, average dwell time rose from 118.0 minutes in Q2 2025 to 123.0 minutes in Q2 2026. So while fewer people may be visiting retail corridors overall, those who do visit appear to be staying longer than they did last year – a sign that corridors are increasingly serving as destinations in their own right.
Retail corridors may still be waiting on the office worker, but they are increasingly winning the off-the-clock hours. As daytime shopping softens, evenings have become the corridors' engine of growth – especially on Fridays and Saturdays – powered by diners, barhoppers, and experience-seekers who keep showing up even as they tighten their belts elsewhere. For retailers, restaurants, property owners, and civic stakeholders, the evening and weekend windows look like the clearest growth opportunities of 2026.
Will nighttime visitation continue gaining momentum in the second half of the year? Or will office recovery finally spark a weekday daytime comeback? Visit placer.ai/anchor to find out.
%20(1).avif)
June marked the third consecutive month of year-over-year (YoY) visit growth across all three mall formats, and AI-powered audience analysis suggests these gains are coming from an increasingly diverse customer base. We dove into the foot traffic data to see what's driving mall performance heading into the second half of the year.
Visits to indoor malls, open-air shopping centers, and outlet malls all remained in positive YoY territory in June 2026, with indoor mall visits up 1.2%, open-air shopping center visits up 5.1%, and outlet mall visits up 1.0% compared to June 2025.
June's performance caps a strong first half of the year. Aside from a March dip, likely driven in part by calendar shifts and by the initial gas price shock, every month of 2026 has seen visit growth across all three formats – though open-air shopping centers continue to set the pace. The format has posted the strongest YoY visit growth every month this year and has hovered above 5.0% growth in both May and June, highlighting the enduring appeal of outdoor, convenience-driven retail as the weather warms up.
Analyzing malls' captured market audience makes the outlook for malls even more compelling heading into H2 2026. Much of the recent retail narrative has centered on a bifurcated consumer, with spending growth concentrated among higher-income households while more value-conscious consumers pull back. Mall audience data, however, suggests a different dynamic.
Across all three mall formats, the median household income (HHI) of the captured market declined modestly between June 2025 and June 2026. Combined with rising visit volumes, this suggests that malls are broadening their appeal and attracting a wider range of consumers, including more value-conscious shoppers – suggesting that malls are expanding their customer base rather than relying more heavily on affluent shoppers.The category's combination of retail, dining, entertainment, and one-stop convenience may be helping malls resonate with a broader audience in an environment where consumers remain selective about discretionary spending.
With all three formats posting YoY visit growth and audiences broadening, malls enter the back half of 2026 with real momentum. As retailers and mall operators plan for the critical back-to-school and holiday seasons, the challenge will be converting this wider, more diverse audience into loyal, repeat visitors.
For more data-driven retail insights, visit placer.ai/anchor.

Consumers are entering the back half of 2026 under real pressure. The University of Michigan's consumer sentiment index registered 49.5 in June, the second-lowest reading in records going back to the 1970s and nearly 20% below where it sat a year earlier. According to Deloitte, roughly four in 10 Americans now exhibit deal-driven, cost-conscious habits, and close to seven in 10 retail executives view value-seeking as a structural change rather than a temporary one.
So when Amazon's Prime event ran June 23rd to 26th, alongside overlapping promotions from Walmart, Target, Best Buy, and Kohl's, the week became more than a battle for retail traffic. It became a barometer. Who shows up when the deals land, when they show up, and where they steer their trips offers a real-time read on how a pressured, deliberate consumer is actually behaving. We analyzed foot traffic across the four major chains to find out.
Measured against each retailer's year-to-date day-of-week average, the four major retailers analyzed all saw visits climb during Prime Week. Best Buy and Kohl's led the pack on opening day, with visits running 18.1% and 18.4% above their respective baselines on June 23. Target wasn't far behind at 16.3%, while Walmart posted a steadier 4.7% increase. And all four chains continued seeing visit gains throughout the analyzed period.
A lift across all four chains, not just Amazon's direct competitors in one category, suggests a consumer who is responsive and cross-shopping. When promotions appear, the value-seeker turns out, and they spread those trips across whichever retailers are running deals.
Isolating the event from seasonality sharpens the picture. Comparing daily visits to the prior five weeks' day-of-week average controls for longer-term trends, which matters this year because Prime Day shifted to late June, much closer to Memorial Day and Father's Day than usual and against a higher recent traffic baseline. Even on that tougher benchmark, Best Buy stood out, with visits up 12.3% on June 23 and holding double digits through Thursday. Target saw a meaningful early-week lift, while Walmart sat just below its recent baseline and Kohl's slipped to -3.9% by Friday.
Best Buy's strength against recent weeks carries the most useful read on the consumer. Electronics are big-ticket and discretionary, the kind of spending a pressured shopper might be expected to defer. But the event-driven lift suggests that consumers have not stopped making sizable purchases – they have just made them event-dependent.
But stacking 2026 against the comparable 2025 Prime Week (July 8th to 11th) adds another layer to the story. Target was the standout performer here, with visits up 10.3% year-over-year (YoY) on opening day and gains every single day of the event. Kohl's also outpaced last year through most of the week, while Walmart held modestly positive ground throughout.
Best Buy tells the most complex story. Even as it posted the strongest event-driven lift relative to recent weeks, its visits ran 2% to 5% below last year's Prime Week – a reminder that a strong showing against a recent baseline doesn't always translate to year-over-year growth. These YoY declines suggest that while compelling promotions can still draw shoppers into stores, they have not fully offset softer demand for discretionary electronics.
Analyzing offline traffic to major retailers during Prime Day 2026 suggests that, although sentiment may be near record lows and value-seeking may now be a fixed habit, the appetite to spend is still there – although it has become more deliberate.
For more data-driven retail insights, visit placer.ai/anchor

Bed Bath & Beyond returned to physical retail in August 2025, when the first store to carry the name since the chain's 2023 liquidation opened in Brentwood, Tennessee. The format signaled how much the strategy had changed. At roughly 15,000 square feet, in a former Kirkland's, the location is a fraction of the 25,000-to-50,000-square-foot stores the brand operated before bankruptcy, reflecting a deliberate move toward smaller, neighborhood-format stores.
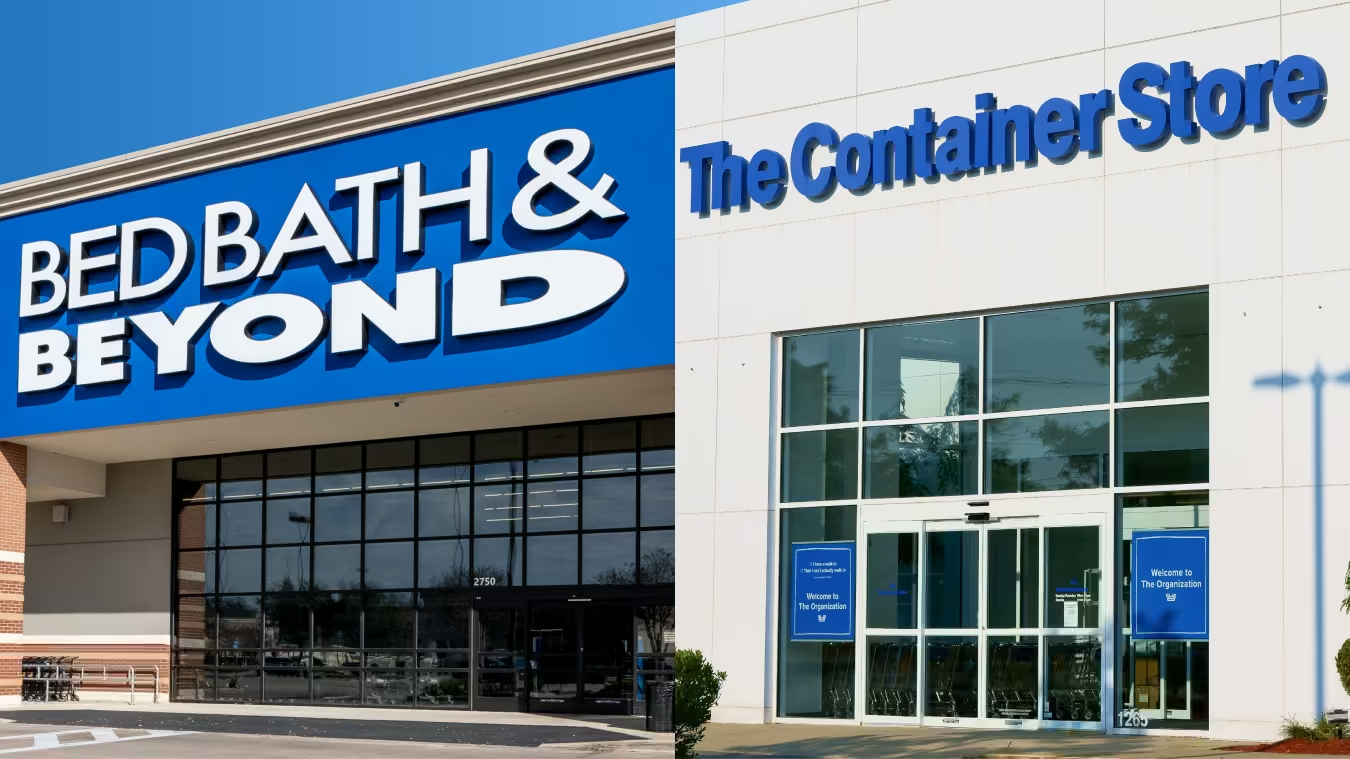
The format shift is just one element of a broader restructuring. The name now belongs to Beyond Inc. – since renamed Bed Bath & Beyond Inc. – which is reviving the legacy brand through two distinct acquisitions. The company is acquiring Kirkland's, the home-decor chain, and converting select stores into small-format Bed Bath & Beyond Home locations, and has also agreed to acquire The Container Store and co-brand its stores as "The Container Store / Bed Bath & Beyond."
But in a category that increasingly rewards discounters and sharply differentiated retailers, is there still room for a brand like Bed Bath & Beyond, and in what form?
It is easy to forget how dominant Bed Bath & Beyond once was. In 2019, already past its heyday, it still captured the single largest share of visits to home furnishing retailers in the country, acting as the broad, generalist default for the category.
A lot has changed since. Visits to brick-and-mortar home furnishing retailers fell roughly 27% from 2019 to 2025, and within that smaller pie the leaderboard reshuffled around Bed Bath & Beyond's absence. HomeGoods now sits at the front, reflecting where the category's momentum has gone – toward off-price and sharply differentiated retailers. At the same time, no single full-price, national retailer moved into the position Bed Bath & Beyond vacated, the broad home brand that shoppers across very different incomes and life stages defaulted to.
That open role is the opening a revived Bed Bath & Beyond is built around. The brand is betting that what failed was the format – a massive store carrying an exhaustive, full-price assortment behind a coupon, which is a format that off-price now beats on price and that specialists beat on focus. But the recognition itself, a name a wide range of shoppers still associate with outfitting a home, has remained strong, and the comeback may work if it claims the role without rebuilding the format. That is what the unusual structure is designed to do.
Share of Total Home Furnishing Visits by Chain — the 20 Largest Plus All Others — 2019 vs. 2025
Circle area is proportional to each year's total visits, which fell about 27% from 2019 to 2025. Slices show each chain's share of all home furnishing visits; the 20 largest chains are shown individually and the remainder is grouped as "Other." Bed Bath & Beyond liquidated all its stores in 2023 (its small 2025 relaunch was too recent to register here); Christmas Tree Shops (2023) and Conn's HomePlus (2024) closed all locations and have not returned. Source: Placer.ai.
| Retailer | 2019 visit share | 2025 visit share |
|---|---|---|
| Bed Bath & Beyond | 23.7% | 0.0% |
| HomeGoods | 19.3% | 38.3% |
| IKEA | 11.5% | 11.2% |
| At Home | 7.5% | 10.5% |
| World Market | 5.3% | 7.2% |
| Ashley | 4.4% | 5.1% |
| Kirkland's | 4.0% | 3.0% |
| Christmas Tree Shops | 3.7% | 0.0% |
| The Container Store | 1.8% | 1.6% |
| Rooms To Go Furniture Store | 1.7% | 1.8% |
| Bob's Discount Furniture | 1.4% | 2.7% |
| Pottery Barn | 1.1% | 1.2% |
| Crate and Barrel | 1.0% | 1.4% |
| Old Time Pottery | 1.0% | 0.6% |
| Conn's HomePlus | 1.0% | 0.0% |
| La-Z-Boy | 0.9% | 1.0% |
| Value City Furniture | 0.8% | 0.9% |
| Raymour & Flanigan Furniture Store | 0.7% | 0.9% |
| Homesense | 0.7% | 2.9% |
| Living Spaces | 0.7% | 1.1% |
| RH (Restoration Hardware) | 0.0% | 0.8% |
| Norwalk Furniture | 0.0% | 0.6% |
| Furniture Row | 0.0% | 0.5% |
| Other | 7.8% | 6.8% |
Rather than reopen its own stores, Bed Bath & Beyond is returning through two retailers it is absorbing, both of which have been losing visits year over year. The declines are not one shared problem but two different ones, and the logic of the comeback is that the Bed Bath & Beyond name addresses each.
The Container Store's difficulty is frequency, with a business organized around storage and home organization – a category shoppers turn to only in occasional project bursts, and affluent customers likely have few reasons to come back between closet overhauls and moves. Co-branding the stores as Bed Bath & Beyond is meant to widen that reason to visit, folding in the everyday kitchen, bath, and bedding categories the name is known for, and lifting trip frequency without pushing away the premium shopper the chain already has.
Meanwhile, Kirkland's is a broad home-and-decor generalist without a sharp identity, sitting in the same exposed middle that off-price and specialists have been pulling apart – its stores draw a mainstream suburban shopper but offer little specific reason to choose them. Converting them to Bed Bath & Beyond Home is meant to supply that reason, a more recognized name with broader pull than the Kirkland's banner generated on its own.
Beyond improving the assortment, Bed Bath & Beyond can also boost traffic to converted Kirkland stores and co-branded The Container Stores by bringing in an audience that each chain lacks.
The Container Store draws a narrow, premium audience organized around storage and home organization, while Kirkland's draws a broader, more middle-income suburban shopper for general home goods and decor. Analysing each chain's trade area composition as well as Bed Bath & Beyond's 2019 audience suggests that Bed Bath & Beyond can help each one reach the half of the market it currently misses: In its last pre-COVID year, Bed Bath & Beyond over-indexed both among the premium households The Container Store already draws and among the mainstream suburban families that have long anchored Kirkland's.
And for Bed Bath & Beyond, the arrangement supplies two store networks aimed at different shoppers, one more affluent, one more mainstream, reached through a single name both still recognize.
At the same time, the challenges should not be understated. A recognized name is the beginning of a value proposition rather than a substitute for one, and the proposition the brand carried into bankruptcy, an exhaustive assortment paired with a coupon, is the one that ultimately failed.
But two years after the chain closed, many consumers still think of Bed Bath & Beyond as a destination for home essentials, the kind of store associated with furnishing a first apartment, outfitting a dorm, or building a wedding registry. And familiarity has proven effective at generating first visits, as a range of revived retailers from Abercrombie to Polaroid suggests, but converting those visits into a habit is a separate question. Whether shoppers return will depend less on the name above the door than on what the reformatted stores actually offer.
For more data-driven insights, visit placer.ai/anchor

When Red Lobster filed for bankruptcy in May 2024, much of the blame landed on a single menu item: a $20 Ultimate Endless Shrimp deal that proved far too popular for its own margins. The chain shuttered roughly 130 locations, was acquired by Fortress Investment Group, and brought in a new CEO to steady the brand.
So the decision to bring Endless Shrimp back in spring 2026 – this time as a limited-run promotion – wasn't an obvious one. We dove into the data to see how the relaunch is landing, and what it would take for Red Lobster's comeback to hold.
In the weeks before the Endless Shrimp relaunch, the average number of visits to each Red Lobster location was running below year-ago levels – down by as much as 8.7% year over year (YoY) the week of April 13, and lagging the broader full-service restaurant segment.
Then came April 20. During the first full week of the Ultimate Endless Shrimp promotion, Red Lobster's per-location visits flipped sharply positive and have stayed there since, peaking at 24.3% YoY the week of April 27 and holding double-digit gains into early June – though the magnitude of the boost has gently eased over time. Notably, this outperformance came while full-service restaurant traffic remained roughly flat YoY.
The traffic surge suggests that Red Lobster's brand equity remains strong. Even after bankruptcy, store closures, and years of operational challenges, the chain was able to generate a meaningful visitation lift by bringing back one of its most recognizable promotions.
But Endless Shrimp can only do so much – and the pressures facing the chain, from elevated seafood costs to a burdensome lease portfolio, will remain even after the promotion inevitably ends. As the company continues to rightsize and improve profitability, the key question is whether its investments in menu innovation and customer experience will be enough to garner lasting customer loyalty. Will Endless Shrimp have a better ending this time around?
Visit Placer.ai/anchor to find out.
.avif)
Anchored Ep 7: The Data-Driven Customer Era
Zora Sentat has spent her career at the intersection of data, marketing, and commerce. As Chief Commercial Officer at cubeiQ, she's seen how businesses are – and aren't – making the most of what they know about their customers.
In the latest episode of Anchored, Zora joined Ethan Chernofsky to discuss the state of the data landscape, where retail media is falling short, and why human expertise still matters in an increasingly automated world.
Here are 5 key takeaways from the conversation:

1. The hypergrowth of Costco, Dollar Tree, and Dollar General between 2019 and 2025 has fundamentally changed the brick-and-mortar retail landscape.
2. Overall visits to Target and Walmart have remained essentially stable even as traffic to the new retail giants skyrocketed – so the increased competition is not necessarily coming at legacy giants' expense. Instead, each retail giant is filling a different need, and success now requires excelling at specific shopping missions rather than broad market dominance.
3. Cross-shopping has become the new normal, with Walmart and Target maintaining their popularity even as their relative visit shares decline, creating opportunities for complementary rather than purely competitive strategies.
4. Dollar stores are rapidly graduating from "fill-in" destinations to primary shopping locations, signaling a fundamental shift in how Americans approach everyday retail.
5. Walmart still enjoys the highest visit frequency, but the other four chains – and especially Dollar General – are gaining ground in this realm.
6. Geographic and demographic specialization is becoming the key differentiator, as each chain carves out distinct niches rather than competing head-to-head across all markets and customer segments.
Evolving shopper priorities, economic pressures, and new competitors are reshaping how and where Americans buy everyday goods. And as value-focused players gain ground, legacy retail powerhouses are adapting their strategies in a bid to maintain their visit share. In this new consumer reality, shoppers no longer stick to one lane, creating a complex ecosystem where loyalty, geography, and cross-visitation patterns – not just market share – define who is truly winning.
This report explores the latest retail traffic data for Walmart, Target, Costco, Dollar Tree, and Dollar General to decode what consumers want from retail giants in 2025. By analyzing visit patterns, loyalty trends, and cross-shopping shifts, we reveal how fast-growing chains are winning over consumers and uncover the strategies helping legacy players stay competitive in today's value-driven retail landscape.
In 2019, Walmart and Target were the two major behemoths in the brick-and-mortar retail space. And while traffic to these chains remains close to 2019 levels, overall visits to Dollar General, Dollar Tree, and Costco have increased 36.6% to 45.9% in the past six years. Much of the growth was driven by aggressive store expansions, but average visits per location stayed constant (in the case of Dollar Tree) or grew as well (in the case of Dollar General and Costco). This means that these chains are successfully filling new stores with visitors – consumers who in the past may have gone to Walmart or Target for at least some of the items now purchased at wholesale clubs and dollar stores.
This substantial increase in visits to Costco, Dollar General, and Dollar Tree has altered the competitive landscape in which Walmart and Target operate. In 2019, 55.9% of combined visits to the five retailers went to Walmart. Now, Walmart’s relative visit share is less than 50%. Target received the second-highest share of visits to the five retailers in 2019, with 15.9% of combined traffic to the chains. But Between January and July 2025, Dollar General received more visits than Target – even though the discount store had received just 12.1% of combined visits in 2019.
Some of the growth of the new retail giants could be attributed to well-timed expansion. But the success of these chains is also due to the extreme value orientation of U.S. consumers in recent years. Dollar General, Dollar Tree, and Costco each offer a unique value proposition, giving today's increasingly budget-conscious shoppers more options.
Walmart’s strategy of "everyday low prices" and its strongholds in rural and semi-rural areas reflect its emphasis on serving broad, value-focused households – often catering to essential, non-discretionary shopping.
Dollar General serves an even larger share of rural and semi-rural shoppers than Walmart, following its strategy of bringing a curated selection of everyday basics to underserved communities. The retailer's packaging is typically smaller than Walmart's, which allows Dollar General to price each item very affordably – and its geographic concentration in rural and semi-rural areas also highlights its direct competition to Walmart.
By contrast, Target and Costco both compete for consumer attention in suburban and small city settings, where shopper profiles tilt more toward families seeking one-stop-shopping and broader discretionary offerings. But Costco's audience skews slightly more affluent – the retailer attracts consumers who can afford the membership fees and bulk purchasing requirements – and its visit growth may be partially driven by higher income Target shoppers now shopping at Costco.
Dollar Tree, meanwhile, showcases a uniquely balanced real estate strategy. The chain's primary strength lies in suburban and small cities but it maintains a solid footing in both rural and urban areas. The chain also offers a unique value proposition, with a smaller store format and a fixed $1.25 price point on most items. So while the retailer isn't consistently cheaper than Walmart or Dollar General across all products, its convenience and predictability are helping it cement its role as a go-to chain for quick shopping trips or small quantities of discretionary items. And its versatile, three-pronged geographic footprint allows it to compete across diverse markets: Dollar Tree can serve as a convenient, quick-trip alternative to big-box retailers in the suburbs while also providing essential value in both rural and dense urban communities.
As each chain carves out distinct geographic and demographic niches, success increasingly depends on being the best option for particular shopping missions (bulk buying, quick trips, essential needs) rather than trying to be everything to everyone.
Still, despite – or perhaps due to – the increased competition, shoppers are increasingly spreading their visits across multiple retailers: Cross-shopping between major chains rose significantly between 2019 and 2025. And Walmart remains the most popular brick-and-mortar retailer, consistently ranking as the most popular cross-shopping destination for visitors of every other chain, followed by Target.
This creates an interesting paradox when viewed alongside the overall visit share shift. Even as Walmart and Target's total share of visits has declined, their importance as a secondary stop has actually grown. This suggests that the legacy retail giants' dip in market share isn't due to shoppers abandoning them. Instead, consumers are expanding their shopping routines by visiting other growing chains in addition to their regular trips to Walmart and Target, effectively diluting the giants' share of a larger, more fragmented retail landscape.
Cross-visitation to Costco from Walmart, Target, and Dollar Tree also grew between 2019 and 2025, suggesting that Costco is attracting a more varied audience to its stores.
But the most significant jumps in cross-visitation went to Dollar Tree and Dollar General, with cross-visitation to these chains from Target, Walmart, and Costco doubling or tripling over the past six years. This suggests that these brands are rapidly graduating from “fill-in” fare to primary shopping destinations for millions of households.
The dramatic rise in cross-visitation to dollar stores signals an opportunity for all retailers to identify and capitalize on specific shopping missions while building complementary partnerships rather than viewing every chain as direct competition.
Walmart’s status as the go-to destination for essential, non-discretionary spending is clearly reflected in its exceptional loyalty rates – nearly half its visitors return at least three times per month on average -between January to July 2025, a figure virtually unchanged since 2019. This steady high-frequency visitation underscores how necessity-driven shopping anchors customer routines and keeps Walmart atop the retail loyalty ranks.
But the data also reveals that other retail giants – and Dollar General in particular – are steadily gaining ground. Dollar General's increased visit frequency is largely fueled by its strategic emphasis on adding fresh produce and other grocery items, making it a viable everyday stop for more households and positioning it to compete more directly with Walmart.
Target also demonstrates a notable uptick in loyal visitors, with its share of frequent shoppers visiting at least three times a month rising from 20.1% to 23.6% between 2019 and 2025. This growth may suggest that its strategic initiatives – like the popular Drive Up service, same-day delivery options, and an appealing mix of essentials and exclusive brands – are successfully converting some casual shoppers into repeat customers.
Costco stands out for a different reason: while overall visits increased, loyalty rates remained essentially unchanged. This speaks to Costco’s unique position as a membership-based outlet for targeted bulk and premium-value purchases, where the shopping behavior of new visitors tends to follow the same patterns as those of its already-loyal core. As a result, trip frequency – rooted largely in planned stock-ups – remains remarkably consistent even as the warehouse giant grows foot traffic overall.
Dollar Tree currently has the smallest share of repeat visitors but is improving this metric. As it successfully encourages more frequent trips and narrows the loyalty gap with its larger rivals, it's poised to become an increasing source of competition for both Target and Costco.
The increase in repeat visits and cross-shopping across the five retail giants showcases consumers' current appetite for value-oriented mass merchants and discount chains. And although the retail giants landscape may be more fragmented, the data also reveals that the pie itself has grown significantly – so the increased competition does not necessarily need to come at the expense of legacy retail giants.
The retail landscape of 2025 demands a fundamental shift from zero-sum competition to strategic complementarity, where success lies in owning specific shopping missions rather than fighting for total market dominance. Retailers that forego attempting to compete on every front and instead clearly communicate their mission-specific value propositions – whether that's emergency runs, bulk essentials, or family shopping experiences – may come out on top.

1. Market Divergence: While San Francisco's return-to-office trends have stabilized, Los Angeles is increasingly lagging behind national averages with office visits down 46.6% compared to pre-pandemic levels as of June 2025.
2. Commuter Pattern Shifts: Los Angeles faces a persistent decline in out-of-market commuters while San Francisco's share of out-of-market commuters has recovered slightly, indicating deeper structural challenges in LA's office market recovery.
3. Visit vs. Visitor Gap: Unlike other markets where increased visits per worker offset declining visitor numbers, Los Angeles saw both metrics decline year-over-year, suggesting fundamental workforce retention issues.
4. Century City Exception: Century City emerges as LA's strongest office submarket with visits only 28.1% below pre-pandemic levels, driven by its premium amenities and strategic location adjacent to Westfield Century City shopping center.
5. Demographic Advantage: Century City's success may stem from its success in attracting affluent, educated young professionals who value lifestyle integration and are more likely to maintain consistent office attendance in hybrid work arrangements.
While return-to-office trends have stabilized in many markets nationwide, Los Angeles and San Francisco face unique challenges that set them apart from national patterns. This report examines the divergent trajectories of these two major West Coast markets, with particular focus on Los Angeles' ongoing struggles and the emergence of one specific submarket that bucks broader trends.
Through analysis of commuter patterns, demographic shifts, and localized performance data, we explore how factors ranging from out-of-market workforce changes to amenity-driven location advantages are reshaping the competitive landscape for office real estate in Southern California.
Both Los Angeles and San Francisco continue to significantly underperform the national office occupancy average. In June 2025, average nationwide visits to office buildings were 30.5% below January 2019 levels, compared to a 46.6% and 46.4% decline in visits to Los Angeles and San Francisco offices, respectively.
While both cities now show similar RTO rates, they arrived there through different trajectories. San Francisco has consistently lagged behind national return-to-office levels since pandemic restrictions first lifted.
Los Angeles, however, initially mirrored nationwide trends before its office market began diverging and falling behind around mid-2022.
The decline in office visits in Los Angeles and San Francisco can be partly attributed to fewer out-of-market commuters. Both cities saw significant drops in the percentage of employees who live outside the city but commute to work between H1 2019 and H1 2023.
However, here too, the two cities diverged in recent years: San Francisco's share of out-of-market commuters relative to local employees rebounded between 2023 and 2024, while Los Angeles' continued to decline – another indication that LA's RTO is decelerating as San Francisco stabilizes.
Like in other markets, Los Angeles saw a larger drop in office visits than in office visitors when comparing current trends to pre-pandemic levels. This is consistent with the shift to hybrid work arrangements, where many of the workers who returned to the office are coming in less frequently than before the pandemic, leading to a larger drop in visits compared to the drop in visitors.
But looking at the trajectory of RTO more recently shows that in most markets – including San Francisco – office visits are up year-over-year (YoY) while visitor numbers are down. This suggests that the workers slated to return to the office have already done so, and increasing the numbers of visits per visitor is now the path towards increased office occupancy.
In Los Angeles, visits also outperformed visitors – but both figures were down YoY (the gap in visits was smaller than the gap in visitors). So while the visitors who did head to the office in LA in Q2 2025 clocked in more visits per person compared to Q2 2024, the increase in visits per visitor was not enough to offset the decline in office visitors.
While Los Angeles may be lagging in terms of its overall office recovery, the city does have pockets of strength – most notably Century City. In Q2 2025, the number of inbound commuters visiting the neighborhood was just 24.7% lower than it was in Q2 2019 and higher (+1.0%) than last year's levels.
According to Colliers' Q2 2025 report, Century City accounts for 27% of year-to-date leasing activity in West Los Angeles – more than double any other submarket – and commands the highest asking rental rates. The area benefits from Trophy and Class A office towers that may create a flight-to-quality dynamic where tenants migrate from urban core locations to this Westside submarket.
The submarket's success is likely bolstered by its strategic location adjacent to Westfield Century City shopping center – visit data reveals that 45% of weekday commuters to Century City also visited Westfield Century City during Q2 2025. The convenience of accessing the mall's extensive retail, dining, and entertainment options during lunch breaks or after work may encourage employees to come into the office more frequently.
Perhaps thanks to its strategic locations and amenities-rich office buildings, Century City succeeds in attracting relatively affluent office workers.
Century City's office submarket has a higher median trade area household income (HHI) than either mid-Wilshire or Downtown LA. The neighborhood also attracts significant shares of the "Educated Urbanite" Spatial.ai: PersonaLive segment – defined as "well educated young singles living in dense urban areas working relatively high paying jobs".
This demographic typically has fewer family obligations and greater flexibility in their work arrangements, making them more likely to embrace hybrid schedules that include regular office attendance. Affluent singles also tend to value the lifestyle amenities and networking opportunities that come with working in a premium office environment like Century City: This demographic is often in career-building phases where in-person collaboration and visibility matter more, driving consistent office utilization that helps sustain the submarket's performance even as other LA office areas struggle with lower occupancy rates.
The higher disposable income of this audience also aligns well with the submarket's upscale retail and dining options at nearby Westfield Century City, creating a mutually reinforcing ecosystem where the office environment and surrounding amenities cater to their preferences.
As the broader Los Angeles market grapples with a shrinking commuter base and declining office utilization, the performance gap between premium, amenity-rich locations and traditional office districts is likely to widen. For investors and tenants alike, these trends underscore the growing importance of location quality, demographic targeting, and lifestyle integration in determining long-term office market viability across Southern California.
Century City's success – anchored by its affluent, career-focused workforce and integrated lifestyle amenities – can offer a blueprint for office market resilience in the hybrid work era.

1. Appetite for offline retail & dining is stronger than ever. Both retail and dining visits were higher in H1 2025 than they were pre-pandemic.
2. Consumers are willing to go the extra mile for the perfect product or brand. The era of one-stop-shops may be waning, as many consumers now prefer to visit multiple chains or stores to score the perfect product match for every item on their shopping list.
3. Value – and value perception – gives chains a clear advantage. Value-oriented retail and dining segments have seen their visits skyrocket since the pandemic.
4. Consumer behavior has bifurcated toward budget and premium options. This trend is driving strength at the ends of the spectrum while putting pressure on many middle-market players.
5. The out-of-home entertainment landscape has been fundamentally altered. Eatertainment and museums have stabilized at a different set point than pre-COVID, while movie theater traffic trends are now characterized by box-office-driven volatility.
6. Hybrid work permanently reshaped office utilization. Visits to office buildings nationwide are still 33.3% below 2019 levels, despite RTO efforts.
The first half of 2025 marked five years since the onset of the pandemic – an event that continues to impact retail, dining, entertainment, and office visitation trends today.
This report analyzes visitation patterns in the first half of 2025 compared to H1 2019 and H1 2024 to identify some of the lasting shifts in consumer behavior over the past five years. What is driving consumers to stores and dining venues? Which categories are stabilizing at a higher visit point? Where have the traffic declines stalled? And which segments are still in flux? Read the report to find out.
In the first half of 2025, visits to both the retail and dining segments were consistently higher than they were in 2019. In both the dining and the retail space, the increases compared to pre-COVID were probably driven by significant expansions from major players, including Costco, Chick-fil-A, Raising Cane's, and Dutch Bros, which offset the numerous retail and dining closures of recent years.
The overall increase in visits indicates that, despite the ubiquity of online marketplaces and delivery services, consumer appetite for offline retail and dining remains strong – whether to browse in store, eat on-premises, collect a BOPIS order, or pick up takeaway.
A closer look at the chart above also reveals that, while both retail and dining visits have exceeded pre-pandemic levels, retail visit growth has slightly outpaced the dining traffic increase.
The larger volume of retail visits could be due to a shift in consumer behavior – from favoring convenience to prioritizing the perfect product match and exhibiting a willingness to visit multiple chains to benefit from each store's signature offering. Indeed, zooming into the superstore and grocery sector shows an increase in cross-shopping since COVID, with a larger share of visitors to major grocery chains regularly visiting superstores and wholesale clubs. It seems, then, that many consumers are no longer looking for a one-stop-shop where they can buy everything at once. Instead, shoppers may be heading to the grocery stores for some things, the dollar store for other items, and the wholesale club for a third set of products.
This trend also explains the success of limited assortment grocers in recent years – shoppers are willing to visit these stores to pick up their favorite snack or a particularly cheap store-branded basic, knowing that this will be just one of several stops on their grocery run.
Diving into the traffic data by retail category reveals that much of the growth in retail visits since COVID can be attributed to the surge in visits to value-oriented categories, such as discount & dollar stores, value grocery stores, and off-price apparel. This period has been defined by an endless array of economic obstacles like inflation, recession concerns, gas price spikes, and tariffs that all trigger an orientation to value. The shift also speaks to an ability of these categories to capitalize on swings – consumers who visited value-oriented retailers to cut costs in the short term likely continued visiting those chains even after their economic situation stabilized.
Some of the visit increases are due to the aggressive expansion strategies of leaders in those categories – including Dollar General and Dollar Tree, Aldi, and all the off-price leaders. But the dramatic increase in traffic – around 30% for all three categories since H1 2019 – also highlights the strong appetite for value-oriented offerings among today's consumers. And zooming into YoY trends shows that the visit growth is still ongoing, indicating that the demand for value has not yet reached a ceiling.
While affordable pricing has clearly driven success for value retailers, offering low prices isn't a guaranteed path to growth. Although traffic to beauty and wellness chains remains significantly higher than in 2019, this growth has now plateaued – even top performers like Ulta saw slight YoY declines following their post-pandemic surge – despite the relatively affordable price points found at these chains.
Some of the beauty visit declines likely stems from consumers cutting discretionary spending – but off-price apparel's ongoing success in the same non-essential category suggests budget constraints aren't the full story. Instead, the plateauing of beauty and drugstore visits while off-price apparel visits boom may be due to the difference in value perception: Off-price retailers are inherently associated with savings, while drugstores and beauty retailers, despite carrying affordable items, lack that same value-driven brand positioning. This may suggest that in today's market, perceived value matters as much as actual affordability.
Another indicator of the importance of value perception is the decline in visits to chains selling bigger-ticket items – both home furnishing chains and electronic stores saw double-digit drops in traffic since H1 2019.
And looking at YoY trends shows that visits here have stabilized – like in the beauty and drugstore categories – suggesting that these sectors have reached a new baseline that reflects permanently shifted consumer priorities around discretionary spending.
A major post-pandemic consumer trend has been the bifurcation of consumer spending – with high-end chains and discount retailers thriving while the middle falls behind. This trend is particularly evident in the apparel space – although off-price visits have taken off since 2019 (as illustrated in the earlier graph) overall apparel traffic declined dramatically – while luxury apparel traffic is 7.6% higher than in 2019.
Dining traffic trends also illustrate this shift: Categories that typically offer lower price points such as QSR, fast casual, and coffee have expanded significantly since 2019, as has the upscale & fine dining segment. But casual dining – which includes classic full-service chains such as Red Lobster, Applebee's, and TGI Fridays – has seen its footprint shrink in recent years as consumers trade down to lower-priced options or visit higher-end venues for special occasions.
Chili's has been a major exception to the casual dining downturn, largely driven by the chain's success in cementing its value-perception among consumers – suggesting that casual dining chains can still shine in the current climate by positioning themselves as leaders in value.
Consumers' current value orientation seems to be having an impact beyond the retail and dining space: When budgets are tight, spending money in one place means having less money to spend in another – and recent data suggests that the consumer resilience in retail and dining may be coming at the expense of travel – or perhaps experiences more generally.
While airport visits from domestic travelers were up compared to pre-COVID, diving into the data reveals that the growth is mostly driven by frequent travelers visiting airports two or more times in a month. Meanwhile, the number of more casual travelers – those visiting airports no more than once a month – is lower than it was in 2019.
This may suggest that – despite consumers' self-reported preferences for "memorable, shareable moments" – at least some Americans are actually de-prioritizing experiences in the first half of 2025, and choosing instead to spend their budgets in retail and dining venues.
The out of home entertainment landscape has also undergone a significant change since COVID – and the sector seems to have settled into a new equilibrium, though for part of the sector, the equilibrium is marked by consistent volatility.
Eatertainment chains – led by significant expansions from venues like Top Golf – saw a 5.5% visit increase compared to pre-pandemic levels, though YoY growth remained modest at 1.1%. On the other hand, H1 2025 museum traffic fell 10.9% below 2019 levels with flat YoY performance (+0.2%). The minimal year-over-year changes in both categories suggest that these entertainment segments have found their new post-COVID equilibrium.
The rise of eatertainment alongside the drop in museum visits may also reflect the intense focus on value for today's consumers. Museums in 2025 offer essentially the same value proposition that they offered in 2019 – and for some, that value proposition may no longer justify the entrance fee. But eatertainment has gained popularity in recent years as a format that offers consumers more bang for their buck relative to stand-alone dining or entertainment venues – which makes it the perfect candidate for success in today's value-driven consumer landscape.
But movie theaters traffic trends are still evolving – even accounting for venue closures, visits in H1 2025 were well below H1 2019 levels. But compared to 2024, movie traffic was also up – buoyed by the release of several blockbusters that drove audiences back to cinemas in the first half of 2025. So while the segment is still far from its pre-COVID baseline, movie theaters retain the potential for significant traffic spikes when compelling content drives consumer demand.
The blockbuster-driven YoY increase can perhaps also be linked to consumers' spending caution. With budgets tight, movie-goers may want to make sure that they're spending time and money on films they are sure to enjoy – taking fewer risks than they did in 2019, when movie tickets and concession prices were lower and consumers were less budget-conscious.
H1 2025 also brought some moderate good news on the return to office (RTO) front, with YoY visits nationwide up 2.1% and most offices seeing YoY office visit increases – perhaps due to the plethora of RTO mandates from major companies. But comparing office visitation levels to pre pandemic levels highlights the way left to go – nationwide visits were 33.3% below H1 2019 levels in H1 2025, with even RTO leaders New York and Miami still seeing 11.9% and 16.1% visit gaps, respectively.
So while the data suggests that the office recovery story is still being written – with visits inching up slowly – the substantial gap from pre-pandemic levels suggests that remote and hybrid work models have fundamentally reshaped office utilization patterns.
Five years post-pandemic, consumer behavior across the retail, dining, entertainment, and office spaces has crystallized into distinct new patterns.
Traffic to retail and dining venues now surpasses pre-pandemic levels, driven primarily by value-focused segments. But retail and dining segments that cater to higher income consumers –such as luxury apparel and fine dining – have also stabilized at a higher level, highlighting the bifurcation of consumer behavior that has emerged in recent years. Entertainment formats show more variability – while eatertainment traffic has settled above and museums below 2019 levels, and movie theaters still seeking stability. Office spaces remain the laggard, with visits well below pre-pandemic levels despite corporate return-to-office initiatives showing modest impact.
It seems, then, that the new consumer landscape rewards businesses that can clearly articulate their value proposition to attract consumers' increasingly selective spending and time allocation – or offer a premium product or experience catering to higher-income audiences.