

.svg)


Thank you! Your submission has been received!
Oops! Something went wrong while submitting the form.
0
0
0
0
----------
0
0
Articles
Article
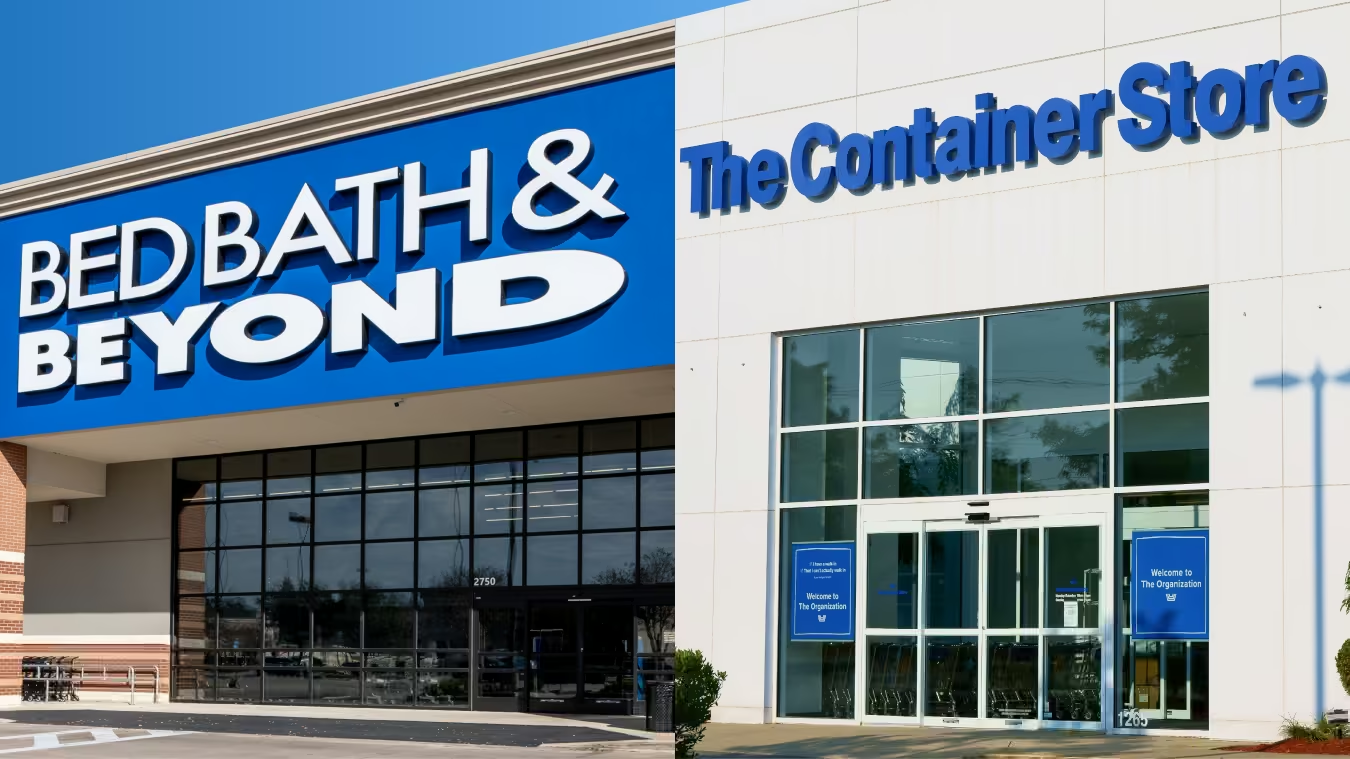
Can Bed Bath & Beyond Make A Comeback? Bed Bath & Beyond is returning to stores through Kirkland's and The Container Store. Here's what foot traffic data reveals about its comeback strategy.
Shira Petrack
Jul 6, 2026
5 minutes
Article
Can Endless Shrimp Fuel Red Lobster's Recovery?Red Lobster's weekly per-location visits swung from -8.7% to +24.3% YoY after Endless Shrimp returned April 20, 2026, holding double-digit gains into June.
Lila Margalit
Jul 2, 2026
.avif)
Article
Anchored Ep 7: The Data-Driven Customer EracubeiQ's Zora Sentat on first-party data, retail media's untapped potential, and why human expertise still matters in an automated world.
Rebecca Bleier
Jul 1, 2026
2 minutes
Article
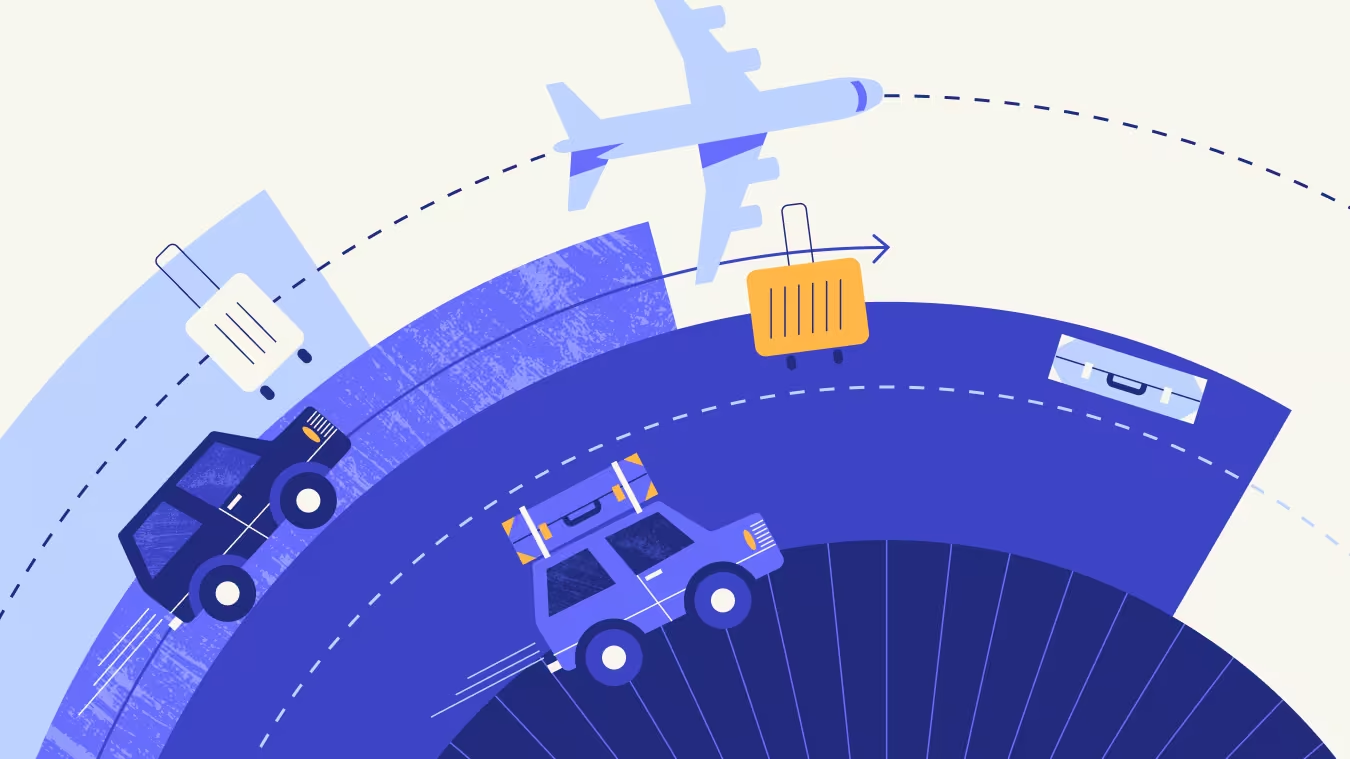
Summer 2026 Travel: A K-Shaped Memorial Day KickoffMemorial Day weekend visits signal a K-shaped summer: gas station stops fell 6.8% YoY and economy hotels declined while airports and luxury held relatively steady.
Lila Margalit
Jun 30, 2026
3 minutes
.avif)
Article
Best Buy's Creative Playbook for Monetizing Its FootprintExplore how Best Buy (NYSE: BBY) is monetizing its footprint through IKEA shop-in-shops, retail media innovation, and targeted sports activations.
Lila Margalit
Jun 29, 2026
3 minutes
Article
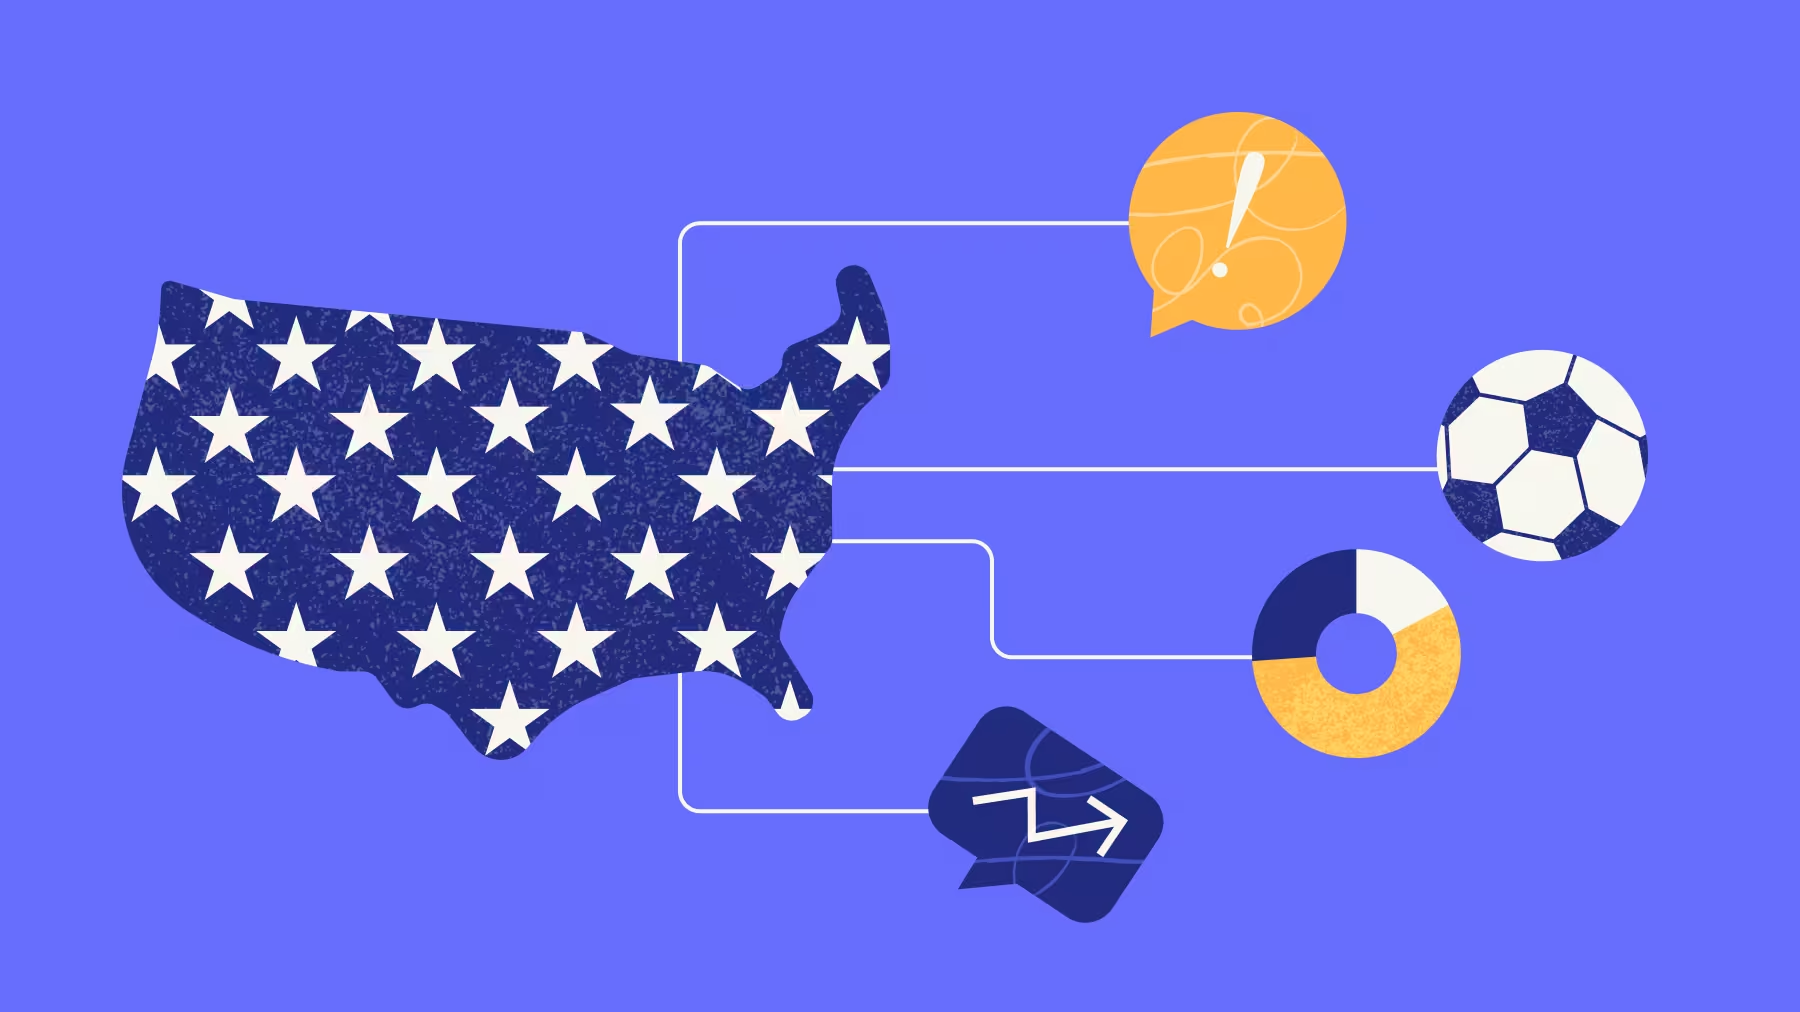
Who Showed Up for The World Cup U.S. Opener in Los Angeles?See who attended the 2026 FIFA World Cup U.S. opener in Los Angeles, how stadium and festival audiences differed, and the impact on nearby businesses.
Ezra Carmel
Jun 26, 2026
3 minutes
Reports
INSIDER
Los Angeles Office Trends in 2024Discover the state of office recovery in the Los Angeles metro area – and explore key trends shaping the return to office in some of LA's major business districts.
July 7, 2024
6 minutes

INSIDER
Advantages of New Players in the Retail Media SpaceDiscover the unique brick-and-mortar advertising potential of Costco's and Wawa's new retail media networks - and how advertisers can best leverage this opportunity.
June 27, 2024

INSIDER
Brewing Success: Winning Strategies for Coffee ChainsDive into the data to explore foot traffic trends in the coffee space – and uncover factors driving visits to Starbucks, Dunkin’, and other leading chains.
June 20, 2024
Loading results...
We couldn't find anything matching your search.
Browse one of our topic pages to help find what you're looking for.
For more in-depth analyses on a variety of subjects, explore Reports.
For more in-depth analyses on a variety of subjects, explore Reports.

INSIDER
Stay Anchored: Subscribe to Insider & Unlock more Foot Traffic Insights
Gain insider insights with our in-depth analytics crafted by industry experts
— giving you the knowledge and edge to stay ahead.

