Skip to Main Content
Thank you! Your submission has been received!
Oops! Something went wrong while submitting the form.
0
0
0
0
----------
0
0
Articles
Article
Placer.ai June 2026 Mall Index: Momentum Heading Into H2 2026
Shira Petrack
Jul 8, 2026

Foot Traffic Trends Point to Continued Strength

June marked the third consecutive month of year-over-year (YoY) visit growth across all three mall formats, and AI-powered audience analysis suggests these gains are coming from an increasingly diverse customer base. We dove into the foot traffic data to see what's driving mall performance heading into the second half of the year.

Visit Growth Across the Board

Visits to indoor malls, open-air shopping centers, and outlet malls all remained in positive YoY territory in June 2026, with indoor mall visits up 1.2%, open-air shopping center visits up 5.1%, and outlet mall visits up 1.0% compared to June 2025.

June's performance caps a strong first half of the year. Aside from a March dip, likely driven in part by calendar shifts and by the initial gas price shock, every month of 2026 has seen visit growth across all three formats – though open-air shopping centers continue to set the pace. The format has posted the strongest YoY visit growth every month this year and has hovered above 5.0% growth in both May and June, highlighting the enduring appeal of outdoor, convenience-driven retail as the weather warms up.

A Broader Customer Base

Analyzing malls' captured market audience makes the outlook for malls even more compelling heading into H2 2026. Much of the recent retail narrative has centered on a bifurcated consumer, with spending growth concentrated among higher-income households while more value-conscious consumers pull back. Mall audience data, however, suggests a different dynamic.

Across all three mall formats, the median household income (HHI) of the captured market declined modestly between June 2025 and June 2026. Combined with rising visit volumes, this suggests that malls are broadening their appeal and attracting a wider range of consumers, including more value-conscious shoppers – suggesting that malls are expanding their customer base rather than relying more heavily on affluent shoppers.The category's combination of retail, dining, entertainment, and one-stop convenience may be helping malls resonate with a broader audience in an environment where consumers remain selective about discretionary spending. 

Momentum Going Into H2 2026

With all three formats posting YoY visit growth and audiences broadening, malls enter the back half of 2026 with real momentum. As retailers and mall operators plan for the critical back-to-school and holiday seasons, the challenge will be converting this wider, more diverse audience into loyal, repeat visitors.

For more data-driven retail insights, visit placer.ai/anchor.

Article
What Prime Week 2026 Reveals About Today's Shopper
Shira Petrack
Jul 7, 2026
3 minutes

Prime Week as a Consumer Barometer

Consumers are entering the back half of 2026 under real pressure. The University of Michigan's consumer sentiment index registered 49.5 in June, the second-lowest reading in records going back to the 1970s and nearly 20% below where it sat a year earlier. According to Deloitte, roughly four in 10 Americans now exhibit deal-driven, cost-conscious habits, and close to seven in 10 retail executives view value-seeking as a structural change rather than a temporary one.

So when Amazon's Prime event ran June 23rd to 26th, alongside overlapping promotions from Walmart, Target, Best Buy, and Kohl's, the week became more than a battle for retail traffic. It became a barometer. Who shows up when the deals land, when they show up, and where they steer their trips offers a real-time read on how a pressured, deliberate consumer is actually behaving. We analyzed foot traffic across the four major chains to find out.

A Pressured Consumer Still Shows Up for a Deal

Measured against each retailer's year-to-date day-of-week average, the four major retailers analyzed all saw visits climb during Prime Week. Best Buy and Kohl's led the pack on opening day, with visits running 18.1% and 18.4% above their respective baselines on June 23. Target wasn't far behind at 16.3%, while Walmart posted a steadier 4.7% increase. And all four chains continued seeing visit gains throughout the analyzed period. 

A lift across all four chains, not just Amazon's direct competitors in one category, suggests a consumer who is responsive and cross-shopping. When promotions appear, the value-seeker turns out, and they spread those trips across whichever retailers are running deals.

Best Buy Saw the Clearest Event-Driven Lift

Isolating the event from seasonality sharpens the picture. Comparing daily visits to the prior five weeks' day-of-week average controls for longer-term trends, which matters this year because Prime Day shifted to late June, much closer to Memorial Day and Father's Day than usual and against a higher recent traffic baseline. Even on that tougher benchmark, Best Buy stood out, with visits up 12.3% on June 23 and holding double digits through Thursday. Target saw a meaningful early-week lift, while Walmart sat just below its recent baseline and Kohl's slipped to -3.9% by Friday.

Best Buy's strength against recent weeks carries the most useful read on the consumer. Electronics are big-ticket and discretionary, the kind of spending a pressured shopper might be expected to defer. But the event-driven lift suggests that consumers have not stopped making sizable purchases –  they have just made them event-dependent. 

Target and Kohl's Came Out Ahead Year-over-Year

But stacking 2026 against the comparable 2025 Prime Week (July 8th to 11th) adds another layer to the story. Target was the standout performer here, with visits up 10.3% year-over-year (YoY) on opening day and gains every single day of the event. Kohl's also outpaced last year through most of the week, while Walmart held modestly positive ground throughout.

Best Buy tells the most complex story. Even as it posted the strongest event-driven lift relative to recent weeks, its visits ran 2% to 5% below last year's Prime Week – a reminder that a strong showing against a recent baseline doesn't always translate to year-over-year growth. These YoY declines suggest that while compelling promotions can still draw shoppers into stores, they have not fully offset softer demand for discretionary electronics.

Prime Week's Offline Opportunity

Analyzing offline traffic to major retailers during Prime Day 2026 suggests that, although sentiment may be near record lows and value-seeking may now be a fixed habit, the appetite to spend is still there – although it has become more deliberate.

For more data-driven retail insights, visit placer.ai/anchor 

Article
Can Bed Bath & Beyond Make A Comeback?
Bed Bath & Beyond is returning to stores through Kirkland's and The Container Store. Here's what foot traffic data reveals about its comeback strategy.
Shira Petrack
Jul 6, 2026
5 minutes

A Different Bed Bath & Beyond Returns 

Bed Bath & Beyond returned to physical retail in August 2025, when the first store to carry the name since the chain's 2023 liquidation opened in Brentwood, Tennessee. The format signaled how much the strategy had changed. At roughly 15,000 square feet, in a former Kirkland's, the location is a fraction of the 25,000-to-50,000-square-foot stores the brand operated before bankruptcy, reflecting a deliberate move toward smaller, neighborhood-format stores.

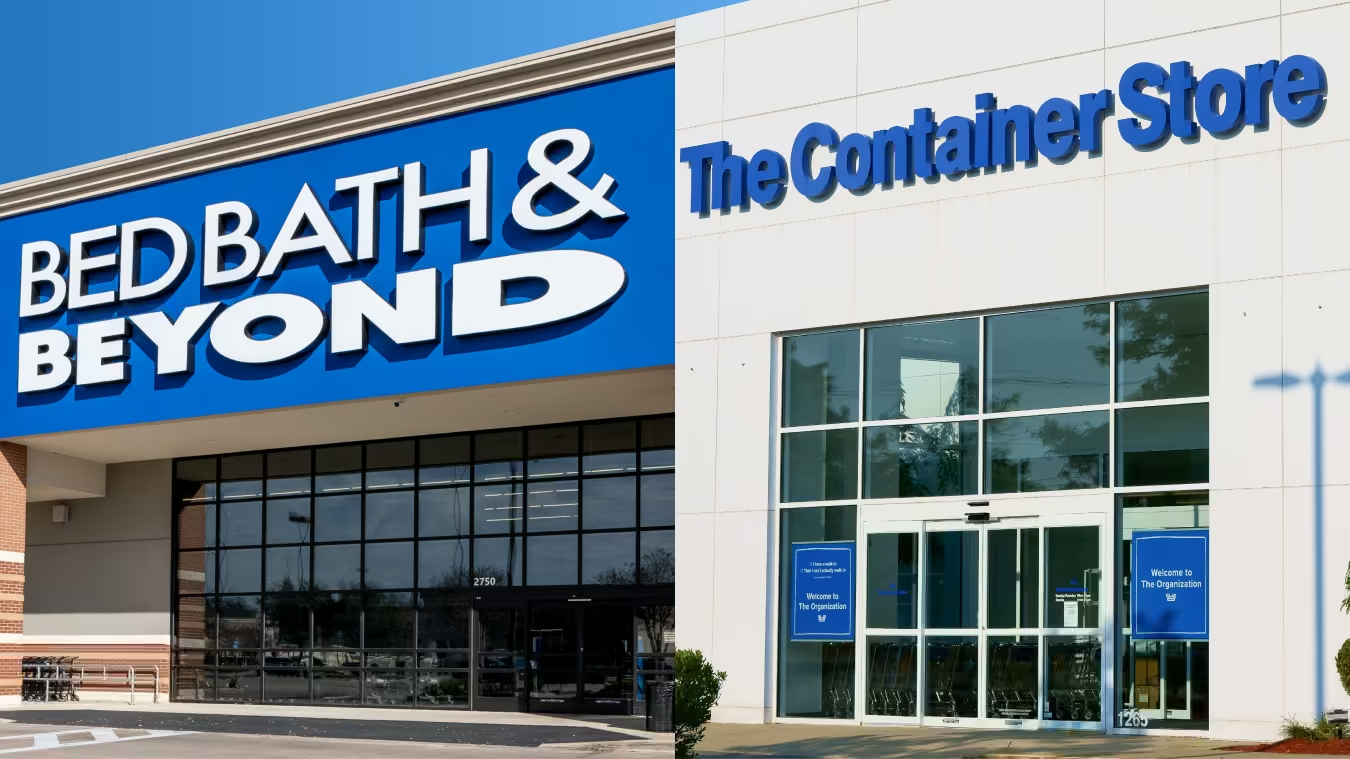
The format shift is just one element of a broader restructuring. The name now belongs to Beyond Inc. – since renamed Bed Bath & Beyond Inc. – which is reviving the legacy brand through two distinct acquisitions. The company is acquiring Kirkland's, the home-decor chain, and converting select stores into small-format Bed Bath & Beyond Home locations, and has also agreed to acquire The Container Store and co-brand its stores as "The Container Store / Bed Bath & Beyond."

But in a category that increasingly rewards discounters and sharply differentiated retailers, is there still room for a brand like Bed Bath & Beyond, and in what form?

Before Bankruptcy, Bed Bath & Beyond Led the Offline Home Furnishing Space – But the Category Has Changed 

It is easy to forget how dominant Bed Bath & Beyond once was. In 2019, already past its heyday, it still captured the single largest share of visits to home furnishing retailers in the country, acting as the broad, generalist default for the category.

A lot has changed since. Visits to brick-and-mortar home furnishing retailers fell roughly 27% from 2019 to 2025, and within that smaller pie the leaderboard reshuffled around Bed Bath & Beyond's absence. HomeGoods now sits at the front, reflecting where the category's momentum has gone – toward off-price and sharply differentiated retailers. At the same time, no single full-price, national retailer moved into the position Bed Bath & Beyond vacated, the broad home brand that shoppers across very different incomes and life stages defaulted to. 

That open role is the opening a revived Bed Bath & Beyond is built around. The brand is betting that what failed was the format – a massive store carrying an exhaustive, full-price assortment behind a coupon, which is a format that off-price now beats on price and that specialists beat on focus. But the recognition itself, a name a wide range of shoppers still associate with outfitting a home, has remained strong, and the comeback may work if it claims the role without rebuilding the format. That is what the unusual structure is designed to do.

Bed Bath & Beyond, Former Home Furnishing Leader, Returns to a Changed Market

Share of Total Home Furnishing Visits by Chain — the 20 Largest Plus All Others — 2019 vs. 2025

Bed Bath & Beyond: 23.7%Bed Bath & Beyond — 23.7%HomeGoods: 19.3%HomeGoods — 19.3%IKEA: 11.5%IKEA — 11.5%At Home: 7.5%At Home — 7.5%World Market: 5.3%World Market — 5.3%Ashley: 4.4%Ashley — 4.4%Kirkland's: 4.0%Kirkland's — 4.0%Christmas Tree Shops: 3.7%Christmas Tree Shops — 3.7%The Container Store: 1.8%The Container Store — 1.8%Rooms To Go Furniture Store: 1.7%Rooms To Go Furniture Store — 1.7%Bob's Discount Furniture: 1.4%Bob's Discount Furniture — 1.4%Pottery Barn: 1.1%Pottery Barn — 1.1%Crate and Barrel: 1.0%Crate and Barrel — 1.0%Old Time Pottery: 1.0%Old Time Pottery — 1.0%Conn's HomePlus: 1.0%Conn's HomePlus — 1.0%La-Z-Boy: 0.9%La-Z-Boy — 0.9%Value City Furniture: 0.8%Value City Furniture — 0.8%Raymour & Flanigan Furniture Store: 0.7%Raymour & Flanigan Furniture Store — 0.7%Homesense: 0.7%Homesense — 0.7%Living Spaces: 0.7%Living Spaces — 0.7%Other: 7.8%Other — 7.8%
2019
HomeGoods: 38.3%HomeGoods — 38.3%IKEA: 11.2%IKEA — 11.2%At Home: 10.5%At Home — 10.5%World Market: 7.2%World Market — 7.2%Ashley: 5.1%Ashley — 5.1%Kirkland's: 3.0%Kirkland's — 3.0%The Container Store: 1.6%The Container Store — 1.6%Rooms To Go Furniture Store: 1.8%Rooms To Go Furniture Store — 1.8%Bob's Discount Furniture: 2.7%Bob's Discount Furniture — 2.7%Pottery Barn: 1.2%Pottery Barn — 1.2%Crate and Barrel: 1.4%Crate and Barrel — 1.4%Old Time Pottery: 0.6%Old Time Pottery — 0.6%La-Z-Boy: 1.0%La-Z-Boy — 1.0%Value City Furniture: 0.9%Value City Furniture — 0.9%Raymour & Flanigan Furniture Store: 0.9%Raymour & Flanigan Furniture Store — 0.9%Homesense: 2.9%Homesense — 2.9%Living Spaces: 1.1%Living Spaces — 1.1%RH (Restoration Hardware): 0.8%RH (Restoration Hardware) — 0.8%Norwalk Furniture: 0.6%Norwalk Furniture — 0.6%Furniture Row: 0.5%Furniture Row — 0.5%Other: 6.8%Other — 6.8%
2025
Bed Bath & BeyondHomeGoodsIKEAAt HomeWorld MarketAshleyKirkland'sChristmas Tree ShopsThe Container StoreRooms To Go Furniture StoreBob's Discount FurniturePottery BarnCrate and BarrelOld Time PotteryConn's HomePlusLa-Z-BoyValue City FurnitureRaymour & Flanigan Furniture StoreHomesenseLiving SpacesRH (Restoration Hardware)Norwalk FurnitureFurniture RowOther

Circle area is proportional to each year's total visits, which fell about 27% from 2019 to 2025. Slices show each chain's share of all home furnishing visits; the 20 largest chains are shown individually and the remainder is grouped as "Other." Bed Bath & Beyond liquidated all its stores in 2023 (its small 2025 relaunch was too recent to register here); Christmas Tree Shops (2023) and Conn's HomePlus (2024) closed all locations and have not returned. Source: Placer.ai.

Share of total U.S. home furnishing visits by chain, 2019 vs. 2025.
Retailer2019 visit share2025 visit share
Bed Bath & Beyond23.7%0.0%
HomeGoods19.3%38.3%
IKEA11.5%11.2%
At Home7.5%10.5%
World Market5.3%7.2%
Ashley4.4%5.1%
Kirkland's4.0%3.0%
Christmas Tree Shops3.7%0.0%
The Container Store1.8%1.6%
Rooms To Go Furniture Store1.7%1.8%
Bob's Discount Furniture1.4%2.7%
Pottery Barn1.1%1.2%
Crate and Barrel1.0%1.4%
Old Time Pottery1.0%0.6%
Conn's HomePlus1.0%0.0%
La-Z-Boy0.9%1.0%
Value City Furniture0.8%0.9%
Raymour & Flanigan Furniture Store0.7%0.9%
Homesense0.7%2.9%
Living Spaces0.7%1.1%
RH (Restoration Hardware)0.0%0.8%
Norwalk Furniture0.0%0.6%
Furniture Row0.0%0.5%
Other7.8%6.8%

An Unconventional Path to an Offline Comeback

Rather than reopen its own stores, Bed Bath & Beyond is returning through two retailers it is absorbing, both of which have been losing visits year over year. The declines are not one shared problem but two different ones, and the logic of the comeback is that the Bed Bath & Beyond name addresses each.

The Container Store's difficulty is frequency, with a business organized around storage and home organization – a category shoppers turn to only in occasional project bursts, and affluent customers likely have few reasons to come back between closet overhauls and moves. Co-branding the stores as Bed Bath & Beyond is meant to widen that reason to visit, folding in the everyday kitchen, bath, and bedding categories the name is known for, and lifting trip frequency without pushing away the premium shopper the chain already has.

Meanwhile, Kirkland's is a broad home-and-decor generalist without a sharp identity, sitting in the same exposed middle that off-price and specialists have been pulling apart – its stores draw a mainstream suburban shopper but offer little specific reason to choose them. Converting them to Bed Bath & Beyond Home is meant to supply that reason, a more recognized name with broader pull than the Kirkland's banner generated on its own. 

More Than a Sum of Their Parts 

Beyond improving the assortment, Bed Bath & Beyond can also boost traffic to converted Kirkland stores and co-branded The Container Stores by bringing in an audience that each chain lacks. 

The Container Store draws a narrow, premium audience organized around storage and home organization, while Kirkland's draws a broader, more middle-income suburban shopper for general home goods and decor. Analysing each chain's trade area composition as well as Bed Bath & Beyond's 2019 audience suggests that Bed Bath & Beyond can help each one reach the half of the market it currently misses: In its last pre-COVID year, Bed Bath & Beyond over-indexed both among the premium households The Container Store already draws and among the mainstream suburban families that have long anchored Kirkland's.

And for Bed Bath & Beyond, the arrangement supplies two store networks aimed at different shoppers, one more affluent, one more mainstream, reached through a single name both still recognize.

From Recognition to Retention 

At the same time, the challenges should not be understated. A recognized name is the beginning of a value proposition rather than a substitute for one, and the proposition the brand carried into bankruptcy, an exhaustive assortment paired with a coupon, is the one that ultimately failed. 

But two years after the chain closed, many consumers still think of Bed Bath & Beyond as a destination for home essentials, the kind of store associated with furnishing a first apartment, outfitting a dorm, or building a wedding registry. And familiarity has proven effective at generating first visits, as a range of revived retailers from Abercrombie to Polaroid suggests, but converting those visits into a habit is a separate question. Whether shoppers return will depend less on the name above the door than on what the reformatted stores actually offer.

For more data-driven insights, visit placer.ai/anchor 

Article
Can Endless Shrimp Fuel Red Lobster's Recovery?
Lila Margalit
Jul 2, 2026

Betting on Shrimp

When Red Lobster filed for bankruptcy in May 2024, much of the blame landed on a single menu item: a $20 Ultimate Endless Shrimp deal that proved far too popular for its own margins. The chain shuttered roughly 130 locations, was acquired by Fortress Investment Group, and brought in a new CEO to steady the brand.

So the decision to bring Endless Shrimp back in spring 2026 – this time as a limited-run promotion – wasn't an obvious one. We dove into the data to see how the relaunch is landing, and what it would take for Red Lobster's comeback to hold.

A Strong Traffic Rebound

In the weeks before the Endless Shrimp relaunch, the average number of visits to each Red Lobster location was running below year-ago levels – down by as much as 8.7% year over year (YoY) the week of April 13, and lagging the broader full-service restaurant segment.

Then came April 20. During the first full week of the Ultimate Endless Shrimp promotion, Red Lobster's per-location visits flipped sharply positive and have stayed there since, peaking at 24.3% YoY the week of April 27 and holding double-digit gains into early June – though the magnitude of the boost has gently eased over time. Notably, this outperformance came while full-service restaurant traffic remained roughly flat YoY.

Red Lobster’s Per-Location Visits Surge on Endless Shrimp — Even as It Closes Stores

YoY Change in Weekly Average Visits per Location, Red Lobster vs. Full-Service Restaurants, March–June 2026

Beyond The Promotion

The traffic surge suggests that Red Lobster's brand equity remains strong. Even after bankruptcy, store closures, and years of operational challenges, the chain was able to generate a meaningful visitation lift by bringing back one of its most recognizable promotions.

But Endless Shrimp can only do so much – and the pressures facing the chain, from elevated seafood costs to a burdensome lease portfolio, will remain even after the promotion inevitably ends. As the company continues to rightsize and improve profitability, the key question is whether its investments in menu innovation and customer experience will be enough to garner lasting customer loyalty. Will Endless Shrimp have a better ending this time around? 

Visit Placer.ai/anchor to find out.

Article
Anchored Ep 7: The Data-Driven Customer Era
cubeiQ's Zora Sentat on first-party data, retail media's untapped potential, and why human expertise still matters in an automated world.
Rebecca Bleier
Jul 1, 2026
2 minutes

Anchored Ep 7: The Data-Driven Customer Era

Zora Sentat has spent her career at the intersection of data, marketing, and commerce. As Chief Commercial Officer at cubeiQ, she's seen how businesses are – and aren't – making the most of what they know about their customers.

In the latest episode of Anchored, Zora joined Ethan Chernofsky to discuss the state of the data landscape, where retail media is falling short, and why human expertise still matters in an increasingly automated world.

Here are 5 key takeaways from the conversation:

  1. First-party data is the foundation of the next competitive advantage. Businesses are starting to recognize that customer interactions generate proprietary behavioral data sets no third party can replicate. The next frontier is leveraging that data as a foundation for new revenue channels – including advertising strategies built around both endemic and non-endemic partners.
  2. Customer centricity breaks down when information stays siloed. The biggest barrier to acting on customer data is asymmetry. When insights sit only with the marketing team, the rest of the business can't act on them. Democratizing that information across departments is what separates companies that talk about customer centricity from those that actually execute it.
  3. Data quality is the real bottleneck for AI. AI can perform every core function across any application, but its outputs are only as good as the data feeding it. As AI adoption accelerates, the role of the data supplier becomes more critical – well-compiled, deterministic, and explainable data sets are what determine whether AI outputs are actually useful.
  4. Retail media’s growth opportunity is still up for grabs. The category has been discussed long enough that expectations have outpaced execution. The untapped opportunity lies with non-endemic advertisers – brands with no products on the shelf but strong reasons to reach a retailer's audience. Until networks expand beyond their own supplier base, a significant portion of available budgets will continue to go elsewhere.
  5. Human expertise remains a genuine differentiator as agentic platforms proliferate. The push toward self-serve and automated campaign management has created an opening for service-led businesses to stand out. Clients in complex, nuanced industries still want someone who truly understands their business – and that depth of institutional knowledge is difficult to replicate with automation alone.

Full episode out now on YouTube and Spotify

Article
Summer 2026 Travel: A K-Shaped Memorial Day Kickoff
Lila Margalit
Jun 30, 2026
3 minutes

Travel Season Begins

Memorial Day weekend is the unofficial start of summer – and this year it arrived amid mounting cost pressures. Gas prices were at their highest Memorial Day level since 2022, while domestic airfare had risen more than 20% year over year – although travelers who booked early were often able to secure better deals.

That makes the holiday weekend a useful bellwether for the summer season ahead. Which corners of the travel economy are thriving, and where are consumers pulling back as budgets tighten? We dove into the data to find out.

Fewer Stops at the Pump

Visits to gas stations and convenience stores - a reasonable proxy for how much Americans are driving – fell 7.0% YoY over the four-day Memorial Day weekend, measured from Friday through Monday. The decline pushed visits below their 2021 level for the first time since the pandemic-era baseline.

The drop is even more striking when viewed against the holiday's typical pattern. Over the past four years, Memorial Day weekend has consistently generated roughly 2% to 3% more traffic than a typical weekend, measured against the average of the preceding six Friday-to-Monday periods. This year, that premium disappeared. Instead, visits ran 3.1% below the recent norm, marking the first time in at least four years that the unofficial start of summer drew fewer fuel-and-snack stops than an ordinary weekend.

This suggests that forecasts of record-setting Memorial Day travel may have overstated the strength of road-trip demand as fuel costs surged. But another possible explanation is that Americans still traveled, just not as far – an interpretation supported by the decline in travel distances across most hotel tiers (see below). Surging fuel costs may also have nudged some travelers who had planned to drive toward air travel instead.

Americans Eased Off the Gas on Memorial Day Weekend

Nationwide Gas Station Visits, Memorial Day Weekend 2026 (Fri–Mon)

Year over Year vs. 2025 7.0%
vs. 2021 Baseline First year in series 5.1%
vs. Previous Weekends Avg. of prior six Fri–Mon 3.1%
🚗

Memorial Day weekend failed to lift gas-station traffic, with visits falling below even 2021’s pandemic-era levels.

Memorial Day Weekend Indexed to 2021

Memorial Day Weekend vs. Avg of Prior Six Friday-Mondays

Air Travel Holds Steadier

And indeed, airport visits by domestic travelers in the lead up to the holiday were comparatively resilient, slipping just 0.5% YoY on the Thursday and Friday before Memorial Day.

Compared to airports' prior six-week baseline, demand heading into the holiday weekend actually increased. Airport visits during the Thursday-Friday travel rush ran 9.7% above the average of the previous six weeks, up from 8.2% in 2025 and 7.1% in 2024. That resilience was likely driven, at least in part, by travelers who secured lower fares by booking well in advance. And because air travelers tend to skew more affluent than road trippers, those who did book later may have been more willing to absorb higher travel costs despite the sticker shock.

Airport Traffic Held Flat YoY, but Pre-Holiday Surge vs. Prior Weeks Kept Growing

Major Airport Visits During Lead-Up to Memorial Day Weekend (Thu–Fri)

Year-over-Year Change

2024 10.0%
2025 0.8%
2026 0.5%

Lift vs. Prior Six Thursday–Fridays

Although airport traffic remained flat YoY, the pre-holiday surge was more pronounced against a backdrop of softer recent demand, with visits running 9.7% above the prior six Thursday–Friday average.

A K-Shaped Check-In

Hotels, meanwhile, saw declines in domestic traveler visitation across all tiers as some travelers likely looked for ways to reduce lodging costs, whether by staying with friends and family, choosing lower-cost accommodations, or taking shorter trips.

But the pullback was far from uniform. Economy hotels took the hardest hit, with visits down 7.2% YoY – the steepest decline of any segment. Midscale, upper-midscale, and upscale properties landed in the middle, posting declines between 4.3% and 5.0%. At the top end of the market, the softness was more limited: Upper-upscale hotels slipped just 2.2%, while luxury hotels declined 2.7%.

The same K-shaped pattern showed up in how far guests were willing to travel. The share of hotel visitors coming from more than 100 miles away declined across nearly every tier – most sharply at the lower end of the market. Only luxury hotels saw their share of long-distance guests actually increase by 1.2 percentage points – showing that affluent domestic travelers were still traveling the distance. 

Luxury and Upper Upscale Hotels Proved Most Resilient Amid Industry-Wide Traffic Declines

Memorial Day Weekend (Fri–Mon): May 22–25 ’26 vs. May 23–26 ’25, U.S.

Hotel Visits, Year-over-Year Change

Economy7.2%
Midscale5.0%
Upper Midscale4.4%
Upscale4.3%
Upper Upscale2.2%
Luxury2.7%

Visits slipped across every hotel class, but the high end held up best – and luxury was the only segment to draw a larger share of guests from 100+ miles away.

Percentage Point Change* in Share of Visitors From 100+ Miles Away, 2026 vs. 2025

*A percentage-point change is the difference between the two years’ shares – e.g., Luxury rising from 51.3% to 52.5% is a 1.2-point gain.

A K-Shaped Summer Ahead?

The unofficial start of summer revealed a widening split in how Americans allocate their travel spending. Driving-related stops and budget hotels bore the brunt of the pullback, while air travel and higher-end lodging continued to hold steady.

Whether this divide narrows or widens will depend largely on the path of gas prices and consumer confidence. As fuel costs ease, will budget-conscious travelers return to the road in greater numbers? Will air travel rebound, and will hotel visitation follow?

For more data-driven consumer and travel insights, visit Placer.ai/anchor.

Reports
INSIDER
Specialty and Value Chains Transform Grocery in 2024
Specialty and value grocery chains have emerged as top performers in Q3 2024. What insights can location analytics provide about this trend? We dove into the data to find out.
November 7, 2024
8 minutes

Overview

The grocery industry has navigated unprecedented challenges in recent years – from pandemic-driven shifts in consumer behavior and supply chain disruptions to rising costs, labor shortages, and increased operational demands. In the face of these hurdles, the category has been pushed to innovate, adapting everything from product selections to shopping formats to meet changing consumer expectations.  

But within the grocery industry, some segments resonate particularly strongly with the 2024 consumer. This white paper dives into the data to explore two segments that have been leading category-wide visit growth for some time: specialty and fresh format stores, which focus on produce, organic foods, and culturally specific items (think Trader Joe’s, Sprouts Farmers Market, and H Mart, to name a few), and value grocery chains like Aldi, WinCo Foods, and Grocery Outlet Bargain Market.  Location analytics show shoppers are increasingly drawn to these two grocery store types, a shift that has the potential to reshape the grocery landscape.

How did value and specialty grocery chains perform in Q3 2024 in comparison to traditional supermarkets like Kroger, Albertsons, and H-E-B? How does visitor behavior vary between the three grocery segments, and what differences can be observed in the demographic and psychographic make-ups of their trade areas? The report explores these questions and more below. 

Grocery’s Continued Resilience

The grocery industry has performed well over the past few months, with steady weekly year-over-year (YoY) visit increases throughout Q3 2024. During the week of July 1st, the segment saw a 4.6% YoY foot traffic boost, likely driven by shoppers loading up on ingredients for Independence Day barbecues and picnics. And after tapering somewhat in early August, visits picked up again in September, with YoY increases ranging from 2.0% to  2.9% throughout the month. This positive growth is a good sign for the segment – which has experienced more than its fair share of challenges over the past few years. 

Non-Traditional Grocery Chains Propel Industry Growth in 2024

Though the grocery category as a whole is thriving, a closer look at different segments within the industry reveals that some are seeing more significant growth than others. 

Indeed, digging deeper into grocery visits throughout Q3 2024 reveals that much of the industry’s growth is being driven by specialty and fresh format stores and value grocery chains. The two segments offer markedly different shopping experiences: Specialty chains tend to emphasize harder-to-find ingredients and fresh produce – sometimes even at higher price points than traditional grocery stores – while value grocery stores focus on affordability. But both categories are experiencing outsize visit growth in 2024, highlighting consumers’ dual interest in both quality and value. 

In July and August 2024, traditional supermarkets, specialty grocers, and value chains all experienced positive YoY visit growth. But while traditional grocery stores saw a 3.1% increase in July and just a 0.9% uptick in August, value and specialty chains saw YoY growth ranging from 4.7% to 7.7% during the two months. In September 2024, YoY visits to traditional grocery stores fell by 0.5%, while value and specialty chains saw 5.0% and 5.2% increases, respectively. For today’s consumer, it seems, savings are key – but specialty offerings also resonate strongly. 

Shoppers Go the Extra Mile for Specialty Finds

Traveling Further to Specialty Grocery Stores

Today’s grocery shoppers are increasingly embracing specialty grocery options – and analyzing consumer driving habits to grocery stores shows that they are willing to go the extra mile to reach them. 

Breaking down grocery visits by distance traveled reveals that just 18.5% of visits to specialty and fresh format grocery chains came from less than one mile away in Q3 2024 – compared to 23.9% for traditional grocery stores and 23.2% for value chains. Similarly, 31.3% of visits to specialty and fresh format grocery stores originated from one to three miles away, compared to 34.7% and 34.5% for the other analyzed segments. 

On the flip side, some 26.4% of visits to specialty and fresh format stores were made by people traveling at least seven miles to do their shopping – compared to 22.7% and 21.4% for traditional and value chains, respectively. Specialty grocery operators can account for this difference, locating stores in areas accessible to geographically dispersed audiences eager to shop their unique offerings. 

Longer Drives Each Year

And a look at changes in visitor behavior at three key specialty chains – Trader Joe’s, Sprouts Farmers Market, and Great Wall Supermarket – shows that even as these brands expand their footprints, customers are increasingly willing to travel the distance to visit them. Between 2019 and 2024, all three chains saw a marked increase in the share of visitors traveling over seven miles to shop their offerings. .

Asian grocery chain Great Wall Supermarket, a relatively small regional chain with some 22 locations across eight states, saw the most significant increase in visits from afar over the analyzed period. In Q3 2024, 32.3% of visits to the chain originated from seven or more miles away, up from 28.3% in Q3 2019. Ranked America’s Best Supermarket by Newsweek in 2024, the chain’s wide selection of everything from seafood to fresh produce has made it a hit among Asian food aficionados – and as the supermarket’s reputation grows, so does its draw among customers living further away from its venues.

Consumer favorite Trader Joe’s and organic grocery chain Sprouts Farmers Market also grew their shares of long-distance visits between 2019 and 2024  –  no small feat for the two chains, given their expansion over the past several years. 

This travel distance snapshot serves as a reminder of the unique role played by specialty grocery stores that offer their customers unique shopping experiences, premium or organic products, and culturally specific items.  Shoppers will go out of their way to travel to these stores – and even as they expand and become more readily accessible, their growing popularity makes them ever-more attractive destinations for customers coming from further away.  

Cost-Conscious Consumers Take Their Time at Value Grocers

While visitors to specialty grocery chains often travel long distances for unique offerings, cost-conscious consumers at value stores exhibit other behaviors that differentiate them from traditional and specialty grocery shoppers. 

In Search of Savings

The rising cost of living has pushed the discount retail segment into overdrive – and value grocery chains are also benefiting. The category has flourished in recent years, with many bargain-oriented grocery chains adding new stores at a rapid clip to meet burgeoning consumer demand. 

Like visitors to specialty grocery chains, value grocery shoppers demonstrate segment-specific behaviors that reflect their preferences and habits. And perhaps most strikingly, foot traffic data reveals that these shoppers tend to stay longer in-store than visitors to traditional and specialty grocery chains.

In Q3 2024, 26.5% of visits to value grocery chains lasted longer than 30 minutes, compared to 23.4% for traditional grocery chains and 23.7% for specialty and fresh format chains. This suggests that these stores attract shoppers who take their time and carefully consider price points, looking for the best value for their dollar – a need that the chains they frequent seem to be meeting. 

Given the tremendous success of the value grocery space in recent years, it may come as no surprise that some traditional supermarkets are getting in on the action by opening or expanding discount banners of their own. How do such off-shoot banners impact these grocers’ reach? 

H-E-B’s Value Banner Draws Parents – Balancing Visit Frequency with Duration

Cult-favorite Texas grocery chain H-E-B opened the first branch of its value banner, Joe V’s Smart Shop, in 2010. The discount arm currently includes 11 stores – mainly in the Houston area – with several new stores opening, or in planning stages, in Dallas.

And foot traffic data shows that Joe V's attracts mission-driven shoppers who make less frequent but significantly longer trips than visitors to traditional grocery stores. In Q3 2024, the average visit duration at Joe V’s was 37.8 minutes, compared to just 26.8 minutes at H-E-B –  a full 11 minute difference.  At the same time, while 38.5% of Q3 visits to H-E-B were made by customers frequenting the chain, on average, at least four times a month, just 11.8% of visits to Joe V’s were made by visitors reaching that threshold. 

Joe V’s is also more likely than H-E-B to attract parental households, with 36.8% of its captured market made up of households with children – significantly higher than H-E-B’s 32.0%. 

Together, these data points paint a picture of the average Joe V’s shopper: cost-conscious, likely to have children, and inclined to carefully plan shopping trips to maximize savings and cut down on grocery runs. This suggests that they are mission-driven and focused on stocking up rather than running out to grab ingredients as the need arises. 

Hy-Vee Reaches Broader Customer Base With Dollar Fresh

Major grocery store operators often operate a variety of store types at different price points to appeal to as many shoppers as possible, and Hy-Vee is no exception. The regional grocery favorite launched a discount chain, Dollar Fresh, in 2018 and currently operates 25 stores under that banner, aiming to attract middle-class, cost-conscious shoppers.

Using Experian’s Mosaic dataset to analyze Dollar Fresh’s trade area reveals that the chain’s captured market features significantly higher shares of lower-middle-class family consumers than its potential one – highlighting its special draw for these shoppers. (A chain’s potential market is obtained by weighting each Census Block Group (CBG) in its trade area according to population size, thus reflecting the overall makeup of the chain’s trade area. A business’ captured market, on the other hand, is obtained by weighting each CBG according to its share of visits to the chain in question – and thus represents the profile of its actual visitor base. Comparing a chain’s captured market to its potential one can serve as a helpful gauge of the brand’s success at attracting key audience segments.)

In Q3 2024, the “Pastoral Pride” family segment represented 11.4% of Dollar Fresh’s captured market, compared to just 5.3% of its potential market. This over-representation of lower-middle-class consumers from small towns in Dollar Fresh’s captured market indicates that the chain is especially effective at drawing customers that belong to this segment. Though Hy-Vee’s captured market also boasted a higher share of this demographic than its potential one in Q3, the difference was much smaller – and the chain’s overall reach among these consumers was more limited.

In contrast, Hy-Vee excels at attracting “Flourishing Families” – affluent, middle-aged families and couples – who made up 10.3% of the supermarket’s captured market in Q3 2024. Dollar Fresh’s captured market, on the other hand, featured a smaller share of this segment than its potential one – showing that the discount chain is of less interest to these consumers. So while Hy-Vee tends to appeal to higher-income families with more spending flexibility, value-conscious shoppers have been making their way to Dollar Fresh. 

This audience segmentation analysis shows how value offerings help grocery chains attract wider audiences – and highlights the advantage of operating multiple store types to appeal to a broader range of shoppers.

Grocery Stores at a Crossroads

People will always need access to a variety of fresh foods – ensuring that grocery stores and supermarkets continue to play a vital role in in the retail landscape. And while the category as a whole has continued to thrive even in today’s challenging environment, specialty and value grocery chains resonate particularly strongly with the 2024 consumer. As grocery retailers diversify their formats, those aligning with consumer preferences for affordability, uniqueness, and quality are well-positioned for continued growth.

INSIDER
Report
Meet You at the Mall: Malls' Summer Draw
We dove into the data to see how malls have been performing in 2024 – and explore factors driving mall foot traffic during peak summer months
October 11, 2024
8 min read

Malls have come a long way since their introduction to the world in the 1950s. These gleaming retail hubs promised shoppers a taste of the American dream, offering a third place for teens, families, and everyone in between to shop, socialize, and hang out. 

And though malls have faced challenges in recent years, as e-commerce and pandemic-induced store closures led to shifts in consumer habits, the outlook is brightening. Malls have embraced innovation, incorporating enhanced entertainment, dining, and experiential offerings that attract a diverse range of visitors and redefine their purpose.

This white paper takes a look at the recent location intelligence metrics to gain an understanding of the changes taking place at malls across the country – including both indoor malls and open-air shopping centers. The report explores questions like: Why do malls experience foot traffic bumps during the summer months? How much of an impact do movie theaters have on mall visits, and what can mall operators learn from the Mall of America and American Dream malls’ focus on experiential entertainment?

2024’s Summer Peak at the Mall

Mall visitation is highly seasonal, with strikingly consistent monthly visitation patterns. Each year, visits decline somewhat in February, pick up in March, and begin to trend upward again in May – before peaking again in August. Then, after a slower September and October, foot traffic skyrockets during the holiday season, spiking dramatically in December. 

And while these trends follow similar patterns every year, comparing monthly visits throughout 2019, 2023, and 2024 (YTD) to each year’s own January baseline shows that this seasonality is growing more pronounced - especially for indoor malls.

Following a lackluster 2023, visits to both indoor malls and open-air shopping centers peaked higher in March 2024 than in 2019. And this summer, indoor malls in particular saw a much larger visit boost than in previous years. In August 2024, for example, visits to indoor malls were 27.3% higher than in January 2024 – a substantially higher baseline jump than that seen either in August 2019 (17.0%) or in August 2023 (12.0%). And though open-air shopping centers experienced a smaller summer visit boost, they too saw a bigger bump this year than in 2019 or in 2023. 

Summer Of Shopping

But malls aren’t just seeing larger visit spikes this year relative to their January baselines – they are also drawing bigger crowds than they did in 2023.

Between June and August 2024, indoor malls and open-air shopping centers both experienced year-over-year (YoY) visit growth. Indoor malls saw the largest YoY foot traffic boost (3.7%) – perhaps owing in part to 2024’s record-breaking heat, which led many patrons to seek refuge in air conditioned spaces. Still, open-air shopping centers, which feature plenty of air conditioned stores and restaurants, also enjoyed a YoY visit boost of 2.8% during the analyzed period. 

Malls’ strong summer baseline and YoY foot traffic growth built upon the strong performance seen during most of 2024 so far, leading to the question: What is driving malls’ positive momentum? We delve into some of the factors propelling these changes below.

Blockbuster Attractions Bring Audiences 

One offering that continues to play a significant role in driving foot traffic to malls is on-site movie theaters. Summer blockbuster releases, in particular, help attract crowds to theaters, in turn boosting overall visits to malls. 

Much like malls, movie theaters have also proven their resilience over the past few years. While pundits fretted about the theater’s impending death, production houses were busy releasing blockbuster after blockbuster and shattering box-office records at an impressive clip. And while 2023 was certainly a banner year for blockbuster summer releases, 2024 has had its fair share of stunning box-office successes, leading to major visit boosts at theaters across the country. 

Analyzing visits to malls with and without movie theaters highlights the impact of these summer Hollywood hits. Between June and August 2024, malls with theaters saw bigger visit boosts compared to a monthly year-to-date (YTD) average than malls without – an effect observed both for indoor malls and for open-air shopping centers.

For both mall types, the gap between centers with and without movie theaters was most pronounced in July 2024, likely owing to the release of Inside Out 2 in mid-June as well as the July releases of Deadpool & Wolverine and Twister. But in June and August 2024, too, centers with movie theaters sustained particularly impressive visit boosts – a solid sign that movie theaters and malls remain a winning combination.  

Movies at the Mall: An Evening Affair

Malls with movie theaters also drew higher shares of evening visits (7:00 PM - 10:00 PM) this summer than those without. Between June and August 2024, for example, evening outings accounted for 22.9% of visits to open-air shopping centers with movie theaters – compared to 18.2% of visits to centers without theaters. Indoor malls with theaters also saw a larger share of evening visits than those without – 18.1% compared to 15.0%. 

This increase in evening traffic is likely driven by major summer movie releases and the flexibility of summer schedules, with many visitors – including families – taking advantage of late-night outings without the concern of early wakeup calls. These summer visitation trends benefit both theaters and malls, opening up opportunities for increased sales through concessions, promotions, and evening deals that attract a more relaxed and engaged crowd.

Families Lead the Summer Mall Surge

Analyzing the demographics of malls’ captured markets also reveals that centers with movie theaters are more likely to attract certain family-oriented segments than those without. (A mall’s captured market consists of the mall’s trade areas – the census block groups (CBGs) feeding visitors to the mall – weighted according to each CBG’s actual share of visits to the mall.)

Between June and August 2024, for example, 14.2% of the captured markets of open-air shopping centers with movie theaters were made up of “Wealthy Suburban Families” – compared to 9.7% for open-air shopping centers without theaters.  

Indoor malls saw a similar pattern with regard to “Near-Urban Diverse Families”: Middle class families living in and around cities made up 9.0% of the captured markets of indoor malls with movie theaters, compared to 7.1% of the captured markets of those without. 

This increase in foot traffic from middle-class and wealthy family segments can be a boon for malls and retail tenants – driving up food court profits and bolstering sales at stores with kid-friendly offerings. 

Malls as the Main Attraction

Willing to Travel: Malls Draw Summer Visits From Afar

Malls have long positioned themselves as destinations for summer entertainment as well as retail therapy, holding – in addition to back to school sales – events like Fourth of July celebrations and even indoor basketball and arena football games. And during the summer months, malls attract visitors from further away.

Between June and August 2024, indoor malls drew 18.2% of visitors from 30+ miles away – compared to just 16.7% during the first five months of the year. Similarly, open-air shopping centers drew 19.6% of visits from 30+ miles away during the summer, compared to 17.1% between January and May. 

Extended daylight hours, summer trips away from home, and more free time are likely among the contributors to the summer draw for long-distance mall visitors. But in addition to their classic offerings – from movie theaters to stores and food courts – malls have also invested in other kinds of unique experiences to attract visitors. This next section takes a look at two mega-malls winning at the visitation game, to see what sets them apart.

Mall Of America: Experiential Exuberance

The Minneapolis-based Mall of America opened in 1992, redefining the limits of what a mall could offer. The mall boasts hundreds of stores, games, rides, and more – and is constantly expanding its attractions, cementing its status as a top destination for retail and entertainment. 

Between June and August 2024, Mall of America experienced a 13.8% YoY visit increase, far outperforming the 3.7% visit boost seen by the wider indoor mall space. And as a major tourist attraction – the mall hosted a series of Olympic-themed events throughout the summer – it also drew 41.6% of visits from 30+ miles away. This share  of distant visitors was significantly higher than that seen at the mall during the first five months of 2024, and more than double the segment-wide summer average of 18.2%.

The Mall of America also seems to be attracting more upper-middle-class families during the summer than other indoor malls: Between June and August 2024, some 18.0% of Mall of America’s captured market consisted of  “Upper Suburban Diverse Family Households”  – a segment including upper-middle-class suburbanites – compared to just 11.1% for the wider indoor mall segment. The increased presence of these families at the Mall of America may be driven by the variety of events offered during the summer.

American Dream Mall:  ArenaBowl Draws Crowds

In 2019, the American Dream Mall in New Jersey opened and became the second-largest mall in the country. Since the mall opened its doors, it has also focused on blending retail and entertainment to draw in as wide a range of visitors as possible – and summer 2024 was no exception. 

The mall hosted the Arena Football League Championship, ArenaBowl XXXIII, on Friday, July 19th. The event successfully attracted a higher share of visitors traveling from 30+ miles away compared to the average summer Friday – 35.4% compared to 25.7%. 

Visits to the mall on the day of the championship were also 13.6% higher than the Friday visit average for the period between June and August 2024, showcasing the mall’s ability to draw in crowds by hosting major events.

Summer Rush Recap: Mall Visitation in Focus

Malls – both indoor and open-air – continue to evolve while playing a central role in the American retail landscape. Increasingly, malls are emerging as destinations for more than just shopping – especially during the summer – driving up foot traffic and attracting visitors from near and far. And while much is often said about the impact of holiday seasons on mall foot traffic, summer months offer another opportunity to boost mall visits. Malls that can curate experiences that resonate with their clientele can hope to see foot traffic growth – in the summer months and beyond.

INSIDER
Report
Hudson Yards: The On-Site Workforce of Manhattan's New Hub
Dive into the data to explore shifting work patterns among Manhattan’s on-site employees and examine emerging trends in the fast-growing Hudson Yards neighborhood.
October 8, 2024
4 minutes

New York City is one of the world’s leading commercial centers – and Manhattan, home to some of the nation's most prominent corporations, is at its epicenter. Manhattan’s substantial in-office workforce has helped make New York a post-pandemic office recovery leader, outpacing most other major U.S. hubs. And the plethora of healthcare, service, and other on-site workers that keep the island humming along also contribute to its thriving employment landscape.

Using the latest location analytics, this report examines the shifting dynamics of the many on-site workers employed in Manhattan and the up-and-coming Hudson Yards neighborhood. Where does today’s Manhattan workforce come from? How often do on-site employees visit Hudson Yards? And how has the share of young professionals across Manhattan’s different districts shifted since the pandemic? 

Read on to find out. 

The Beat of the Borough

Return of the Commuter 

The rise in work-from-home (WFH) trends during the pandemic and the persistence of hybrid work have changed the face of commuting in Manhattan. 

In Q2 2019, nearly 60% of employee visits to Manhattan originated off the island. But in Q2 2021, that share fell to just 43.9% – likely due to many commuters avoiding public transportation and practicing social distancing during COVID.

Since Q2 2022, however, the share of employee visits to Manhattan from outside the borough has rebounded – steadily approaching, but not yet reaching, pre-pandemic levels. By Q2 2024, 54.7% of employee visits to Manhattan originated from elsewhere – likely a reflection of the Big Apple’s accelerated RTO that is drawing in-office workers back into the city. 

Unsurprisingly, some nearby boroughs – including Queens and the Bronx – have seen their share of Manhattan worker visits bounce back to what they were in 2019, while further-away areas of New York and New Jersey continue to lag behind. But Q2 2024 also saw an increase in the share of Manhattan workers commuting from other states – both compared to 2023 and compared to 2019 – perhaps reflecting the rise of super commuting

Spotlight on Hudson Yards

A Hyper-Hybrid Environment

Commuting into Manhattan is on the rise – but how often are employees making the trip? Diving into the data for employees based in Hudson Yards – Manhattan’s newest retail, office, and residential hub, which was officially opened to the public in March 2019 – reveals that the local workforce favors fewer in-person work days than in the past.

In August 2019, before the pandemic, 60.2% of Hudson Yards-based employees visited the neighborhood at least fifteen times. But by August 2021, the neighborhood’s share of near-full-time on-site workers had begun to drop – and it has declined ever since. In August 2024, only 22.6% of local workers visited the neighborhood 15+ times throughout the month. Meanwhile, the share of Hudson Yards-based employees making an appearance between five and nine times during the month emerged as the most common visit frequency by August 2022 – and has continued to increase since. In August 2024, 25.0% of employees visited the neighborhood less than five times a month, 32.5% visited between five and nine times, and 19.2% visited between 10 and 14 times.  

Like other workers throughout Manhattan, Hudson Yards employees seem to have fully embraced the new hybrid normal – coming into the office between one and four times a week. 

New Buildings Worth The Commute

But not all employment centers in the Hudson Yards neighborhood see the same patterns of on-site work. Some of the newest office buildings in the area appear to attract employees more frequently and from further away than other properties.

Of the Hudson Yards properties analyzed, Two Manhattan West, which was completed this year, attracted the largest share of frequent, long-distance commuters in August 2024 (15.3%) – defined as employees visiting 10+ times per month from at least 30 miles away. And The Spiral, which opened last year, drew the second-largest share of such on-site workers (12.3%). 

Employees in these skyscrapers may prioritize in-person work – or have been encouraged by their employers to return to the office – more than their counterparts in other Hudson Yards buildings. Employees may also choose to come in more frequently to enjoy these properties’ newer and more advanced amenities. And service and shift workers at these properties may also be coming in more frequently to support the buildings’ elevated occupancy.

Hudson Yards Young

Diving deeper into the segmentation of on-site employees in the Hudson Yards district provides further insight into this unique on-site workforce. 

Analysis of POIs corresponding to several commercial and office hubs in the borough reveals that between August 2019 and August 2024, Hudson Yards’ captured market had the fastest-growing share of employees belonging to STI: Landscape's “Apprentices” segment, which encompasses young, highly-paid professionals in urban settings.

Companies looking to attract young talent have already noticed that these young professionals are receptive to Hudson Yards’ vibrant atmosphere and collaborative spaces, and describe this as a key factor in their choice to lease local offices.

At Work In Manhattan: A Mix Of Old And New

Manhattan is a bastion of commerce, and its strong on-site workforce has helped lead the nation’s post-pandemic office recovery. But the dynamics of the many Manhattan-based workers continues to shift. And as new commercial and residential hubs emerge on the island, workplace trends and the characteristics of employees are almost certain to evolve with them.

Loading results...
We couldn't find anything matching your search.
Browse one of our topic pages to help find what you're looking for.
For more in-depth analyses on a variety of subjects, explore Reports.
The Anchor Logo
INSIDER
Stay Anchored: Subscribe to Insider & Unlock more Foot Traffic Insights
Gain insider insights with our in-depth analytics crafted by industry experts
— giving you the knowledge and edge to stay ahead.
Subscribe