Everything you need to know about foot traffic data, location analytics, choosing the best site and driving the transaction.
Table of Contents
Foot traffic data, also known as footfall or location data, analyzes the movement of people from place to place.
This data is usually derived from actual counting, the use of cameras, in-store sensors, visitor interviews or data sent from mobile devices.
At its best, this data becomes part of a panel that serves as the basis for larger estimations – enabling high levels of accuracy and a unique cross-sector perspective. For context, standard polling can utilize interviews with hundreds of people to produce a result that is within a 5% margin of error.
Foot traffic is used by real estate, retail and investment professionals as the basis for many of key decisions. Data is often used to measure visits to a property, understand where visitors are coming from (trade area) or is paired with other data such as demographics to better understand the details of a location’s audience.
A wide range of use cases, like retail site selection, real estate investments and property leasing, and location-based marketing campaigns use foot traffic insights.

When boiled down to its core value, location analytics helps any business with a stake in the offline world make better decisions, faster.
Why?
Firstly, foot traffic data is behavioral – meaning it shows actions not opinions. In a poll, people are asked to state what they feel about a certain issue or how they believe they’d act. Foot traffic data focuses on the actions themselves.
Secondly, when done properly with estimations, foot traffic data can provide a single lens on an entire sector. Because it does not rely on a specific company’s existing data it allows comparisons. These comparisons can be used for benchmarking and competitive intelligence, opening up a wider range of use cases and allowing every location to be compared to any other locations in the country, state or region.
Thirdly, it is not owned by a single entity. Whereas an in-store sensor may double count, include employees in its numbers or break down, foot traffic data looks at all locations for all retailers and shopping centers. This enables a unique level of scale and comparability.
Fourthly, it is accessible. Whereas other data sources can require weeks or months to normalize, foot traffic data can be provided in near real time when handled properly. Additionally, it can be made far more accessible, and therefore can be used across organizations.
With the tremendous costs of each decision, the ability to limit risk, better identify opportunities and optimize offline activities is changing the way professionals in Commercial Real Estate, Retail, Hospitality, CPG and beyond drive value offline.
A strong analytics platform allows for ways to generate insights from foot traffic data by leveraging data science and artificial intelligence technologies.
Key considerations to foot traffic data collection:Location – WiFi, GPS, Beacons, and user motion all play a key part in determining accuracy.
POIs – The need to match Point of Interest to location requires a highly accurate and current list of places.
Volume – Panel sizes are required to be large enough to accurately reflect visitors.
Panel Biases – Panel biases are modeled and accounted for in extrapolations.
Panel Variations – Changes in technology and application sources are normalized over time.
Thermal sensors – placing sensors at a property’s entrances and exits to count the number of people coming and going. The downside is it only provides people counting so there’s no useful information on your trade area, customer journeys, demographics and cross shopping.
Cameras – CCTV cameras are used to count the number of people entering and exiting a property.
Beacons & WiFi sensors – connect with phones in the network and count uniques. Both rely on a visitor’s telephone being open to WiFi and bluetooth. Misses out on trade areas, customer journeys, etc.
Mobile Location Data – Use a location-tracking SDK inside mobile applications to track anonymous visits to locations and where the visitors came from. It’s the only solution to understanding the context of the visits in addition to the number of visits.

There are many use cases for foot traffic, especially related to commercial real estate.
Retailers
Make better site-selection decisions, track the competition, inform and measure marketing campaigns.
Shopping center owners/operators
Attract high-value customers, make strong leasing offers to ideal tenants, identify acquisition opportunities.
Consumer Packaged Goods
Better understanding of consumer shopping behavior, measuring demand for brands and products, and running better local promotional campaigns.
Finance
Identify new opportunities, incorporate visitation data into models, monitor foot traffic of portfolio companies.
Civic & Economic Development
Tell your region’s story to attract the retailers and businesses that will drive sustainable economic development.
Brokerages
Identify great properties, win the representation, and drive the transaction with the best data.
Hospitality
Attract high-value customers, learn from your competitors, and make the best strategic decisions.
When it comes to making commercial real estate decisions, there is little data more important than foot traffic data.
But knowing what to look for is just as important as having it. Below are some questions every CRE or Retail professional should ask when making real estate decisions.
Foot traffic questions to ask yourself
Data-driven site selection will hinge on your ability to answer these questions:
How many visitors visit the potential site?
How to answer this question: View the foot traffic counts and trends of a location vs it’s alternative

Does visitor behavior suit my business?
How to answer this question: Check if the site’s day and time of visit charts match the peak operating hours of your business

What is the reach of the potential site?
How to answer this question: View the site’s trade area to see from how far visitors are traveling to visit and if there is any overlap with your nearby locations

Are there good co-tenants at the potential site?
How to answer this question: Check if the local branches of a potential tenant (or a competitor’s) are listed among your visitors’ favorite places or your tenants’ visitors’ favorite places.
Following these steps will help you identify potential tenants who are the ideal fit for your property.

Which chains have similar audiences to that of my property?
How to answer this question: Compare your property’s visitor demographics to those of a prospective tenant’s.

Are my property’s visitors already interested in a prospective tenant?
How to answer this question: Compare your property’s visitor demographics to those of a prospective tenant’s.

Which stores at my location are potential ideal co-tenants for a prospect?
How to answer this question: Check if the local branches of a potential tenant (or their competitor) are listed as your visitors’ favorite places and as your other tenants’ visitors’ favorite places.

Will a new location at my property cannibalize the prospective tenant’s other nearby locations?
How to answer this question: Check the trade areas of each location as well as your property to see if there is any overlap.

Guides for Learning How to Use Foot Traffic Analytics
Site Selection – Use Placer.ai to Find the Optimal Location
Leasing – Use Placer.ai to Attract & Win the Ideal Tenant
Acquisitions – Use Placer.ai to Prospect, Evaluate & Close Deals
Marketing – Use Placer.ai to Maximize Shopping Center Promotion
Management – Use Placer.ai to Optimize Asset Management
Learn how to analyze and showcase a shopping mall using foot traffic reports.
Leasing:
Which types of tenants are most likely to succeed in my mall?
How to answer this question: Look at the favorite chains for visitors at your shopping center’s popular stores.

Marketing campaigns:
What impact did my latest campaign have?
How to answer this question: See how visitation changed during your last marketing event. Compare it to a local competitor(s) to ensure any increase is unique.

Acquisition:
How does this potential acquisition compare to the competition?
How to answer this question: Foot traffic rankings help acquirers evaluate a mall’s anchor store against the competition

Management:
What impact did the recent renovation have?
How to answer this question: See how physical changes to your shopping center impact visitor dwell time.
Understanding the performance of retail chains at a national level can be especially useful when searching for potential partners and tenants.
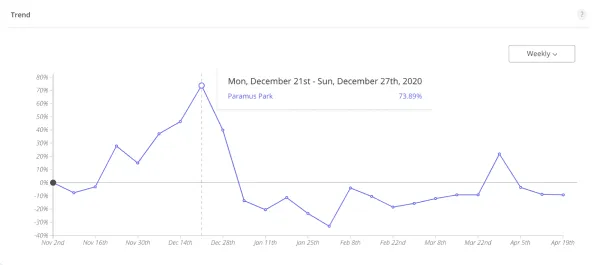
Which brands are trending upwards vs the competition?
How to answer this question: Stack the visit trend data of several brands against each other to see which are headed in the right direction.

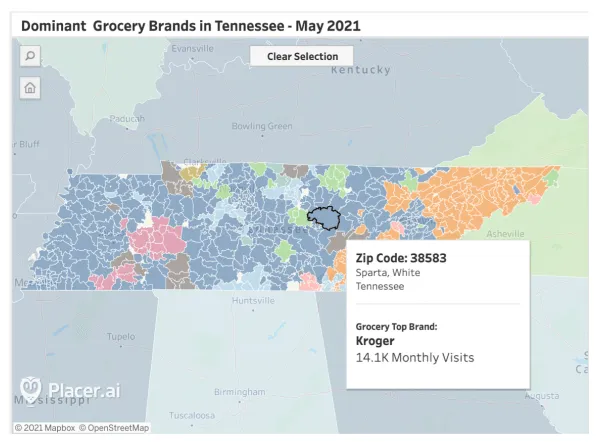
Which brands are leading their sectors by region?
How to answer this question: Break up visitation trends by Zip code or state and by industry to see which chains are leading their regions.
Get started with Placer.ai
Sign up for free foot traffic analytics
Get a demo of Placer.ai’s premium analyticsTry
The Square for free reports

