


Retail site selection
Where should we open next?
Ask Pi to rank candidate sites by real visit volume, trade area demographics and psychographics, and cannibalization risk. Pi’s retail analysis surfaces regional patterns early, so you can choose locations where your target shoppers already spend their time.
Learn more
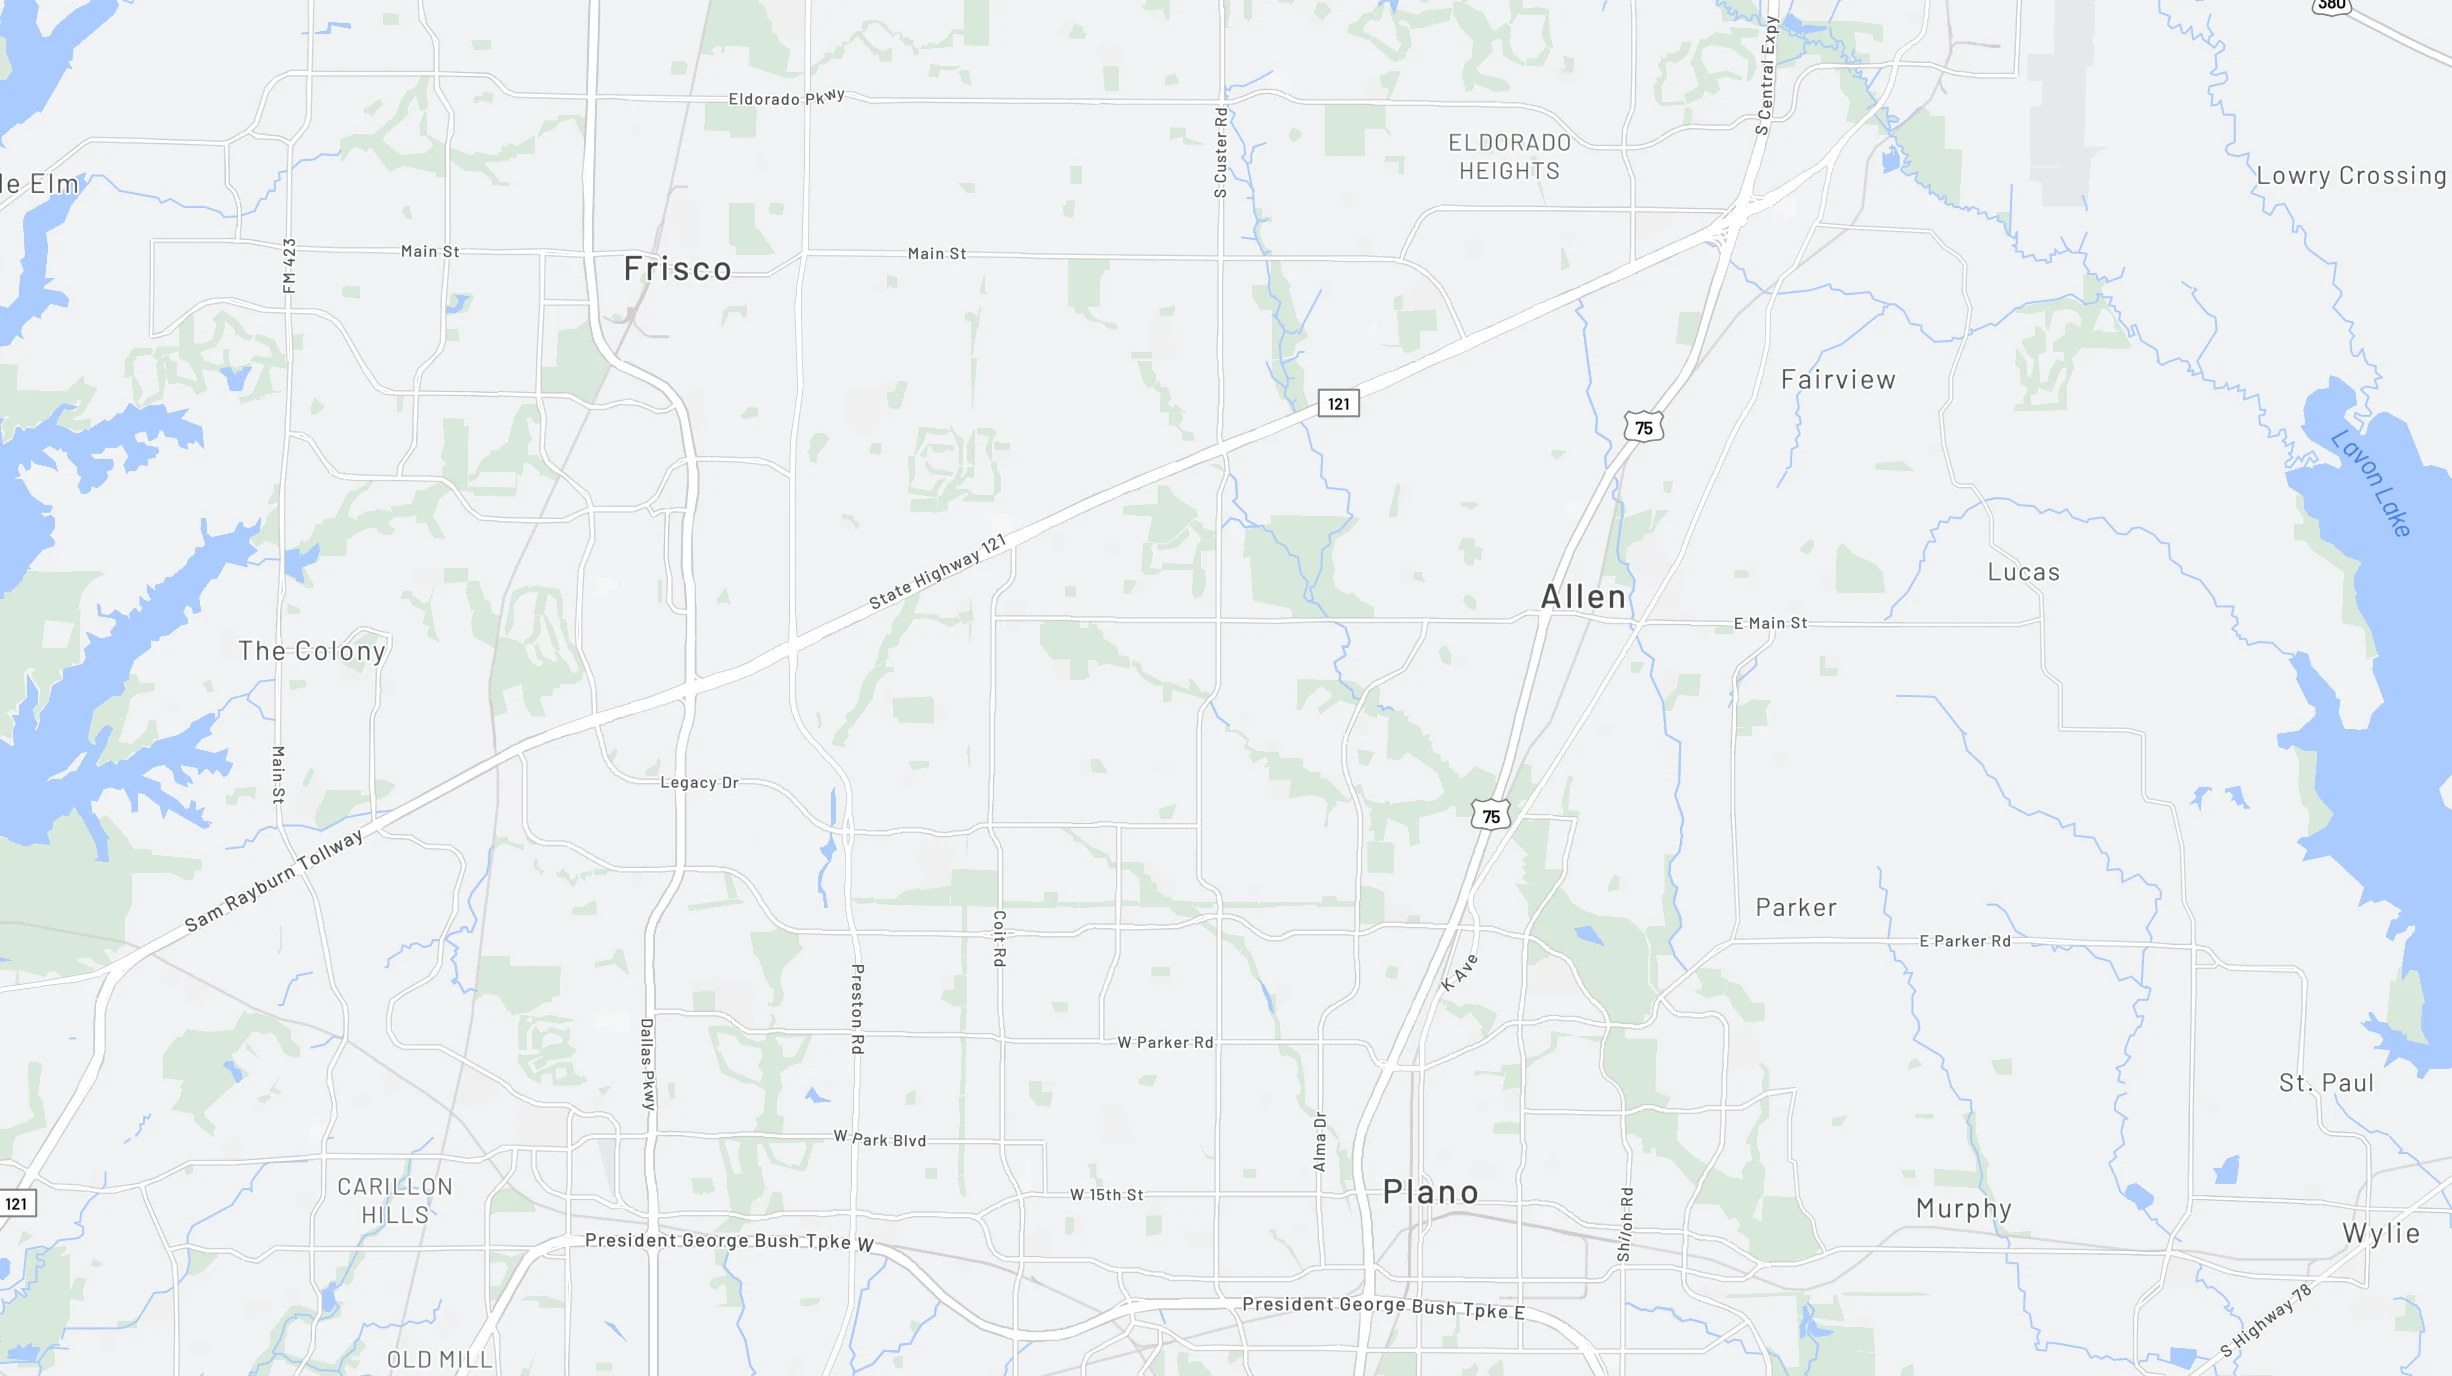
 Mapping your storesScoring 12 sites
'%3E %3Cpath id='Spinner' d='M9 0C10.78 -7.78077e-08 12.5201 0.527841 14.0001 1.51677C15.4802 2.50571 16.6337 3.91131 17.3149 5.55585C17.9961 7.20038 18.1743 9.00998 17.8271 10.7558C17.4798 12.5016 16.6226 14.1053 15.364 15.364C14.1053 16.6226 12.5016 17.4798 10.7558 17.8271C9.00998 18.1743 7.20038 17.9961 5.55585 17.3149C3.91131 16.6337 2.50571 15.4802 1.51677 14.0001C0.52784 12.5201 -1.55615e-07 10.78 0 9H2C2 10.3845 2.41054 11.7378 3.17971 12.889C3.94888 14.0401 5.04213 14.9373 6.32122 15.4672C7.6003 15.997 9.00776 16.1356 10.3656 15.8655C11.7235 15.5954 12.9708 14.9287 13.9497 13.9497C14.9287 12.9708 15.5954 11.7235 15.8655 10.3656C16.1356 9.00776 15.997 7.6003 15.4672 6.32122C14.9373 5.04213 14.0401 3.94888 12.889 3.17971C11.7378 2.41054 10.3845 2 9 2V0Z' fill='url(%23paint0_linear_0_57)'/%3E %3C/g%3E %3Cdefs%3E %3ClinearGradient id='paint0_linear_0_57' x1='18' y1='9' x2='-7.71654e-08' y2='9' gradientUnits='userSpaceOnUse'%3E %3Cstop stop-color='%23BC45DA'/%3E %3Cstop offset='1' stop-color='%234D53FB'/%3E %3C/linearGradient%3E %3CclipPath id='clip0_0_57'%3E %3Crect width='18' height='18' fill='white'/%3E %3C/clipPath%3E %3C/defs%3E %3C/svg%3E) Checking overlap
Plano is your best fit: high traffic, low overlap.
 Q3_leases.xlsx

Store performance benchmarking
How do our stores stack up against competitors?
Pi compares visits, trade areas, and foot traffic data for your stores against competitors’ locations. See where you win share, where you lose it, and which shoppers in your market you’re missing.
Learn more
You lead with 31% of visits.
Your stores
412K visits
Competitor A
336K visits
31%
 You
 Others
+4 pts vs. last year
Marketing campaign targeting & measurement
Which campaigns actually drove store visits?
Pi identifies your True Trade Area so you can target your audience and the neighborhoods your shoppers actually come from. Connect online spend to store visits with offline attribution and see which campaigns moved foot traffic.
Learn more
 Campaign markets
 Control markets
Weekly lift vs. control
+14.2%
Ask about location data, foot traffic, demographics…


 spring_campaign.csv
Store opening & closure impact
What happens to our network if we open or close a store?
Pi quantifies cannibalization, shared audiences, and churn before and after every change to your store network. Measure customer transfer and market capture so your next opening or closure starts from real data.
Learn moreWhere Store 214 shoppers go
62%
stay with you

62% of its shoppers would move to your nearby stores.
'%3E %3Cpath id='Vector' opacity='0.2' d='M22.75 4.375V22.75H16.625V4.375H22.75Z' fill='%23A23264'/%3E %3Cpath id='Vector_2' d='M24.5 21.875H23.625V4.375C23.625 4.14294 23.5328 3.92038 23.3687 3.75628C23.2046 3.59219 22.9821 3.5 22.75 3.5H16.625C16.3929 3.5 16.1704 3.59219 16.0063 3.75628C15.8422 3.92038 15.75 4.14294 15.75 4.375V8.75H10.5C10.2679 8.75 10.0454 8.84219 9.88128 9.00628C9.71719 9.17038 9.625 9.39294 9.625 9.625V14H5.25C5.01794 14 4.79538 14.0922 4.63128 14.2563C4.46719 14.4204 4.375 14.6429 4.375 14.875V21.875H3.5C3.26794 21.875 3.04538 21.9672 2.88128 22.1313C2.71719 22.2954 2.625 22.5179 2.625 22.75C2.625 22.9821 2.71719 23.2046 2.88128 23.3687C3.04538 23.5328 3.26794 23.625 3.5 23.625H24.5C24.7321 23.625 24.9546 23.5328 25.1187 23.3687C25.2828 23.2046 25.375 22.9821 25.375 22.75C25.375 22.5179 25.2828 22.2954 25.1187 22.1313C24.9546 21.9672 24.7321 21.875 24.5 21.875ZM17.5 5.25H21.875V21.875H17.5V5.25ZM11.375 10.5H15.75V21.875H11.375V10.5ZM6.125 15.75H9.625V21.875H6.125V15.75Z' fill='%23A23264'/%3E %3C/g%3E %3C/svg%3E)
Closure impact · Store 214
Shared audience
41%
Overlap with Store 118

Your stores

Competitors

Online

Lost
Remodel & promotion measurement
Did the remodel work, or was it just the season?
Pi compares foot traffic trends, rankings, and market share before and after remodels, rebrands, and promotions, so you can credit changes in store visits to the initiative itself, not the season.
Learn more
Weekly visits around the remodel
 PlanoMarket

 40K50K60K70K80K90KJanFebMarAprMayJunJulAugSep
Did the Plano remodel lift visits?


Market rank
#1
Up from #3 · +9% vs. market

