Skip to Main Content
Thank you! Your submission has been received!
Oops! Something went wrong while submitting the form.
0
0
0
0
----------
0
0
Articles
Article
Restaurant Outlook 2024: Year of New Location Expansion Plans?
R.J. Hottovy
Jan 13, 2024

As discussed last week, 2023 was a year that forced restaurant operators to stay agile amid inflationary headwinds and changes in consumer behavior, daypart shifts, new approaches to drive-thru, and population migration changes. This week’s ICR Conference also gave us a chance to speak with the management team from more than 25 restaurant chains as well as their investors to better understand their lessons from 2023 and how they plan to apply them in 2024.

Despite most chains reporting that visits are still down on a year-over-year basis, there was a sense of optimism among many of the operators we spoke to. Many acknowledged that there were still pressures weighing on consumer spending, but that the strategies put in place during 2023 to stabilize visitation trends had been working (including an emphasis on value, elevated experience, adopting new restaurant formats to better address a wider range of commercial property types, and new menu innovations). Several management teams acknowledged that the contractor availability and equipment supply chain bottlenecks that had plagued new store openings in 2023 had started to dissipate, with several chains planning to resume or even exceed their pre-pandemic pace of restaurant openings (although many admitted that new store buildout costs are still running 25%-30% higher than they were 5 years ago). Given the higher costs involved with new store openings (and the risk of opening a location in a subpar site), there was a heavy emphasis on harnessing new data sources to better understand migration trends, trade area demographics, and incumbent competition when making site selection opportunities (and thank you to customers like Dave & Buster’s and Chuy’s for highlighting how they are incorporating Placer data into these decisions).

Below, we discuss a few key trends that restaurant operators and their commercial real estate partners should be thinking about as we move into 2024.

Restaurants Ready to Grow Again

Perhaps it shouldn’t be surprising at an event where several restaurant operators were looking to raise capital, but the overarching theme from most management teams that we spoke to this week was that they were ready to accelerate unit expansion plans. Expansion strategies differed by concept, but most operators planned to open new locations across a combination of existing and new markets. With respect to new markets, many operators told us they were prioritizing South and Southeastern markets for new market expansion, echoing what we heard from McDonald’s and others last year. Below, we’ve presented the latest data from Placer’s Migration Trends Report which shows total population changes by market from November 2019-November 2023. Indeed, our data confirms that many South (Phoenix, Texas) and Southeast (Central Florida, Carolinas) markets were among the highest growth populations in the U.S. over the past four years.

That said, with so many restaurant operators targeting these regions, we heard from several executives about the importance of fully understanding the makeup of the markets. Said another way, just because a market has seen meaningful population growth, it doesn’t necessarily mean it’s a candidate for expansion. Below, we’ve presented the same migration map as above (2019-2023 population growth), but with a origin/destination household income filter. A red dot on this map indicates that a market saw the average household income fall because of migration, while a green dot indicates that a market saw an increase in household income. Here, we see a slightly different story, as many higher growth populations actually saw a decline in household income due to migration. We also see the impact of the urban/suburban migration shift that we’ve discussed in the past, with many smaller markets across the Carolinas and Central Florida seeing the highest household income growth versus 2019.

Below, we’ve attempted to bring the two charts together and identify markets that have not only seen population growth but also a significant increase in household income. We see markets like Las Vegas and other areas in Central Florida and the Carolinas region score well using this methodology, but a number of other markets like Boise City, ID, Lakeland, WI, and Spokane, WA also seeing increases in population but also an increase in their average household income.

Most U.S. markets have gone through significant changes post-pandemic both in terms of population size and population makeup.  At the end of the day, it's important for restaurants and retailers to not only understand both of these factors when evaluating new markets for growth. We’ve certainly seen success stories–Portillo’s continues to thrive in Texas, for example–but we’ve also seen cases where restaurant openings haven’t been as successful in newer markets because of migration changes.

Eatertainment Demand Remains Strong

We spoke about trends in the eatertainment category last year with the conclusion being that these concepts were still key in driving traffic to commercial properties (despite facing tougher year-over-year comparisons from the great reopening we saw in 2022). There was a palpable sense of optimism among the eatertainment concepts we spoke to at the event, whether they were more focused on entertainment (including Dave & Buster’s, Puttshack, and Pinstripes) or interactive dining (Kura Revolving Sushi Bar or GEN Korean BBQ).  

We’ve updated the eatertainment versus casual dining category visit per location analysis we’ve presented in the past below. Although eatertainment’s visit per location outperformance narrowed versus casual dining during Q4 2023, we believe this is a byproduct of seasonality (shift to sit-down dining during the holiday season) and expect the gap to widen once again during Q1 2024.

Most of the eatertainment concepts we spoke to at the ICR conference planned a two-pronged approach to unit expansion in 2024: infilling existing markets and establishing a beachhead in newer markets. Most concepts in this category were planning to grow their store bases by at least double-digit growth rates in 2024, with some like Pinstripes are forecasting 30%+ unit growth this year. Other like Dave & Buster’s are planning to focus on remodeling activity on top of new unit openings to modernize their locations. As demand for eatertainment remains strong among consumers and mall owners, we anticipate that this will remain one of the past growing categories in dining during 2024.

Casual Dining Connecting with Millennials

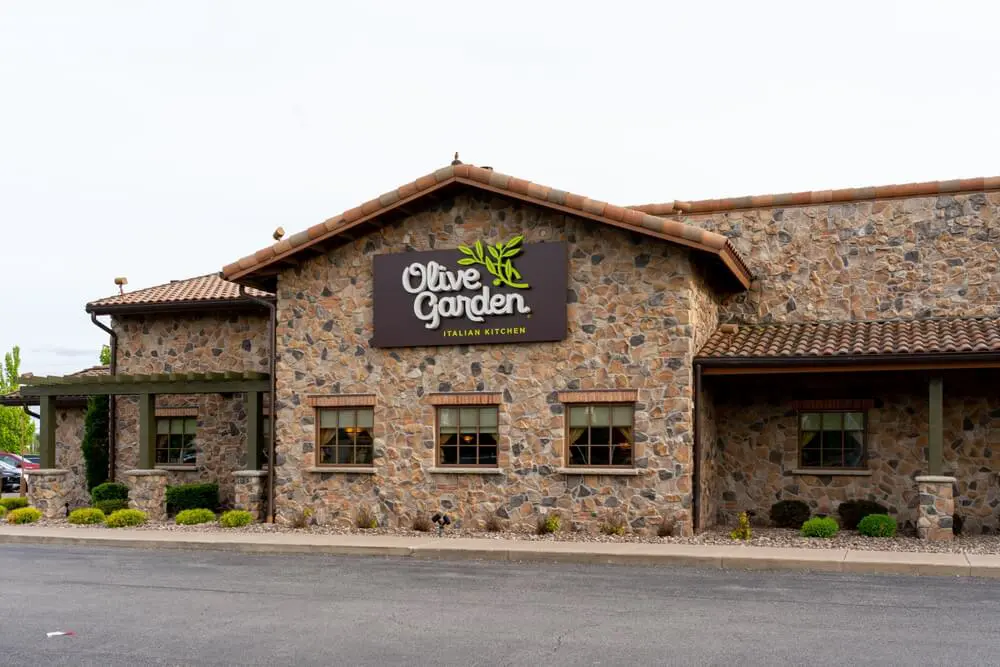
Casual dining concepts often have a reputation of catering to an older population. However, Darden’s management team called out several demographic trends that should benefit its different brands (including Olive Garden, Longhorn Steakhouse, Cheddar’s, Yardhouse, and others). First, while the percentage of the population in their peak earning years (typically between the ages of 35 and 55) had been on a downward trend for much of the 2000s and part of the 2010s, we’ve seen a reversal of this trend in recent years, which should stimulate demand for full-service dining. Second, the company noted that it over-indexes to millennials. Our data reinforces this, as the potential trade area audience profile by age cohort for Olive Garden (below) indicates a higher percentage of population between the ages of 30-49, encapsulating much of the millennial age range (roughly 27-42 years old today). Last year, we noted that some of the shift to earlier dining times may have been due to changing demographic trends in cities, with an increase in younger families in urban markets needing earlier dining times. Darden's commentary offers further validation of these trends and offers hope for other casual dining chains as this generation cohort continues to enter their peak earning years.

Last year, we noted that some of the shift to earlier dining times may have been due to changing demographic trends in cities, with an increase in younger families in urban markets needing earlier dining times. Darden's commentary offers further validation of these trends and offers hope for other casual dining chains as this generation cohort continues to enter their peak earning years.

Article
Can a Shopping Center be Too Fun for Grocery?
Caroline Wu
Jan 13, 2024

Grocery anchors proved to be a saving grace for many a shopping center during COVID. With apparel and dining shut down and only essential retailers allowed to open, many centers suddenly found that having a superstore/mass merchant like Walmart or Target, a warehouse like Costco or Sam’s Club, or a grocery store on the premises helped to steady some of the waves of traffic fluctuations. Whether it was as part of a specific center or more broadly adding grocery-anchored centers to a portfolio, REITs started looking more closely at the role of grocery in their centers. Indeed, we have written about the inclusion of specialty grocery stores and ethnic grocery stores in shopping centers being even rather quotidian these days. We’ve also written about the redevelopment of shopping centers that include food halls as part of their renaissance.  

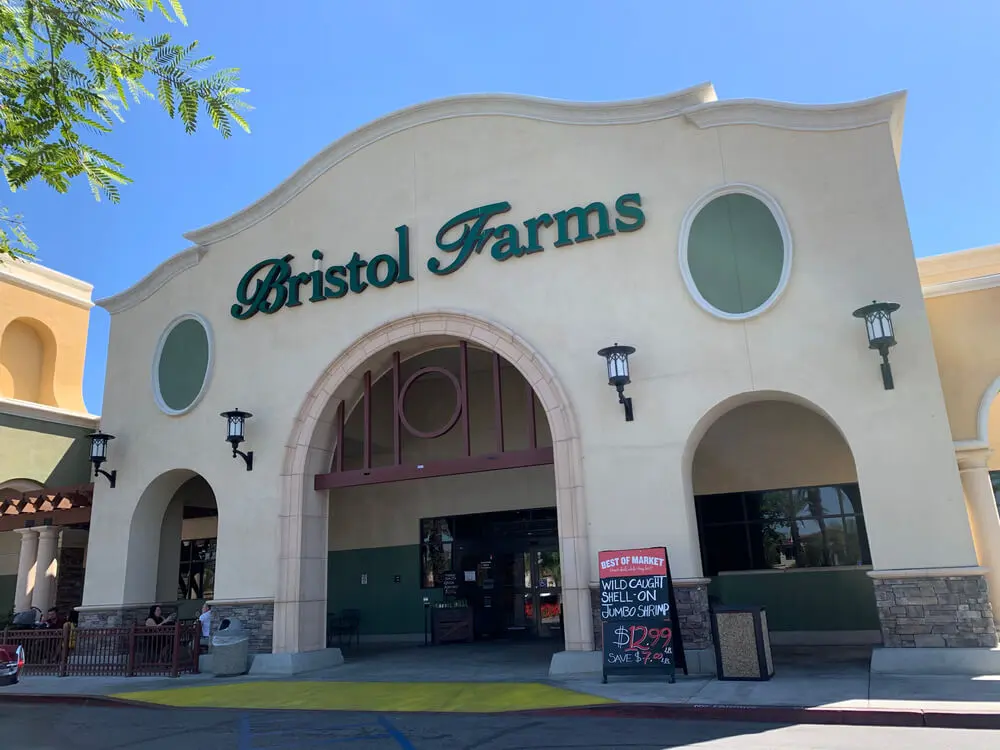
So it was rather surprising that Bristol Farms’ concept Newfound Market, which opened at the Irvine Spectrum in March 2022, recently announced that it is closing. The initial concept was to be “very much about experience…diving in deep on food and beverage…curated, yet everyday.”  It was to feature seven of Bristol Farms’ own chef-created restaurant brands.

We take a look at some Placer statistics to see what might have accounted for reduced traffic for what sounded like an amazing concept. As a control, we compared the Bristol Farms in Irvine to one in nearby Newport Beach. We see that when Newfound Market first opened, it had nearly twice the traffic of the one in Newport Beach. This could be due to overall excitement about the chef-driven concepts, wanting to check out a new grocery store, or other factors. However, traffic for Newfound Market began dwindling in Fall 2022, and fell even further in Fall 2023, likely leading to its closure.

If we look at variance, we see that during the same time period, traffic grew for Irvine Spectrum Center as a whole (note it was one of our spectacular callouts for holiday shopping 2023 in terms of year-over-year growth), and traffic was fairly steady for the Newport Beach branch of the Bristol Farms.

How much did the number of Newfound Market shoppers change over time?  We compared the Bristol Farms Newfound Market Shopper from Apr.-Dec. 2022 with that of the shopper from Apr.-Dec. 2023. During that time, there were over 150K fewer visits and around 100K fewer visitors. Visit frequency also decreased from 1.54 to 1.4 (below).

There was a slight dip in the average household income of the visitor.

There was a marked decrease in the proportion of Ultra Wealthy Families coming in 2023, and somewhat of a decrease of Wealthy Suburban Families.

Interestingly, the trade area has expanded from 2022 to 2023, as shown by the increase in red dots from further afield.

And indeed, Placer analysis reveals that the trade area increased by 28 square miles. On one hand, this is a plus, showing that there is a magnetic draw to a wider audience. On the other hand, given that most grocery stores live on weekly visits from a much tighter trade area, this could indicate that a trip to Irvine Spectrum and/or the Bristol Farms Newfound Market began to fall under the umbrella of a “destination” visit, rather than a regular “essential” visit. Over time, those locals who associate the Irvine Spectrum more with a Ferris Wheel might not have grocery shopping there as top-of-mind, and those who come from further away have already tried out the food hall.

The average visit frequency to Bristol Farms Newfound market was 1.54 from Apr.-Dec. 2022 and 1.40 from Apr.-Dec. 2023. In contrast, the average visit frequency to the top four most-trafficked Bristol Farms was closer to 3-4 visits, a rate more than double. Most telling is when we look at the bar chart below and see that the number of one-time visitors versus 30+ time visitors at Newfound Market is almost in direct contrast to its four other peers, who have a much higher proportion of their visits in the 10+ range.

This by no means negates the fact that grocery stores and food halls can be wonderful additions to shopping centers. For instance, 99 Ranch opened at Westfield Oakridge around the same time period (March 2022) and to date it has proven to have a steady stream of traffic. Keep in mind that Oakridge is more of your neighborhood mall with typical mall retailers, hence more likely to be part of a weekly or monthly routine.

Comparing year-over-year variance, the 99 Ranch at Oakridge has also overindexed on a percentage basis compared to the overall mall. The grocery store draws from a trade area of 58 square miles, with an average of 2.86 visits.

Article
Backcountry: Another DTC Brand Accelerates its Push into Physical Retail
Caroline Wu
Jan 13, 2024

With sales of mountain passes up and eager skiers and snowboarders ready to hit the slopes, let’s take a look at how Backcountry has been performing of late. This brand may be familiar to many, as it has been an online retailer for the past 27 years. Lately, though, the retailer has made a foray into brick-and-mortar stores in areas where they have a strong concentration of online customers, with the store count currently up to 9 nationwide.

The Palo Alto store opened in Spring 2023. Visitation trendlines show that this store at the Stanford Shopping Center has jumped to be neck-and-neck with the Seattle store in Dec 2023.

The majority of Backcountry shoppers come from very high-income households, such as Ultra Wealthy Families, Educated Urbanites, and Sunset Boomers (using PersonaLive data for select store trade areas).

Backcountry opened its first physical store downstairs from its corporate headquarters in Park City, UT in 2021. The impetus for opening a brick-and-mortar store was to “deepen connections with its customers.” In addition to the Palo Alto store, Backcountry also opened its first east coast outpost on 14th St in Washington DC during spring 2023, one of the hot retail corridors we wrote about. The newest entrant is a 23,000 square-foot flagship location open at the Grove in Los Angeles in July, which will provide gear for all sorts of popular outdoor activities, such as hiking, camping, water sports, running and climbing.

Article
Christmas Day Dining Recap
We take a closer look at nationwide dining trends on Christmas, focusing on full-service restaurants with significant national or regional presence. Which brands are most popular on Christmas, and how does this popularity differ by region of the country?
Lila Margalit
Jan 11, 2024
4 minutes

The holidays conjure up warm, cozy images of families sitting around artfully-set tables and enjoying delicious home-cooked meals. But for many people, Christmas Day is also a time to eat out. And while many restaurants are closed on December 25th, several national and regional chains keep their doors open for patrons eager to enjoy a nice, stress-free meal with loved ones – without the clean-up. 

So with the holiday season in the rearview mirror, we dove into the data to explore nationwide December 25th dining trends – focusing our analysis on more than 100 chains, mostly full-service, with significant national or regional presence. Which brands are most popular on Christmas Day? And what differences can be observed in different regions of the country? 

The Pacific West Takes the Lead

Nationwide, visits to dining chains nationwide were down 59.7% on December 25th, 2023, compared to a Q4 2023 daily average. But digging down deeper into the different areas of the country reveals significant regional differences. 

The Pacific states – including California, Washington, Oregon, Alaska, and Hawaii – saw a drop of just 33.8% in dining visits on Christmas Day compared to the region’s Q4 2023 daily average. Next in line were the various regions of the South, where December 25th foot traffic dropped between 51.2% and 56.9%, followed by the Mountain states. And on the other end of the spectrum lay New England, where visits were down 83.3% compared to a Q4 baseline. Other areas of the Northeast and Midwest also experienced foot traffic dips in excess of 70.0% – indicating that residents of these areas are less likely to dine out on the holiday. 

Map: US regions, Pacific states lead christmas day dining visits, based on analysis of 129 restaurant chains with significant national or regional presence.

Christmas Day is Breakfast Day

But which chains are most popular on December 25th? Analyzing the distribution of holiday visits among 25 leading Christmas Day restaurant destinations shows that three all-day breakfast chains – Waffle House, IHOP, and Denny’s – dominated the Christmas Day dining market this year. 

Together, these 24/7 eateries, which tend to experience significant holiday visit bumps, accounted for an impressive 70.4% of holiday dining foot traffic. After a leisurely morning of presents and hot cocoa, it seems, nothing quite hits the spot like waffles, pancakes, and other breakfast favorites. And with affordable prices, seasonal menus, and special holiday vibes (complete with pajama-clad customers), these restaurants offer plenty of holiday cheer. 

But breakfast chains aren’t the only dining venues that draw Christmas Day crowds. Red Lobster, the popular seafood chain, cornered 4.9% of this year’s December 25th dining foot traffic. And Applebee’s, Black Bear Diner, Golden Corral, and TGI Fridays each received between 2.0% and 3.0% of Christmas Day visits.


Pie Chart: Waffle House, IHOP, and Denny's Drive Christmas Day Dining Visits, based on analysis of relative visit share for 25 national and regional restaurant chains with locations open on Dec. 25th

A Variety of Local Favs

Drilling down deeper into the data for holiday visit trends shows that each state has its own favorite Christmas Day destination. In no fewer than 21 states nationwide – including New York, Texas, Michigan, and Florida – IHOP topped the chart. Denny’s and Waffle House, for their parts, each led the charge in 11 states, with Waffle House dominating the Christmas Day scene in much of the South. 

But in some places, other chains topped the Christmas Day rankings. In Iowa, Minnesota, and North Dakota, people flocked to Perkins Restaurant & Bakery – the casual-dining chain known for its iconic pies and pancakes. In Wyoming and South Dakota, Red Lobster drew the biggest crowds. And in Oregon, Shari’s – a chain with some 80 locations in the western region of the country – attracted the most holiday visits.

Map: IHOP tops Christmas Day Visit Share Rankings in 21 States, based on analysis of 129 restaurant chains with significant national or regional presence.

More Leisurely Meals

Foot traffic data also reveals, unsurprisingly, that visitors to the three Christmas Day leaders – Waffle House, IHOP, and Denny’s – spent more time in the restaurants on Christmas Day than they usually do. Some 17.3% of Christmas Day Waffle House visits lasted more than one hour – compared to 14.7% on an average day in 2023. IHOP and Denny’s also saw significant holiday increases in dwell time. 

Graph Christmas Day Diners Linger Longer over their meals

If You Stay Open, They Will Come

Though many restaurants are closed on December 25th, chains that do stay open – especially all-day breakfast eateries – draw significant crowds. How will holiday winners like Waffle House, IHOP, and Denny’s continue to fare as people settle back into their post-holiday routines? And how will Christmas Day dining trends evolve nationwide in the years to come? 

Follow placer.ai/blog to find out.

Article
Placer.ai Office Index: December 2023 Recap
Find out how December 2023 office visits compared to pre-COVID trends and what impact the holiday season had on the demographic profile of the typical office-goer.
Lila Margalit
Jan 10, 2024
4 minutes

The Placer.ai Nationwide Office Building Index: The office building index analyzes foot traffic data from some 1,000 office buildings across the country. It only includes commercial office buildings, and commercial office buildings with retail offerings on the first floor (like an office building that might include a national coffee chain on the ground floor). It does NOT include mixed-use buildings that are both residential and commercial.

Has the remote work war run its course? For a while last year, it seemed like not a day went by without another headline proclaiming the demise of WFH. And as return-to-office mandates continued to pile up (et tu, Zoom?), the debate over offsite work productivity grew ever more rancorous. 

But amidst all the noise, a new hybrid reality appears to have taken hold, offering both companies and employees the benefits of a mixed model. Yes, productivity can thrive outside the office – but there is something about the intangible spark that ignites when people interact with one another in person that has proven crucial to business success. So while recent survey data shows a precipitous drop in fully remote work over the past three years, most companies aren’t requiring people to go back to the office full time.   

With these trends in mind, we dove into the data to explore the state of office foot traffic as the year drew to a close. How did December 2023 office visits compare to pre-COVID? And what impact did the holiday season have on the demographic profile of the typical office-goer?

December Holding Pattern Amidst Regional Differences

Last month, buildings in our Nationwide Office Index received 36.5% fewer visits than they did in December 2019 – reflecting a continuation of the same general holding pattern that has seen foot traffic hovering around 40.0% of pre-COVID levels, with some minor fluctuations. 

But delving further into the data for key commercial hubs nationwide highlights the persistence of important regional differences – with New York City emerging as last month’s clear office recovery winner. In December 2023, the Big Apple experienced a year-over-four-year (Yo4Y) visit gap of just 19.2% – the smallest seen by the city in some time. At the other end of the spectrum lay San Francisco, with a Yo4Y visit gap of 53.1%. 

Graph: In December 2023 Nationwide Office Visits were 36.5% lower than pre-COVID levels, but regional differences persisted. (some offices located in greater NYC and Dallas included

Who Goes to the Office in December?

But December is a bit of an outlier, work-wise. It’s the heart of the holiday season – kicked off by Thanksgiving at the end of November, and bookended by New Year’s Eve on the other side. And foot traffic data shows a small but distinct shift in the demographic profiles of office buildings’ captured markets – i.e. the areas their visitors come from – during the last month of the year. 

Nationwide, and in major cities like New York and San Francisco, office-goers tend to come from relatively affluent areas with greater-than-average shares of one-person households. But over the final three months of 2023, both of these metrics in office buildings’ captured markets gradually declined. November office visitors were more likely to come from larger and lower-HHI households than October visitors – and December visitors were more likely to come from such households than November ones. This may reflect the greater flexibility of higher-HHI employees to work from home more often during the holiday season. It may also reflect a greater tendency on the part of singles to take extended trips to visit family during the holidays, and plug in from afar.

Graph: As the Holidays Set in, visitors to office buildings were more likely to come from bigger, less affluent households. Based on STI: PopStats data and placer.ai captured trade area data. including buildings from greater NYC region

Key Takeaways

Hybrid work may be here to stay, but employees and companies will likely continue to negotiate the exact terms of the new model in the months and years ahead. Are the remote work wars really over? And what will office recovery look like in the new year?

Follow placer.ai/blog to find out.

Article
Major Urban Shopping Districts – Holiday Season Recap
With the new year upon us, we dove into the data to see how major urban shopping districts nationwide fared this holiday season. How did visits to these corridors in the final months of 2023 compare to last year? And who are the consumers driving the high-street revival? 
Lila Margalit
Jan 9, 2024
4 minutes

With their experiential vibes and treasured blends of well-known brands and local gems, high-street retail corridors are experiencing something of a renaissance. Iconic shopping districts like Fifth Avenue and SoHo in New York City, Rodeo Drive in Beverly Hills, and Newbury Street in Boston are seeing steady influxes of luxury and high-end apparel brands. And economic headwinds notwithstanding, consumers continue to flock to these important retail destinations to shop, grab a bite to eat, and take in all the sights and sounds they have to offer. 

So with the new year upon us, we dove into the data to see how major urban shopping districts nationwide fared this holiday season. How did visits to these corridors in the final months of 2023 compare to last year? And who are the consumers driving the high-street revival? 

Visits on an Upswing

Over the past six months, visits to major urban shopping districts have been consistently higher than they were last year. And as the holiday season kicked into gear, the year-over-year (YoY) growth trajectory trended upwards – indicating a robust turnout during this holiday period.


Graph: Monthly visits to major urban shopping districts have been on an upswing

Affluent, Educated Urbanites Driving Growth

To examine some of the factors behind this growth, we analyzed the demographic profiles of the captured markets of POIs (points of interest) corresponding to major high-street corridors throughout the country. 

The analysis shows that throughout the U.S., high-street shopping districts hold special appeal for affluent audiences – and for consumers belonging to Spatial.ai’s PersonaLive’s “Educated Urbanite” psychographic segment. This segment encompasses well-educated young singles that live in dense urban areas and make relatively high salaries. Given the demographic profile of their visitors, it’s no wonder that high-street corridors are finding success while expanding their luxury and high-end apparel portfolios.

New York City’s Iconic Corridors

In Q4 2023, the captured markets of Fifth Avenue, SoHo, and Times Square all featured higher median household incomes (HHIs), and greater shares of the “Educated Urbanite” segment than New York’s statewide baselines. Each of these quintessential New York City landmarks, however, drew a somewhat different visitor base. 

Fifth Avenue, with its array of museums, luxury high-rises, and expensive department stores, drew the most affluent crowd, with a captured market median HHI of $105.6K – some 35.7% above the statewide median. SoHo, for its part, known for designer apparel stores, trendy cafes, and whimsical tourist attractions (Museum of Ice Cream, anyone?), attracted the largest share of “Educated Urbanites.” And Times Square, a top Big Apple attraction with broad popular appeal, boasted a visitor profile closest to statewide baselines. 

Graph: major urban shopping districts in New York attract affluent, educated urbanites

California’s Main Drags

A look at the visitor profiles of major California shopping districts reveals a similar trend. The captured markets of Beverly Hills’ Rodeo Drive, Santa Monica’s 3rd Street Promenade, Hayes Valley in San Francisco, and Abbot Kinney in Los Angeles all had higher median HHIs in Q4 2023 than the statewide median of $85.7K. Of these, the captured market with the highest median HHI was that of Hayes Valley in San Francisco – an unsurprising finding given the relative affluence of the Bay Area. Not far behind was Rodeo Drive, with a median HHI of $113.9K.

Hayes Valley also led the charge for “Educated Urbanites,” with no less than 61.4% of the population of its captured market  – nearly two-thirds – belonging to this segment. But all four of the analyzed high-street corridors were significantly over-indexed for this demographic compared to the California baseline of 13.1%.

Graph: major urban shopping districts in California also attract affluent, Educated Urbanites

A Regional Roundup: Boston, Chicago, and Philadelphia

Looking at urban shopping districts in other major cities nationwide – including Newbury Street in Boston, Fulton Market in Chicago, and Walnut Street in Philadelphia – shows that the unique draw of these corridors for young, affluent singles isn’t confined to New York and Chicago. In all three corridors, the median HHIs and shares of “Educated Urbanites” in the captured markets 

also exceeded statewide baselines – oftentimes by a wide margin.

Graph: major shopping districts in other regions of the country also attract Educated Urbanites

Final Thoughts

Evolving work routines and post-COVID population shifts continue to present municipalities and other civic stakeholders with significant challenges. But the revival of high-street retail corridors shows that cities are up to the task. How will major urban shopping districts fare in the new year? And how will their audiences continue to evolve? 

Follow Placer.ai’s data-driven retail foot traffic analyses to find out.

Reports
INSIDER
Report
What High-Growth Brands Know About Picking the Right Location
Explore key signals guiding data-driven site selection from brands actively expanding their brick-and-mortar footprints.
May 21, 2026

Predicting The Next Best Location

Across segments, retail and dining expansions converge on a common set of priorities, including identifying markets with strong demand, ensuring alignment with target audiences, and leveraging local consumer behavior to drive synergy. Using AI-powered location intelligence, we analyzed five expanding brands and segments to uncover the core principles driving successful site selection.

1. Identifying Sustainable Growth in an Increasingly Saturated Market

Nationwide visits to coffee chains are up in 2026, with established brands and newcomers alike seeing their traffic increase as consumer headwinds lead some to shift their discretionary spend towards more affordable indulgences. But past visit growth does not necessarily indicate future opportunity – it may instead signal market saturation. Relying solely on overall visit trends to guide expansion could lead chains into highly competitive markets where existing supply already meets demand. 

For example, analyzing traffic trends in 10 major metro areas where coffee visits increased  year-over-year (YoY) in Q1 2026 reveals significant gaps between overall traffic trends and per-location demand. In some CBSAs, overall traffic growth significantly outpaced per-location traffic trends – suggesting that supply is already meeting (or exceeding) demand and limiting room for new coffee locations despite overall category growth. But in other metro areas, where overall visit growth appears smaller, per-location traffic is actually booming – indicating that the underlying demand is resilient enough to support additional coffee concepts. 

These patterns highlight the importance of looking beyond topline growth to identify where true whitespace still exists.

Strategic Takeaways: 

  • Relying solely on aggregate category performance can obscure regional white space. A market-level view may reveal opportunities for stronger returns in areas where consumer demand is gaining momentum.
  • Combining overall visit and visits per location data offers a more complete view of where demand is both strong and sustainable.

2. Ensuring Demographic Alignment on the Hyperlocal Level

Effective site selection matches both regional and local demographics to a brand’s target customer, supporting performance and reinforcing positioning. But even in well-aligned metros, results depend on site-level precision – locations where the trade area visitor profile most closely reflects the brand’s core audience are best positioned to drive incremental upside.

An analysis of Alo locations in the DC area suggests that the company is adopting this strategy. Within the already high-income metro area of Washington-Arlington-Alexandria, individual Alo Yoga stores are placed in centers that draw even more affluent visitors – maximizing the revenue potential of each location.

In fact, Alo's newest stores in the metro area – One Loudoun and Bethesda Row – drive traffic from households with higher median incomes than even the established area locations. This signals a clear focus on premium retail corridors and affluent consumer segments, which reinforces the brand’s positioning while capturing higher-spending customers at the site level.

Strategic Takeaways:

  • Beyond traffic potential, effective site selection requires a clear understanding of both regional and hyperlocal demographics, as well as the brand’s target audience.
  • As brands expand, aligning locations with core customer bases can drive success while reinforcing brand positioning.

3. Finding Retail Nodes With Complementary Visitation Patterns

Beyond driving traffic potential and demographic alignment, site selection should also ensure that a brand’s identity and operating model are well matched to the visitation patterns of prospective locations. Barnes & Noble offers a clear example. The company’s ongoing resurgence has relied in part on repositioning itself as a local cultural and social hub, with a stronger emphasis on local curation and community-driven events.

And analyzing Barnes & Noble’s 2026 openings shows a clear tilt toward centers with a higher share of local traffic than the chain average – supporting its shift away from a purely transactional retail model toward a more community-centric experience built around local curation, events, and repeat visitation. By prioritizing locally driven centers, the company’s site selection strategy not only captures relevant traffic but also reinforces its broader repositioning as a neighborhood-oriented brand.

Strategic Takeaways: 

  • Site selection strategy should look to align a brand’s identity and operating model with real-world visitation patterns at prospective locations.
  • For brands leaning into local curation, choosing centers with predominantly nearby visitors may be the key to performance and preserving brand identity.

4. Understanding the Benefits of Competitor Proximity

Effective site selection recognizes that proximity to competitors can function as a demand driver, amplifying traffic rather than diluting it.

In practice, this often takes the form of clustering – deliberately locating near similar or complementary concepts to capture shared demand. Shake Shack provides a clear example. Analyzing the chain's store fleet shows that many locations sit near other QSR and fast-casual concepts, creating opportunities to capture dining-based traffic. At the same time, strong cross-visitation patterns indicate that these co-located brands share a common customer base, positioning the brand closer to consumers who are already likely to visit. And, at least for Shake Shack, this strategy appears to be working – traffic to the chain increased 19.9% YoY in Q1 2026.

Strategic Takeaways:

  • As in retail, co-tenancy in the restaurant space can be mutually beneficial – establishing a center as a dining destination, driving incremental traffic, and increasing a brand’s opportunities to win share-of-stomach. 
  • Incorporating cross-visitation analysis into site selection helps pinpoint locations where target customers are already visiting nearby brands. Centers that already attract a brand’s overlapping customer base provide a stronger foundation for incremental growth.

5. Balancing Growth and Cannibalization Risk 

Incorporating trade area analysis into site selection can also help determine whether a new location will generate new traffic or risk cannibalizing existing demand. Aldi, a rapidly expanding grocery chain, offers a relevant example. 

The company opened a fourth Las Vegas store on S Decatur Blvd in October 2025, positioned between existing locations on W Craig Rd and S Rainbow Blvd, approximately eight miles from each. And analyzing the core trade area of each of the four Las Vegas locations indicated limited visitor cannibalization over the last six months, despite the stores’ close proximity. Only 6.2% and 7.6% of the S Decatur Blvd store’s trade area overlapped with the W Craig Rd and S Rainbow Blvd stores’ trade areas, respectively. 

These findings show that there is no one-size-fits-all approach to store spacing – it varies by brand, category, and market. Analyzing a company’s existing store network alongside competitor density and overall demand can help determine how closely locations can be placed without hurting performance. In many cases – especially in high-frequency categories like grocery – markets can support stores that are closer together than expected.

Strategic Takeaways: 

  • Site selection strategy needs to take into account local demand and visitation behavior typical of the category as a whole and of existing locations in particular.
  • Trade area analysis can reveal where a market allows for network densification without significant risk of visit cannibalization.
INSIDER
Report
Physical Retail in 2026: How the Giants Are Winning
Read the report to find out how Walmart, Target, Costco Wholesale, and Dollar General are performing in 2026 – and what their trajectories reveal about broader retail trends.
May 11, 2026

Physical retail is increasingly defined by a small group of dominant players – Walmart, Target, Costco Wholesale, and Dollar General – that span grocery, essentials, and discretionary categories at a scale no other retailers can match. These chains serve as bellwethers of consumer behavior, revealing where Americans are spending, how often they shop, and what drives their decisions. And understanding their visitation patterns sheds light on the key dynamics shaping both their performance and the broader blueprint for retail success in 2026. 

1. Physical Retail is Consolidating

Retail giants Walmart, Target, Costco Wholesale, and Dollar General continue to capture a growing share of brick-and-mortar visits nationwide.

Major Insight:

• The share of physical retail traffic captured by these giants rose from 16.8% in 2019 to 17.5% in Q1 2026, signaling continued sector consolidation.

• The scale advantage enjoyed by retail giants is increasingly self-reinforcing: Larger players benefit from superior data, stronger vendor leverage, and operational efficiencies that in turn further widen the gap. 

Strategic Takeaways: 

• As these advantages compound, direct competition becomes less viable. Instead, smaller retailers should focus on owning specific trip missions – such as convenience, fill-in, or discovery – where format, assortment curation, and in-store experience can more directly shape consumer choice.

• For CRE operators, the growing dominance of these retail giants increases reliance on top-tier anchors, potentially driving performance gaps between centers with strong national tenants and those without.

• For CPG companies, the consolidation in the offline retail space heightens channel concentration, making success with a handful of large retailers critical while increasing those retailers’ negotiating leverage.

2. Costco Wholesale and Dollar General Charge Ahead

Traffic trends across the four giants reveal meaningful divergence in performance.

Major Insights:

• Costco and Dollar General are driving the strongest visit growth, supported by both substantial fleet expansions and rising visits per location. In 2025, visits per store exceeded pre-pandemic levels by 18.1% for Costco and 10.2% for Dollar General, with both brands also seeing steady increases in their share of total brick-and-mortar retail chain visits.

• Walmart remains the largest player by far, accounting for 9.7% of traffic to major brick-and-mortar chains in 2025. And though the behemoth’s share of visits declined slightly in the immediate aftermath of the pandemic, it has held steady over the past three years. 

• Target’s visit share has remained relatively flat over the past three years, reflecting stalled momentum. Still, early 2026 trends point to emerging signs of recovery – with Q1 visits up 8.3% compared to Q1 2019.

Strategic Takeaways:

• Value retail is winning, but in more specialized forms: Dollar General (extreme value + convenience) and Costco (bulk value + loyalty) are driving the strongest traffic growth and rising visits per store, while Walmart’s broad “everyday value” remains steady with slower growth. Target, for its part, is lagging – likely a reflection of the broader bifurcation in retail which has left middle-market players caught between consumers trading down to value and those trading up to quality. 

• For retailers and CPG companies, the broader lesson is that value perception is becoming more nuanced. It’s no longer just about offering low prices at scale, but about how value is delivered – whether through small packs vs. bulk, or quick trips vs. stock-up missions. Success increasingly depends on prioritizing these distinct value formats and investing in channels where store-level productivity is improving.

• For CRE operators, the outperformance of retailers with clearly defined value propositions underscores the importance of mission-driven tenant mix. As shoppers visit with increasingly specific missions in mind, retailers that cater to those missions are outperforming. Tenant strategies should reflect this shift, ensuring complementary offerings that reinforce a cohesive shopping mission.

3. Beyond Walmart, Multiple Winners Emerge Across Markets and Segments

Walmart remains the dominant brick-and-mortar retailer nationwide and across all fifty states. Still, the data suggests there is room for multiple runners-up to succeed across geographies and customer segments.

Major Insights:

• Dollar General, Target, and Costco each attract distinct audience segments. Dollar General attracts a disproportionately high share of the “Mature and Retired Living” segment, while Costco leads among family households, with Target also over-indexing with this group. Among younger “Contemporary Households,” meanwhile – a segment encompassing singles, married couples without children, and non-family households – Target commands the highest share, slightly over-indexing compared to the nationwide baseline. 

• Regional strengths vary significantly, with Dollar General concentrated in the South, Costco dominant in the Northwest, and Target showing more dispersed areas of strength.

• Despite similar overall visit share, Dollar General leads in more states (26 vs. 17 for Target), reflecting broader geographic dominance.

Strategic Takeaways:

• For retailers, the data suggests that growth opportunities are increasingly shaped by localized demographic and geographic dynamics – meaning that targeted, market-specific strategies may be more effective than uniform national approaches.

• Younger “Contemporary Households” remain less locked-in than older demographics, representing a key battleground for future growth.

• For CPG companies, this data highlights that channel strategy is really about building the right mix of retailers, since even large national players reach different types of consumers. 

• CRE operators should ask "which anchor is right for this trade area" rather than "which anchor is strongest," as mismatched tenants can underperform even if they’re nationally dominant.

4. Walmart Sees Broad-Based Growth Across Nearly All Markets

After remaining essentially flat in 2025, average visits per location to Walmart grew 3.5% YoY in Q1 2026. And the retailer’s solid Q1 performance across the U.S. underscores its unique ability to resonate across income levels, geographies, and shopping missions.

Major Insights:

• Walmart posted year-over-year visit growth across nearly all U.S. markets in Q1 2026, reinforcing its role as a universally relevant retailer. 

• The giant’s comparative softness in small parts of the Northeast suggests an opportunity to double down on region-specific assortments, urban-friendly formats, or partnerships to better match local shopping behaviors. 

Strategic Takeaways:

• Walmart’s broad-based growth shows that even as consumers are increasingly willing to visit multiple retailers to get what they want, its Superstore model has solidified its role as a primary stop on the American shopping journey – making it a uniquely reliable anchor for CRE operators.

• For smaller retailers, this underscores the opportunity to win the “second stop” – capturing trips through curated assortments and more tailored in-store experiences that Walmart’s scale is less optimized to deliver.

• For CPG companies, Walmart stands out as a highly attractive partner for broad, efficient reach, given its consistent traffic across markets.

5. Target Shows Early Signs of a Turnaround

Target’s recent performance suggests early momentum in reversing prior softness.

Major Insights:

• Q1 2026 visits to Target rose 5.1% year over year, marking the chain’s first positive visit growth in more than a year, and suggesting that the chain’s new turnaround strategy may be bearing fruit. 

• Gains were driven primarily by visits lasting 30 to 45 minutes, which accounted for 19.6% of overall visits to Target in Q1 2026 – pointing to stronger in-store engagement rather than quick, mission-driven stops.

Strategic Takeaways:

• Target’s return to traffic growth – driven by increases in mid-length trips – signals a sustainable recovery on the horizon, strengthening its reliability as a traffic-driving tenant for CRE operators.

• Target's turnaround shows retailers how increasing shopper engagement can generate growth by converting quick trips into higher-value, multi-category experiences.

• For CPG companies, the rise in mid-length visits indicates a more receptive in-store environment for discovery and trade-up, making Target an increasingly attractive channel for innovation, merchandising, and premium offerings.

6. Dollar General Strengthens Its Role as a Local, Habitual Destination

Dollar General is becoming embedded in consumers’ daily routines. 

Major Insights:

• Visitor frequency to Dollar General is on the rise. In Q1 2026, nearly a quarter of visitors frequented the chain at least four times in an average month, up from 21.2% in Q1 2022.

• Dollar General is becoming increasingly local in nature: As its footprint expands, more visits originate nearby, with 28.0% coming from within one mile – reinforcing its role as a neighborhood store of choice. 

Strategic Takeaways:

• Dollar General’s visitation patterns point to a growing ownership of the convenience mission. Its expanding store density is creating a self-reinforcing network effect, where proximity fuels frequency, and frequency strengthens long-term defensibility. 

• For retailers, Dollar General’s rising share of nearby and high-frequency visits shows that proximity can drive habit, making convenience a powerful lever for building repeat behavior.

• For CRE operators, the data highlights the strength of hyper-local, necessity-driven traffic, positioning Dollar General as a stable tenant that anchors consistent, repeat visitation.

• For CPG professionals, the increase in frequent trips signals a high-velocity purchase environment, favoring smaller pack sizes and products that align with regular replenishment cycles.

7. Costco Sustains Growth Following Fee Hike

Costco continues to grow and diversify its audience despite higher membership fees and stricter food court access policies, highlighting the strength of its value proposition and loyalty model. 

Major Insights:

• In September 2024, Costco raised its membership fees for the first time in seven years – and more recently tightened enforcement of member-only access to its food courts. Despite these changes, visitation has remained strong, highlighting the company’s pricing power and deep customer loyalty.

• At the same time, Costco’s shopper base is broadening, with median household income trending slightly downward while remaining relatively affluent.

Strategic Takeaways:

• Offering strong value to a relatively affluent consumer base can be a winning formula in 2026. Retailers that combine quality, trust, and perceived savings – rather than competing solely on low prices – are well positioned to drive both loyalty and sustained traffic growth.

• For CRE operators, Costco’s sustained traffic growth and broadening shopper base reinforce its value as a standalone, high-demand traffic magnet that can anchor entire trade areas and drive surrounding retail development.

• For CPG companies, the combination of high traffic and declining median HHI signals that Costco is evolving into a scaled channel reaching beyond affluent shoppers, requiring more diversified assortment and pricing strategies.

INSIDER
4 Opportunities the World Cup Will Unlock for Retail, Dining, and Stadiums
AI-powered location insights from major events reveal how the 2026 World Cup will shape audiences and consumer behavior nationwide. 
April 16, 2026

Expanding Engagement Beyond the Stadium

It’s been decades since the U.S. last hosted the World Cup, and anticipation continues to build. While the matches themselves will deliver thrilling moments for fans inside the stadium, a far broader audience is expected to engage from beyond the gates – gathering at bars, watch parties, and living rooms across the country.

Drawing on insights from recent sporting and cultural events, this analysis examines how the World Cup may impact consumer behavior and audiences across stadiums, host cities, and nationwide.

1. World Cup Audiences Will Be Unique – Even Among Major Events

There is No Typical Concert and Sports Audience 

In 2025, MetLife Stadium in East Rutherford, NJ hosted a wide range of concerts and sporting events. And an examination of three – Kendrick Lamar & SZA’s tour stop, the FIFA Club World Cup Final, and a Week 17 New York Jets matchup against division rivals and the Super Bowl-bound New England Patriots – reveals clear differences in audience composition across event types.

Trade area analysis showed that the 2025 FIFA Club World Cup Final drew the largest share of single visitors and the highest median household income (HHI) of the three events – a pattern that could reflect the premium tickets and travel typically associated with a quadrennial championship match.

With the 2026 World Cup elevating the level of global competition, stadiums set to host matches this summer – including MetLife – may see even more dramatic shifts in their audience relative to other events.

Later-stage matches will draw more affluent audiences.

While spectators attending World Cup matches are likely to differ from those drawn to other events throughout the year, audience shifts are likely to occur also within the tournament itself. As the competition progresses and the stakes rise, the visitor profile at host stadiums may trend progressively higher-income, as suggested by an analysis of Levi’s Stadium in Santa Clara, CA during the recent NFL season and Super Bowl.

During the Super Bowl, the stadium’s captured market median HHI surpassed that of every 49ers home game during the 2025-26 season – a pattern consistent with the event’s premium ticket pricing, national draw, and high levels of out-of-market travel.

And since the World Cup only takes place every four years, and necessitates international travel for die-hard fans, attendees are likely to be even more affluent than Super Bowl go-ers. Moreover, as the tournament reaches its later stages, each match becomes more significant and carries the potential to drive an even more affluent in-person audience.

2. World Cup Will Generate Significant Opportunities for Nearby Dining and Entertainment

Tailgaters Expand the Opportunity Beyond Ticketed Guests

Diving deeper into last year’s FIFA Club World Cup Final and Semifinal matches at MetLife Stadium provides further insight into the significance of the in-person audience that doesn’t make it into the stands. While FIFA generally places restrictions on tailgating, the behavior was still observed at MetLife and several other tournament venues in 2025. To put the phenomenon into perspective, location intelligence indicates that on the day of the Club World Cup final, combined visits to MetLife and its parking lots were 24.8% higher than visits to the stadium alone.

AI-powered trade area analysis further contextualizes the economic significance of this audience. During the semifinal matches, MetLife Stadium’s captured market median HHI remained nearly identical – just over $100K – with and without parking lot visitors. A similar pattern held for the Final, where median HHI for both the stadium-only and combined stadium-plus-parking visitors both rose above $115K, with the stadium-only figure only marginally higher.

This suggests that tailgaters represent a significant cohort with discretionary income to spend on the broader match-day experience, even if they opt out of spending big money on tickets.

With tailgating during the 2026 World Cup likely to remain limited due to FIFA regulations, the spending power of fans just outside the stadiums could create opportunities for alternative forms of engagement. Fan zones and other nearby hospitality events may offer effective ways to capture demand.

Strong demand for stadium-adjacent dining and entertainment.

Nearby dining and entertainment venues are among the most accessible experiences for fans in the stadium area, and these stand to benefit significantly from elevated game-day foot traffic.

Analysis of recent FIFA Club World Cup matches reveals the impact of match-day activity on local businesses. Visitor journey data from the June 25th, 2025 matchup between Inter Milan and River Plate at Seattle’s Lumen Field, and the June 28th, 2025 meeting between Palmeiras and Botafogo at Lincoln Financial Field in Philadelphia reveals that a significant share of stadium visitors also stopped at nearby dining and recreation venues on the day. Location intelligence also shows that, on the day of the match, each stadium-adjacent venue received a significant visit boost compared to its 2025 daily average.

This pattern underscores the potential impact of the World Cup on the surrounding commercial ecosystem. The stadium may anchor the experience, but fan engagement will likely spill into adjacent areas – creating opportunities for both organizers and local businesses. To take full advantage, restaurants and bars can position themselves as fan-friendly destinations through watch parties, extended hours, and even mobile or outdoor offerings in stadium corridors.

3. Host Regions Will See Broad Economic Impact

Dining demand will rise as fans converge.

Previous major sporting events – including the Super Bowl – demonstrate that the impact of large-scale sporting moments often extends beyond the immediate stadium vicinity into the broader regional economy.

In the weeks leading up to the latest Super Bowl in Santa Clara, CA on February 8th, 2026, both the San Francisco-Oakland-Berkley and San Jose-Sunnyvale-Santa Clara CBSAs saw a notable uptick in year-over-year dining traffic – outperforming the nationwide average. The timing suggests that early-arriving travellers combined with locals enjoying pre-event concerts and events helped fuel demand. In contrast, nationwide dining traffic saw a more pronounced lift the following week – likely tied to Valentine’s Day on February 14.

This pattern indicates that regions hosting – or located near – World Cup 2026 matches could experience similar pre-event dining tailwinds. As out-of-town visitors arrive and local engagement builds in the days and weeks leading up to key matches, restaurants and hospitality may benefit from elevated demand – particularly when supported by ancillary events and fan experiences.

Matches will drive high-value tourism to host cities.

Other recent examples suggest that cities hosting major events like the World Cup stand to benefit from an influx of out-of-town visitors – particularly those with higher spending power.

Since the beginning of 2025, New Orleans has hosted a series of popular events that drove significant non-local traffic. AI-powered trade area data indicates that during these periods, out-of-market visitors consistently exhibited a higher median HHI than both local residents and typical commuters into the city.

As expected, the 2025 Super Bowl generated the most pronounced spike in out-of-market visitor median HHI among the events analyzed, but the pattern extends beyond one-time spectacles. Recurring events like Mardi Gras and major music festivals also attracted high-income visitors to the city – likely benefitting the local hospitality, dining, and retail industries.

Looking ahead to the 2026 World Cup, host cities are likely to experience a similar dynamic. The tournament’s global draw will likely bring affluent travelers with discretionary dollars to the host regions – visitors that will spend not only on match tickets, but also on accommodation, dining, and shopping. By sponsoring tournament-related festivals, concerts, and experiences in or near retail corridors, cities can amplify the economic impact of the World Cup beyond the stadium.

4. The World Cup’s Impact Will Extend Nationwide

Grocery and party food chains will see repeat visit spikes.

The impact of the 2026 World Cup is unlikely to be confined to the select cities hosting matches. Major sporting events drive large-scale at-home viewership, generating ripple effects nationwide.

The Super Bowl offers a useful benchmark. In the days leading up to February 8th, 2026, visits to grocery stores and pizza chains rose above day-of-week averages for 2025, ultimately peaking on the day of the big game day as households appeared to pick up last-minute fixings and takeout for their watch parties.

This pattern indicates that the World Cup – with its extended schedule and multiple high-stakes matchups – could drive repeated waves of elevated grocery and take-out demand as fans gather together throughout the tournament.

Sports bars will experience elevated match-day traffic.

Of course, at-home viewing is just one piece of the match-day equation. Many fans opt for a more communal experience – gathering at sports bars across the country to watch the game alongside fellow supporters.

Recent highly-anticipated soccer matches offer a clear signal of this behavior. During the recent Allstate Continental Clásico, MLS Cup Final, and SheBelieves Cup Final, top sports bars in key markets like Los Angeles and Miami recorded visit spikes above day-of-week averages.

Not every World Cup fan will be able to attend in-person or travel to a host city, but previous match-day lifts in sports bar traffic demonstrate that fans nationwide will participate in the tournament experience.

One Tournament, Multiple Touchpoints

The 2026 FIFA World Cup is set to engage a wide spectrum of fans – from casual viewers at home to dedicated supporters traveling to stadiums – shaping how and where demand emerges.

As a result, the tournament’s impact will be felt across multiple layers of retail, dining, and tourism. Stadium-centered spending, activity in surrounding corridors, host-city consumer demand, and gatherings of spectators nationwide all point to a broad and interconnected World Cup effect that is likely to shape both audience composition and behavior at scale.

Loading results...
We couldn't find anything matching your search.
Browse one of our topic pages to help find what you're looking for.
For more in-depth analyses on a variety of subjects, explore Reports.
The Anchor Logo
INSIDER
Stay Anchored: Subscribe to Insider & Unlock more Foot Traffic Insights
Gain insider insights with our in-depth analytics crafted by industry experts
— giving you the knowledge and edge to stay ahead.
Subscribe